Non-Contact Guided Waves Tomographic Imaging of Plate-Like Structures
Using a Probabilistic Algorithm
Farabirazy Albiruni
1,+1, Younho Cho
1,+2, Joon-Hyun Lee
2and Bong-Young Ahn
3 1School of Mechanical Engineering, Pusan National University, Busan 607-735, Korea2Korea Institute of Energy Technology Evaluation and Planning, Seoul 135-280, Korea 3Korea Institute of Standards and Science, Daejon 305-340, Korea
A non-contact testing with laser generated ultrasonic transmitter and an air-coupled transducer is very attractive technique in guided wave inspection. It can be used for online inspection and structural health monitoring (SHM) where contact method with embedded sparse sensors can not be applied such as the case of high temperature application. In this paper, tomography based on probabilistic algorithm was employed in conjunction with the hybrid non-contact method. This present approach can be successfully used for detecting, locating and imaging multi-defect in plates. This algorithm is based on the use of signal difference coefficient of guided waves acquired for good and faulty conditions. The simplicity of this algorithm makes it suitable to be implemented to non-contact based online inspection scheme.
[doi:10.2320/matertrans.I-M2011853]
(Received November 11, 2009; Accepted March 11, 2011; Published January 25, 2012)
Keywords: hybrid non-contact ultrasonic, guided wave tomography, plate-like structures, probabilistic algorithm
1. Introduction
Ultrasonic guided waves techniques are of great concern in monitoring many critical plate and pipe-like integrity. The concern is primarily attributed to the ability of such waves to travel along distance in large-scale structures. For this reason, the technique is now well-known for various non-destructive evaluation (NDE) applications as summarized by Rose.1)One
of the main problems in using guided waves is that there are many propagating modes which are in general dispersive. A more quantified NDE tool with guided waves however, is still an important issue to be resolved in order for this technique to be more useful than just a defect screening method.
Guided wave tomography becomes a promising alternative to convert guided wave raw data obtained from time or frequency domain over to visualized results for more quantitative and better signal interpretation. Guided wave tomography can be established with a sparse array. However, most of related works are done with contact based technique such as immersion transducer and conventional piezoelectric (PZT) sensor.2)
The advantage of using contact technique offers its simplicity to generate and received guided wave with reasonably high spatial resolution for image reconstruction. On the other hand, this technique still needs constant coupling condition which is essential for reliability of the technique. In addition when surface of the object rough or geometrically complicated, the contact based technique becomes impractical due to limited accessibility. Conse-quently, the coupling condition can significantly affect the quality of the data in the image reconstruction leading to a poor spatial resolution. Another limitation with contact based technique is severe inspection environment induced by high temperature. Online monitoring for moving object is also another challenging task with contact based technique. In this
sense, a robust non contact based tomography has been highly demanded.
In contrast to contact method, relatively rare works have been performed in non-contact guided wave tomography by limited researcher such as Hutchins37) and Nagata.8) Both
of them used standard parallel projection geometry with velocity or attenuation of guided waves as input for tomographic reconstructions. A filtered back projection (FBP) algorithm was also employed for the reconstruction of the image which consists of following steps; weighting,
filtering, and back projection. Fundamentally, FBP is based on the Fourier slice theorem which related with the measured projection data to the two-dimensional Fourier transform of the object cross section.9)
The important aspect that must be considered in any practical tomography system is, it shall easily capture guided wave data in digitized waveform and automatically interpret in an efficient manner. Unlike bulk wave ultrasonic testing in which gating and peak-detection of waveform amplitude are usually adequate as extract feature for imaging, guided waves need much more sophisticated signal processing in order to identify and select specific mode from various modes and then to extract particular feature as the input for image reconstruction algorithm. In addition, the tomography algorithm employed that consists of signal processing and image reconstruction must run in the framework of real time data collection with portable hardware. If it can be achieved, the guided wave tomography will be a very practical inspection tool for furtherfield application.
The aim of the present work is to develop a non-contact guided waves tomography technique with pulse laser ultra-sonic transmitter and air-coupled receiver for plate-like structure. This hybrid tomographic system is combined with a probabilistic algorithm so called Reconstruction Algorithm for Probabilistic Inspection of Damage (RAPID) for image reconstruction in contrast to FBP algorithm which already used as common algorithm. The RAPID wasfirst introduced by Gao10)for imaging of damage in an aircraft wing. Unlike
+1Graduate Student, Pusan National University +2Corresponding author, E-mail: mechcyh@pusan.ac.kr Special Issue on APCNDT 2009
the previous RAPID algorithm application with embedded PZT sensor array,2,1012)this paper presents an application of
hybrid non-contact guided wave tomography for plate-like structures.
2. RAPID Algorithm
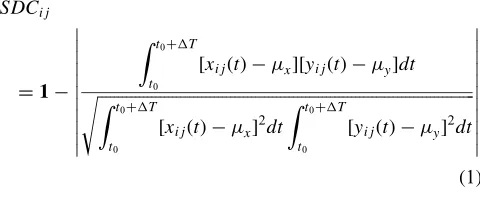
RAPID algorithm is based upon a damage index known as signal difference coefficient (SDC) which is some measure of how different statistically the defect signal is from a baseline/ non-defect signal. Damage indexes for all transducer pairs are spatially distributed and summed to generate an image of the damage area.
Thefirst step of this algorithm is to computeSDCbetween the current signalxijðtÞand the reference yijðtÞwhich is the
drop in the correlation coefficient over a specified time window (note that indexiis for transmitter andjfor receiver, respectively). Mathematically,SDCcan be stated as:
SDCij
¼1
Zt0þT
t0
½xijðtÞ ®x½yijðtÞ ®ydt ffiffiffiffiffiffiffiffiffiffiffiffiffiffiffiffiffiffiffiffiffiffiffiffiffiffiffiffiffiffiffiffiffiffiffiffiffiffiffiffiffiffiffiffiffiffiffiffiffiffiffiffiffiffiffiffiffiffiffiffiffiffiffiffiffiffiffiffiffiffiffiffiffiffiffiffiffiffiffiffiffiffiffiffiffiffiffiffiffiffiffi Zt0þT
t0
½xijðtÞ ®x2dt Z t0þT
t0
½yijðtÞ ®y2dt s
ð1Þ
where
t0¼the direct arrival time for each transducer pair
®x;®y¼mean of the corresponding signals
ðcurrent signal and baseline signalÞ T ¼time window:
The second species of the right hand side from eq. (1) is another way to express a correlation coefficient between two sets of data, the current signalxijðtÞand the referenceyijðtÞ.
Note that both xijðtÞ and yijðtÞ has its specific mean value
represents by ®x and ®y. To calculate the correlation coefficient, we have to calculate the covariance of those two data sets and divided by product of the standard deviation from data sets as expressed in absolute value of eq. (1).
The time window expressed by ¦Tshould cover at least the two modes of Lamb waves as shown by Hay2)in order to
know the difference of the current signal due to the defect’s presence. In other words, the smaller the correlation coefficient value the stronger the indication of the defect’s presence in structure. But of course the optimum¦Tshould also be considered because it will affect the speed of the signal processing. From eq. (1), if the signals are identical, the SDC is zero and if the signals are completely out of phase, theSDCwill achieve its maximum value of 1.
After theSDCvalue for all sensor pairs are calculated, the next step of RAPID algorithm is image reconstruction. Image is generated by distributing spatially each SDCvalue on the image plane in an elliptical pattern where the two foci of the ellipse are the two transducer location. A parameter ¢ controls the size of the ellipse, and the amplitude linearly tapers from its maximum value along the line connecting the ellipse foci to zero on the periphery of the ellipse. Note that
the¢parameter is a shape factor that controls the size of the elliptical distribution. This value can be arbitrary but greater than 1.0.
The spatial distribution function, in whichSDCvalue will distributed atfinal step of algorithm, defines as:
sijðx; yÞ ¼¢¢Rijðx; yÞ
1 for ¢> Rijðx; yÞ
sijðx; yÞ ¼0 otherwise; ð2Þ
where Rijðx; yÞ is the ratio of the sum of distance of the
point ðx; yÞto the transmitteriand receiverj to the distance between the transmitter and receiver and mathematically stated as:
Rijðx; yÞ ¼
ffiffiffiffiffiffiffiffiffiffiffiffiffiffiffiffiffiffiffiffiffiffiffiffiffiffiffiffiffiffiffiffiffiffiffiffiffiffiffiffi
ðxixÞ2þ ðyiyÞ2 p
þ ffiffiffiffiffiffiffiffiffiffiffiffiffiffiffiffiffiffiffiffiffiffiffiffiffiffiffiffiffiffiffiffiffiffiffiffiffiffiffiffiffiðxjxÞ2þ ðyjyÞ2 q
ffiffiffiffiffiffiffiffiffiffiffiffiffiffiffiffiffiffiffiffiffiffiffiffiffiffiffiffiffiffiffiffiffiffiffiffiffiffiffiffiffiffiffiffi
ðxixjÞ2þ ðyiyjÞ2 q
ð3Þ
Finally, the image amplitude at each pixel is a linear summation of the location probabilities from each trans-mitter-receiver pair sijðx; yÞ with the total number of
transmitter-receiver pairs given byNand stated as:
Pðx; yÞ ¼X N1
i¼1
XN
j¼iþ1
SDCijsijðx; yÞ ð4Þ
3. Experimental Procedure
The specimens used in this study are aluminium alloy plate with 1 and 3 mm thicknesses which were introduced artificially fabricated defects. For 1 mm aluminium plate (specimen 1), there is only one artificial defect with 0.5 mm depth, while for 3 mm aluminium plate (specimen 2) contains two artificial defects with depth 1.0 and 1.5 mm as shown in Figs. 1 and 2 respectively.
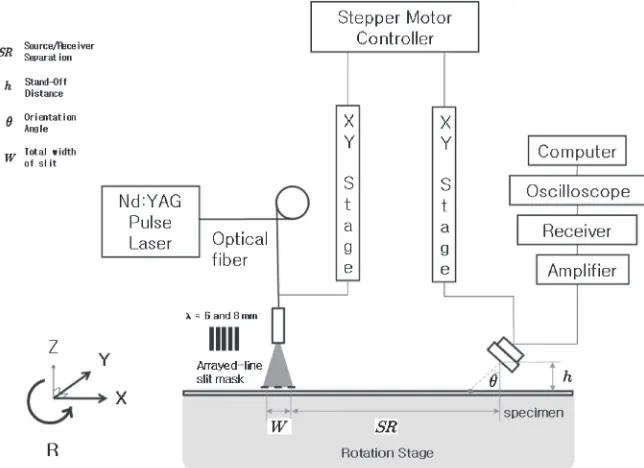
A schematic diagram of the apparatus used to generate and detect the guided waves for hybrid non-contact method is shown in Fig. 3. The laser and the air-coupled transducer were positioned on the same side of the tested specimen and act as the generator and detector respectively. A wavelength from afiberized Nd:YAG pulse laser system used to generate guided waves is 532 nm, while the pulse laser system emits a pulse energy of 32 m J at a repetition rate of 20 Hz.
[image:2.595.50.290.294.393.2]On the laser side, the slit array is utilized to achieve the linearly arrayed light illumination that acts as the line array source of ultrasonic Lamb waves on the surface of the target. This arrayed-line source type also referred as the wavelength matching method is intended to generate the single wave-length of Lamb waves with a narrow bandwidth. The beam of the laser illuminates an arrayed line slit and the transmitted beam acts as a line source on the plates. The 30 mm diameter beam was expanded by the arrayed line slit mask with same spot diameter as the laser beam and was positioned over five elements lenticular array. The line spacing was equal to 6 mm for specimen 1 and 8 mm for specimen 2 respectively.
The spacing of array ¦scoincides with the wavelength of the specific Lamb wave that will be generated. Therefore,
the specific mode of Lamb wave require to be generated can be selected by simply changing the slit spacing.
Selection of the desired mode is performed by drawing a straight line which represents the wavelength on the typical dispersion curves for the phase velocity Cp which contains
a number of guided wave modes. The relation between the wavelength, frequencyf, the phase velocityCp, thickness of
materiald, and the slit spacing array¦sis stated as:
Cp¼f: ¼f:s¼f:d: s
d
ð5Þ
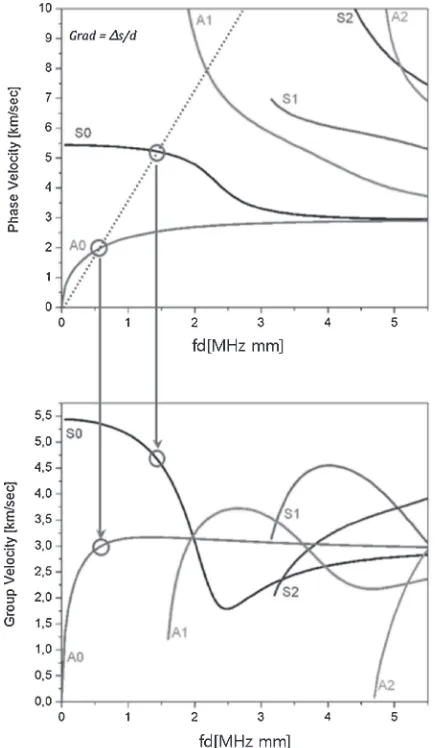
From eq. (5), the diagonal line with a slope ofs=dis shown in the typical dispersion curve in Fig. 4. The active modes of guided waves are determined at the cross-point of this diagonal line with the dispersion curve. From Fig. 4, it is obvious that various modes with different frequencies can be generated simultaneously.
The receiving angle of the air-coupled transducer is determined from phase velocity of the desired mode and the wave velocity in air, based on the following Snell’s law as stated below:
ª¼sin1 Ca
Cp ð6Þ
where ª is the angle for receiving specific mode and Ca
represents the velocity of the propagating wave in the air which is 340 m·s¹1.
In receiver part, we employed unfocused planar transducer with circular aperture type of an air-coupled transducer. It has 10 mm diameter of aperture area. As a receiver this transducer can detect ultrasonic wave in air with frequency range from 40 kHz to 2.25 MHz. The lift-off distance (denotes byh in Fig. 3) of this air-coupled transducer from plate surface is 7 mm.
The successful guided waves generation and acquisition are key prerequisites for practical damage identification technique. Determining the specific mode of guided wave
Fig. 2 Artificial defect on 3 mm aluminium plate (defect’s depth=1 and 1.5 mm).
[image:3.595.50.290.278.485.2] [image:3.595.137.459.534.768.2]that has enough sensitivity toward specific kind of defect is not an easy task. It has been observed that the higher the algebraic product of frequency and plate thickness (fdvalue), the more significant the dispersion phenomena and the more multiple wave mode exist. In this study, only the fundamental modes of Lamb waves (A0 and S0) were considered due to constrain from air-coupled transducer frequency bandwidth (40 kHz2.25 MHz) as shown in Fig. 4. Table 1 gives the frequency, phase velocity, and receiving angle of those two fundamental modes obtained from theoretical phase velocity as shown in Fig. 4.
The sensor positions for specimen 1 and 2 with all possible source-receiver ray paths for both plates are shown in Figs. 5
and 6 respectively. For specimen 1, there were 2©132 sets of data collected from 12 sensor’s positions while for specimen 2, there were 2©380 sets of data collected from 20 sensor’s positions respectively. The baseline sets of data were takenfirst from the specimen without defect and stored as the reference signals.
4. Result and Discussion
4.1 Characteristic of guided waves modes
A time-frequency analysis using wavelet transform was performedfirst to verify the guided wave modes that present on the signal acquired from the specimen 1 and 2 for non defect area. Figure 7 shows the typical wavelet result of specimen 1 in which two modes of the zeroth order of Lamb wave S0 and A0 exist. As can be seen from time-frequency analysis in Fig. 7, the S0 mode has broader frequency range than A0, it spans from 0.5 to 1.2 MHz. This characteristic also observed in specimen 2.
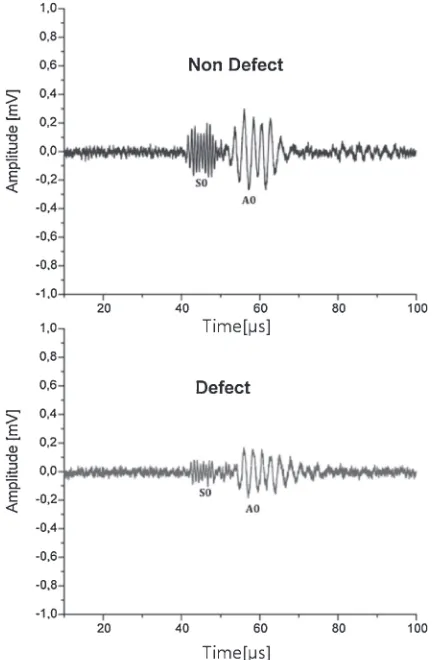
An example of typical waveform in time and frequency domain recorded for baseline signal (defect free-area) and defect area are shown in Figs. 8 and 9, respectively. The waveform has two modes present with a good signal to noise ratio. The time histories of the responses are received by the air-coupled transducer with the receiving angle 4° for specimen 1 and 8° for specimen 2, respectively.
[image:4.595.61.280.70.444.2]Fig. 4 Two fundamental modes of Lamb wave used in this study (specimen 1).
Table 1 Theoretical value of two fundamental modes of lamb wave obtained from dispersion curves.
Specimen Thickness (mm)
Slit Spacing
(mm)
Mode Frequency (MHz)
Phase Velocity
(m·s¹1)
Receiving Angle (Degree)
1 1 6 A0 0.25 1429 13.8
S0 0.87 5429 3.6
2 3 8 A0 0.28 2286 8.6
S0 0.61 4857 4.0
Fig. 5 All possible source-receiver ray paths for specimen 1.
[image:4.595.306.548.76.218.2] [image:4.595.309.548.255.441.2] [image:4.595.46.292.517.609.2]As can be seen from Figs. 8 and 9, there is a difference in signal from baseline and from defect both in time and frequency domain. The observable modes are the faster S0 and significant amplitude drop of A0 in defect signal compare to baseline signal. This hybrid non-contact system using air-coupled transducer as a receiver is very sensitive to antisymmetric mode as can be seen both from time and
frequency domain where amplitude of A0 higher than S0. Thus, the angle tuning of air coupled transducer must be set very carefully in order to get the reasonable amplitude of the received signal not only signal to noise ratio but also amplitude of S0 and A0. The difference in time delay and amplitude drop both for S0 and A0 then compared statisti-cally by applying eq. (1) to get the damage index in term of
SDCfor all sensor pairs. TheseSDCvalues then were used as the input values for image reconstruction using probabilistic algorithm. Although the anti-symmetric mode is more sensitive to detect the signal, it is also better to include the symmetric one to increase the SDC value which correlates linearly with the defect’s presence.
Fig. 7 Time-frequency analysis of received signal (non-defect).
Fig. 8 Typical time domain observed signal.
0,0 0,2 0,4 0,6 0,8 1,0 1,2
0,0 0,2 0,4 0,6 0,8 1,0 1,2
0,0 0,1 0,2 0,3 0,4
Frequency [MHz]
Amplitude [mV]
Non-Defect
0,0 0,1 0,2 0,3 0,4
Defect
Frequency [MHz]
Amplitude [mV]
A0
S0
A0
S0
[image:5.595.138.464.69.291.2] [image:5.595.318.535.327.599.2] [image:5.595.61.279.328.658.2]4.2 Image reconstruction
The image reconstruction result using probabilistic algo-rithm is shown in Figs. 10 and 12, respectively. In Figs. 10(a) to 10(d), it shows the influence of ¢ parameter toward the resulted tomogram of specimen 1. As already stated previously, ¢ parameter is a shape factor which will determine the shape of elliptical path thus will also influence the defect shape speckle. In this study, the best¢value found around 1.005 will give the good approach toward real defect size.
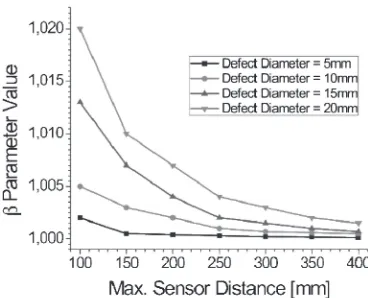
To determine the proper value of ¢ parameter to the resulted tomogram in order to get the good approach between the real defect size and the tomogram result, we varied the sensor distance and half-elliptical shaped defect’s size (defect’s diameter) using boundary element method (BEM). The defect size was varied from 5, 10, 15, and 20 mm with
fixed depth 0.5 mm. The maximum sensor distance was varied from 100 to 400 mm with increment 50 mm. Figure 11 shows the relation between¢parameter value and maximum sensor distance. It is obvious that the¢value is influenced by defect size and maximum sensor distance which has no linear relation with both of these factors. The assigned ¢ value around 1.005 we got from average of ¢ parameter value statistically.
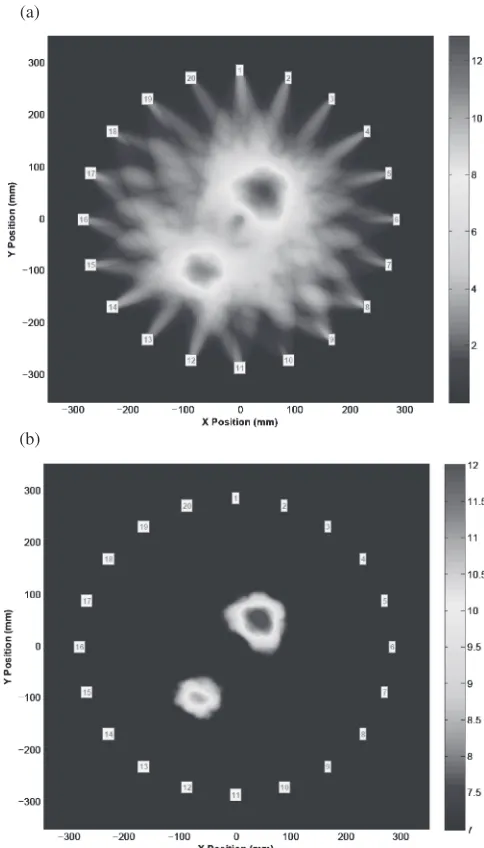
Same procedure also applied to specimen 2 with 20 sensors as shown in Figs. 12(a) and 12(b) where in the last one the addition of denoising procedure to resulted tomogram also employed. The denoising procedure consists offiltering the signal in frequency domain and selecting the proper treshold value for image pixel. From these figures, it is
obvious that probabilistic algorithm can be used successfully for detecting, locating and imaging multiple defects in hybrid non-contact technique using laser generation and air-coupled transducer system.
From our parametric study using boundary element method, the Lamb wave is insensitive for defect’s shape, but sensitive for defect’s depth. For our proposed method here, we can detect down to 10 or 20% defect depth compared to plate thickness with presents Lamb wave modes. From fracture mechanic point of view, the defect’s depth is something more important than defect’s size. In other word, the 10 mm size is a reasonable small defect size that can be detected by our method.
(b) (a)
[image:6.595.104.491.73.389.2](c) (d)
Fig. 10 Image reconstruction of specimen 1 with different values of¢parameter.
[image:6.595.334.518.432.581.2]Further study is also still in progress to know the resolution capability in recognizing multiple defect as an individual one and coverage area of our method. By our proposed method, we got two distinct speckles of the defects separated over 10 20 mm. The larger the coverage area, the need for stronger laser source is also obvious. In our method, we can cover area
as large as 1 meter with the same energy of laser source without decreasing in defect’s detectability.
5. Conclusion
In this study, a probabilistic algorithm was successfully applied to hybrid non contact method using laser ultrasonic transmitter and single air coupled receiver. This algorithm can be successfully used for detecting, locating and imaging defect in large scale plate-like structure both for single and multiple defects respectively. The simplicity of algorithm makes it suitable to be applied for non contact online and automation inspection. Future work will be focused to combine this algorithm with line scanning technique for guided wave in order to give the accurate size and shape of the defect.
Acknowledgement
This research was supported by KRISS (Korean Research Institute of Standards and Science) and BK21 (Brain Korea 21) program. The authors would like to express their gratitude for these financial supports which made this research possible.
REFERENCES
1) J. L. Rose:J. Press. Vess. Technol.124(2000) 273282.
2) T. R. Hay, R. L. Royer, H. Gao, X. Zhao and J. L. Rose:Smart Mat. Struct.15(2006) 946951.
3) D. A. Hutchins, J. K. Hu, R. P. Young, R. Stoner, D. Jansen and Q. L. Zhang:J. Acoust. Soc. Am.85(1989) 747752.
4) D. A. Hutchins, D. P. Jansen and C. Edward: Proc. IEEE Ultrasonic Symposium 2, (1992) pp. 883886.
5) D. A. Hutchins, D. P. Jansen and C. Edwards:Ultrasonics31(1993) 97103.
6) W. Wright, D. A. Hutchins, D. P. Jansen and D. Schindel:IEEE Trans. Ultrason. Ferroelectr. Freq. Control44(1997) 5359.
7) K. S. Ho, D. R. Billson and D. A. Hutchins:Nondestruct. Test. Eval.22 (1997) 1934.
8) Y. Nagata, J. Huang, J. D. Achenbach and S. Krishnaswamy: Review of Progress in QNDE 14, (1995) p. 561.
9) A. C. Kak and M. Slaney:Principles of Computerized Tomographic Imaging, (IEEE Press, New York, 1988) pp. 49110.
10) H. Gao, F. Yan, J. L. Rose, X. Zhao, C. Kwan and V. Agarwala: ASNT Fall Conference & Quality Testing Show Proc., (2005) pp. 412415. 11) X. Zhao, H. Gao, G. Zhang, B. Ahyan, F. Yan, C. Kwan and J. L. Rose:
Smart Mat. Struct.16(2007) 12081217.
12) J. K. Van Velsor, H. Gao and J. L. Rose:Insight49(2007) 532537. (a)
[image:7.595.47.289.70.494.2](b)