ISSN (e): 2250-3021, ISSN (p): 2278-8719
Vol. 08, Issue 8 (August. 2018), ||V (VI) || PP 20-25
Comparison of Object Extracted by Using Digital Image Edge
Detection and image Segmentation
Miss Arwa Mun , Dr. Anita Chaware,
1
Student MCA,
2P.G.Dept of Computer science, S.N.D.T Women’s University
Corresponding Author: Miss Arwa Mun
Abstract:
Object extraction process is closely related with image edge detection and image segmentation process. To extract the object from an image, it can be done either by detecting the edges of the object and differentiating it from its background or by segmenting the image in to different objects based on their similar intensity values. A modified Ant Colony Based Approach is used for image edge detection, it is one of the edge detection methods. Since ACO is a nature inspired meta-heuristic algorithm, which can be applied to a wide range of optimization problems, it is used for edge detection. The heuristic ant colony search function is used to overcome the failure of classical edge detection method, furthermore this method can extract better edges in completeness, robustness. The major disadvantage of ACO edge detection is Compilation time for the large dataset. Thus, even when we consider image segmentation using ACO, the disadvantage of compilation time is still not removed since ACO consists of lot of calculation which increases its complexity. Therefore, to overcome this disadvantage K- Mean Clustering is used for image segmentation. Where K – Mean Clustering is a process of grouping or clustering the pixels with similar intensity values. When the compilation time is compared with modified Ant Colony Based Approach is relatively very less.Index Terms -ACO, edge detection, intensity, K-Mean, object, segmentation.
--- --- Date of Submission: 16-08-2018 Date of acceptance: 03-09-2018 ---
---I.
INTRODUCTION
We divide our paper in to two parts Digital Image Edge Detection using ACO and Image Segmentation using K-Mean Clustering. In this paper we basically compare our output using two different methods. That is, we differentiate between the two methods. The output consists of object that is extracted from a complete image. In this paper we are using digital image for edge detection which means it is representing in numeric value normally binary, of a 2D image. The goal of an edge detection is to produce line drawing of an image.Thus, if we want a particular object, shape or an particular boundary from an complete image, we should gain the complete knowledge of the edges.
There are many methods for edge detection, from which most are based on digital differential methods such as Sobel [1] which has high computation time, Canny[2] also has high computation time as well as it highly sensitive, Prewitt [3]which is highly sensitive to noise, etc. Thus, some researchers have alsotried to study the effect of noise in the images.
Such as ACO as a swarm intelligence approach has been adopted to directly detect image edges by Zhuang, he used ACS (Ant Colony System) to build the perceptual graph of images for extracting edge features. Unfortunately, he was only capable to detect simple edges. [4]
Similarly, Nezamabadi-Pour used AS by applying it to directed graph, he used transition probability function that caused the ants to wander excessively, resulting in edge broadening. Therefore, they had to use a morphological thinning algorithm in order to thin the binary output image. Thus, making its algorithm vulnerable to noise. [5]
J-Tian adopted ACS, he used threshold value to tackle the problem with edge detection. Further, he tried to minimise edge broadening by using complex heuristic function, but it is computationally more expensive and fails on detailed edge detection. [6]
Applications of this edge detection technique are segmentation, object recognition, face recognition, tracking etc.
As we studied the basics of our first part i.e.Edge Detection Similarly, let us study about image segmentation which is also used to give us an object from a complete image.
from which one way is to search for an abrupt discontinuity in an image by looking and comparing the pixel values, which gives us the fair knowledge on edges also known as regions. Similarly, another way to find a region is by comparing the colour values.Segmentation is a process to partition the image in different regions so that it becomes easier to identify the part that we need for our study or any medical use [10]. The major advantage of image segmentation is that it can be used to locate the objects as well as boundaries very easily. More precisely, in image segmentation from a complete image each pixel is assigneda label,which is unique from the other labels of an same image and pixels with the same label share certain characteristics. Each partition here could be a set of pixels which share the common property for example pixel intensity.
There are many methods for image segmentation, from which some are – Graph based image segmentation in this we see the image as a graph that contains nodes and edges. 2nd is Watershed transformation this method takes into account the gradient of the desired image to the segment. 3rd is Region Growing in this we consider 1 pixel of potential area of interest then we try to grow this by binding the adjoint pixels. Similarly, the 4th is a Binary Segmentation in this an object consists of pixels of same grey scale values.
Applications of image segmentation are Object recognition, image compression, image editing, database lookup, etc.
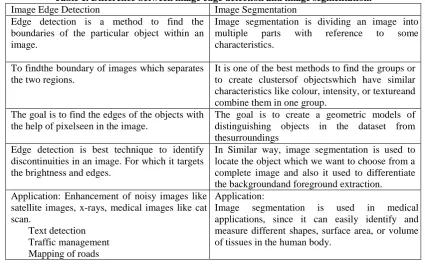
Table 1. Difference between image edge detection and image segmentation.
Image Edge Detection Image Segmentation
Edge detection is a method to find the boundaries of the particular object within an image.
Image segmentation is dividing an image into multiple parts with reference to some characteristics.
To findthe boundary of images which separates the two regions.
It is one of the best methods to find the groups or to create clustersof objectswhich have similar characteristics like colour, intensity, or textureand combine them in one group.
The goal is to find the edges of the objects with the help of pixelseen in the image.
The goal is to create a geometric models of distinguishing objects in the dataset from thesurroundings
Edge detection is best technique to identify discontinuities in an image. For which it targets the brightness and edges.
In Similar way, image segmentation is used to locate the object which we want to choose from a complete image and also it used to differentiate the backgroundand foreground extraction. Application: Enhancement of noisy images like
satellite images, x-rays, medical images like cat scan.
Text detection Traffic management Mapping of roads
Application:
Image segmentation is used in medical applications, since it can easily identify and measure different shapes, surface area, or volume of tissues in the human body.
1. DIGITAL IMAGE EDGE DETECTION USING ACO
ACO algorithms have the ability to integrate information about the problem into the construction of a new solution.
ACO is an interactive, Metaheuristic algorithm which means it is a step by step algorithm which is inspired by the behaviour of real ants. Ants have an ability to secrete a liquid also known as pheromone on their path from colony to food and vice a versa. Similarly, the pheromone has a quality to attract the ants passing from there, thus making a complete single line of each following other. If more ants follow a certain path, this path will be more attractive to be followed by the other ants.
1.1 ALGORITHM STEPS
We are considering a simple ACO algorithm whose function changes as per the requirement of our input. The input we are considering is an image.
ACO consists of 4 basic steps –
1.1.1 Initialization
1.1.2 Construction
At the n-th construction-step of the algorithm, a randomly chosen ant is selected from the total K ants, and this chosen ant moves consecutively on the image for L movement-steps, from the node (l,m) to its neighbouring node (i, j) according to a transition probability which is defined as
P(n)(l.m).(i.j)= (ʈi.j(n-1)) α
(ηi.j) β
Σ(i.j)€Ω(l.m)(ʈi.j(n-1))α (ηi.j)β (1)
The ηi.j matrix is constructed based on local variation intensity value of an image since our input is an image, which is given by [6]
ηi.j = 1/Z Vc(Ii.j) (2)
Where Z = Σj=1:M1 Σj=1:M2 Vc (Ii,j) which is normalization factor, Ii,jis the intensity value of the pixel at the position (i,j) of the image I, the function Vc (Ii,j) is a function that operates on group of pixels is given by [6]
Vc(Ii,j) = f( | Ii-2.j-1- Ii+2.j+1 | + | Ii-2.j+1- Ii+2.j-1|
+ | Ii-1. j-2- Ii+1.j+2 | + | Ii-1. j-1- Ii+1.j+1|
+ | Ii-1.j+2- Ii-1. j-2 | + | Ii-1.j+1- Ii-2.j-1|
+ | Ii-1.j- Ii+1.j | + | Ii.j-1- Ii.j+1|)(3)
To determine the function f(0) in the Vc (Ii,j) function, four functions are considered in Tian’s method, keeping in mind the disadvantages of the Tian’s method the authors Aydin Ayanzadeh, Hossein Pourghaemi and Yousef seyfari came up with a new function (4) by using the linear combinations of former functions. Where μ and φ are the coefficient of the function which have significant effect on extracting the edge in completeness and robustness. [7]
𝑓(𝑥) = 𝜇
𝜋𝑥𝑠𝑖𝑛 𝜋𝑥 /𝛾
𝛾 + 𝜑𝑥𝑠𝑖𝑛 𝜋𝑥/2𝛾 0 < 𝑥 < 𝛾 0 𝑒𝑙𝑠𝑒
(4)
1.1.3 Update the Pheromone Matrix
The Matrix is updated twice, first is when the kth ant will move the nth construction step and the second update is done after all the k ants has moved within each construction step.
1.1.4 Decision
The Final decision is made after the completion of 2nd matrix of pheromone which is the combination of the inner matrix and the evaporation rate of the pheromone which is an important factor and is denoted by ρ.
When our input is an image, a binary decision is made to tell whether certain pixel is edge or not.
2
.IMAGE SEGMENTATION USING K-MEAN CLUSTERINGK – Mean Clustering is a type of unsupervised learning, which mean the goal of k – mean clustering is to find the groups in the data, with the number of groups represented by the variable K and label them. Thus, if the input is an image we won’t be able to label our data of the image thus it comes under unsupervised learning. Data points are clustered based on feature similarity.
Rather than defining groups before looking at the data, clustering allows you to find and analyse the groups that have formed organically. The "Choosing K" section below describes how the number of groups can be determined.
Each centroid of a cluster is a collection of feature values which define the resulting groups. Examining the centroidfeature weights can be used to qualitatively interpret what kind of group each cluster represents.
The advantages of image segmentation using clustering are it gives fast result that is the compilation time is less, it is robust and gives completeness with the object that is extracted after image segmentation using k – means clustering on it.
The major advantage of it is that its used in medical field sin ce the clustering makes the result efficient to read. It is used in Brain MR imaging the result of this is that we can get an image which is divided according to its similar pixels intensity values and gives us the clear view of the tumour differentiating it from the other parts in the brain, thus making it an easier method to detect tumour. [8]
Similarly, it is also used in Leukaemia image segmentation, when the cell is defected it changes its colour thus making easier to detect them by using image segment ation from the other cell. This property makes it easier to detect the Leukaemia cells. [9]
1.2 ALGORITHM AND ITS STEPS
It implements no hierarchical method of grouping objects together because we don’t know the predefined groups.
Determines the centroid using the Euclidean method for distance calculation however the initial centroid can be predefined, which is given by:
𝐷𝑖𝑠𝑡𝑎𝑛𝑐𝑒 [ 𝑥, 𝑦 , 𝑎, 𝑏 ] = (x − a )2+ (x − b)2(5)
It groups the objects based on minimum distance. The algorithm steps to be followed are:
- Set of observation points given by {X1, X2, X3, …., Xn}
- K – sets of clustering denoted by {S1, S2, …,Sk}
- Take these points and put them in each of these clusters and each of these clusters will have predefined centroid which is given by this equation
𝑉 = 𝑥𝑖 − 𝜇𝑖 2 𝑖
(6)
- Minimize within clusters sum of squares also called as WCSS till the point where it converges. For example, we have 3 points A, B, C, D, E we usually define 2 centroids
centroid1 = A, B, C centroid2= D, E.
- After assigning respective centroids, we calculate new mean value or the centroid value until we reach convergence point.
II.
EXPERIMENTAL RESULTS
We can divide our Result in to two parts Digital Image Edge Detection using ACO and Image Segmentation using K – mean clustering.
1.3 RESULT: IMAGE EDGE DETECTION USING ACO
The method that is used depends on J Tian method which was then further extended byAydin Ayanzadeh, Hossein Pourghaemi and Yousef seyfari.
The overall results show efficiency, fix threshold is used in this proposed method for simplicity. This threshold value was gained after uttermost trial and error.
In the similar way the optimized value was set, to obtain an efficient result in simulation as compared with output obtained by the other methods.
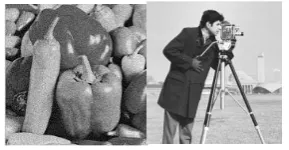
We are using cameraman as an input image in our study. The resolution of all the images used 8bit per pixel and the size of them are 128*128.
As we compare this experiment with respect to the other edge detection techniques as well as with the methods the other researchers came up with we find out that it has higher accuracy, more completeness, robustness, finer details and less computational time than J-Tian methods.
Even though the nezamabadi output shows much more edge as compared to the proposed output but still in the proposed output the morphological is not used to thin the edge thus improving the performance.
Fig 1: Output Image where p = 0.0001 .* ones(size(img)), alpha = 10, beta = 0.1, rho = 0.1, phi = 0.05.
Fig 2: Tested images for Elapse Time
Similarly, the parameters make a large difference in an algorithm. The list of parameters includes the factors that are related to Ant Colony System. The parameters consist of Heuristic information, Pheromone Quantity, number of ants, ant memory and so on. For example, if we increase the quantity of pheromone the rat of evaporation will also increase thus giving us a blur and not satisfied image.
Even the permissible range of ant’s movement has significant effect in the performance of work, the permissible range could be either 4 or 8 connectivity neighbourhood.
The main aspect of this method is its elapsed time. Based on dimensions of the input image, there is a significant increase in the elapse time of the algorithm. Thus, we say that Dimension of an image is directly proportional to the computation time. An increase in computational time was witnessed when the dimensions of the images were 512*512 and higher.
1.4 RESULT: IMAGE SEGMENTATION USING K – MEAN CLUSTERING
As we see that the disadvantages of previous techniquesbecome advantages for the next one. Similarly, the disadvantage that increase in dimension of an image leads to increase in computation time. That is why we are using image segmentation to increase our computation time.
So why not ACO rather than k – means clustering. That is because ACO takes long search time and whenever we use ACO there is large amount of calculation.
Image segmentation using k – means clustering allows us to use coloured images as our input.
Fig 3: Output image where K=2, KMI=10
Even the computation time taken by it is relatively less as the output we are getting performs the same function that is to extract an object from the complete image differentiating it from its background.
Fig 4: Tested images for Elapse Time
It is also a better option to use in medical field due to its property of taking relatively less compilation time and giving a clear output where the extracted object can be easily identified.
Tested Methods Elapsed time of tested images Cameraman Pepper Image Edge Detection Using ACO 134.375446 136.375446 Image Segmentation using K-
Means Clustering
8.994048 33.453547
III.
CONCLUSION
International organization of Scientific Research 25 | P a g e
colony optimizations such as J-Tian method and Nezambadi method. But the disadvantage faced while computing this process is elapse time increases with the very large dataset. Thus, to overcome this disadvantage we came up with image segmentation using k – means clustering, which when compared to its previous techniques gives better result in completeness, robustness.When we compare it with image edge detection using ACO the compilation time it took is also relatively less. Which becomes a major advantage for us since the goal that we needed to reach is achieved.
REFERENCES
[1]. Sobel E. Camera Models and Machine Perception. Ph.D thesis. Stanford University, Stanford, California; 1970.
[2]. J. Canny, A computational approach to edge-detection, IEEE Trans Pattern Anal. Mach. Intell. 8 (1986) 679-698.
[3]. J.M.S. Prewitt “Object Enhancement and Extraction” in “Picture processing and Psychopictorics”, Academic Press, 1970.
[4]. X, Zhuang, Edge feature extraction in digital images with the ant colony system, in IEEE; International Conference on Computational Intelligence for Measurement Systems and Applications, vol. 197, 2004, pp. 133-136.
[5]. H. Nezamabadi-pour, S.Saryazdi, E.Rashedi, Edge Detection using ant algorithms, Soft Comput 10 (2006) 623-628.
[6]. Tian, J., Yu, W., Xie, S.: An Ant Colony Optimization algorithm for image edge detection. In: Proc. IEEE Congress on Evolutionary Computation, Hongkong, China, pp. 751-756(June 2008).
[7]. 2015 2nd International Conference on Knowledge-Based Engineering and Innovation(KBEI), Aydin Ayanzadeh, Hossein Pourghaemi, Yousef seyfari, “A modified Ant Colony Based Approach to Digital Image Edge Detection”.
[8]. https://www.hindawi.com/journals/cmmm/2015. [9]. https://pdfs.semanticscholar.org/f92a.
[10]. https://www.researchgate.net/post/What_is_the_crucial_difference_between_segmentation_and_edge_det ection.