This work was supported by the Natural Science Foundation of Hebei Province, China (No. F2011203219, No. F2013203124) and the Key Program of Research on Science and Technology of Higher Education Institutions of Hebei Province, China (No. ZH2012028).
A Robust Collaborative Recommendation
Algorithm Based on Least Median Squares
Estimator
Fuzhi Zhang, Shuangxia Sun
School of Information Science and Engineering, Yanshan University, Qinhuangdao, China
The Key Laboratory for Computer Virtual Technology and System Integration of Hebei Province, Qinhuangdao, China
Email: [email protected], [email protected]
Abstract—The existing matrix factorization based collaborative recommendation algorithms have lower robustness against shilling attacks. With this problem in mind, in this paper we propose a robust collaborative recommendation algorithm based on least median squares estimator. We first propose a method of weight calculation to filter out the largest residuals by introducing the least median squares estimator (LMedS-estimator) of robust statistics, which can reduce the increment of target item’s feature vector caused by shilling attacks. Then we apply the method of weight calculation to RLS-estimator in order to realize the robust estimate of user feature matrix and item feature matrix. Finally, we develop a robust collaborative recommendation algorithm to make predictions. Experimental results on two different-scale MovieLens datasets show that the proposed algorithm outperforms the existing methods in terms of both theprediction accuracy and robustness.
Index Terms—shilling attacks, robust collaborative recommendation algorithm, least median squares estimator, reweighted least squares estimator, robustness
I INTRODUCTION
Collaborative filtering is the most successful recommendation technique which has been widely used in e-commerce recommender systems [1]. Collaborative filtering algorithms [2] can be generally categorized as either memory-based algorithms [3] or model-based algorithms [4]. Memory-based algorithms generate predictions based on the similarity between users and items respectively. Model-based algorithms use training data to generate a model, and then the model is used to predict the ratings for the items that have not been rated.
Due to the openness of recommender systems, malicious users can manipulate their output by injecting a large number of fake profiles into the systems’ rating database. Such behavior has been referred to as shilling attacks [5]. To distinguish the genuine profiles, we usually call the fake profiles as attack profiles. For the different purposes of attacks, shilling attacks can be divided into push attacks and nuke attacks [6]. Common
attack types include random attack, average attack, bandwagon attack, etc. [7] [8]. To reduce the influence of shilling attacks, we can perform attack detection before recommendation or enhance the inherent robustness of recommendation algorithms. In the field of recommender systems, robustness refers to the ability of a recommender system to provide stable recommendations when its rating database is contaminated with some portion of noisy or attack profiles. In this paper, we focus on developing a robust collaborative recommendation algorithm [9].
Matrix factorization (MF) [10] is one of the most widely used methods in collaborative recommender systems. The MF models proposed in [11] [12] [13] [14] are the extension of basic MF by taking into account user biases, item biases and their interaction, a neighborhood model among items, and temporal effects respectively. But the item biases and neighborhood model are vulnerable to shilling attacks. Moreover, the least squares estimator is sensitive to outliers.
The probabilistic matrix factorization model in [15] transforms the prediction problem to an optimization problem, which can be applied to very large datasets and perform better in the circumstances that users havefew or no ratings. The probabilistic latent semantic analysis model in [16] can trim most ofattack profiles through the hidden dependencies between users and items, which is based on the calculation of users’ conditional probability under different latent variables. But this method is only suitable for large-scale attacks. In [17], the variable selection method based on principal component analysis is proposed to detect and eliminate suspicious users. This method can successfully detect suspicious users on average attacks, but it requires high similarity between attack profiles.
(LS-estimator), LTS-estimator trims part of the largest residuals, which may cause the loss of information for genuine users. In addition, the threshold should be as close as possible to the number of genuine users, which is difficult to realize in practice. The L-estimator is introduced in [20], which defines a weight function by quartiles to limit the scope of the objective function. This method can reduce the influence of attack profiles, but the L-estimator completely ignores part of the data which may include information of genuine users. For this reason, the precision of the matrix factorization based on L-estimator is low.
In [21], we present a robust collaborative filtering recommendation algorithm based on multidimensional trust model which measures the credibility of ratings of users from different aspects. This algorithm selects the trustworthy neighbors to generate recommendations and shows better robustness in comparison with other neighbor-based recommendation algorithms.
As mentioned above, the existing collaborative recommendation algorithms based on matrix factorization have the following limitations.
1) The estimate of the parameters is sensitive to outliers.
2) The robustness of the recommendation algorithms is relatively poor when facing shilling attacks.
To address the above problems, in this paper we propose a robust collaborative recommendation algorithm based on least median squares estimator. The main contri-butions include:
1) We introduce LMedS-estimator and RLS-estimator of robust statistics to realize the robust estimate of user feature matrix and item feature matrix.
2) We present a method of weight calculation based on median to filter out the largest residuals, which can reduce the increment of target item’s feature vector caused by shilling attacks.
3) We devise a robust collaborative recommendation algorithm and conduct experiments on two different-scale MoviLens datasets to demonstrate its effectiveness.
II MATRIX FACTORIZATION MODEL
The matrix factorization models (MF) treat matrix factorization as a subspace fitting problem, which map user-item information into a latent feature space. Roughly speaking, MF methods use the linear combination of user factor and item factor to explain the specific user’s preferences for the particular item. The expression is as follows:
ˆ T
=
R Q P (1) where ˆR is the matrix of rating predictions,
( , , )1 n
"
Q q q is the f×n item feature matrix, f is the number of features in the given factorization, qi is a f-dimensional feature vector for item i, P( , ,p1 " pm) is the f×m user feature matrix, pu is a f-dimensional
feature vector for user u. Let R be the rating matrix, U be the set of users, I be the set of items, n be the total
number of users, m be the total number of items, rui be the rating of user u to item i, rˆui be the predicted rating, the expression is as follows:
ˆui r = T×
i u
q p (2)
In matrix factorization models, the feature matrix P and Q are obtained by minimizing function:
ˆ
: arg min= P,QL( = T )
Q, P R Q P, R (3) To avoid over-fitting, the normalization factor can be added to the object function:
ˆ ˆ
: arg min= , L( = T )+ Ωλ ( )
, P Q ,
Q P R Q P R R (4) where λ is a constant.
III LEAST MEDIAN SQUARES BASED MATRIX FACTORIZATION (LMedSMF)
A. Definitions
Definition 1. (Residual). Residual is the difference
between observed value and regression estimate, that is the difference between real rating and prediction, denoted by eui.
ˆ
ui ui ui
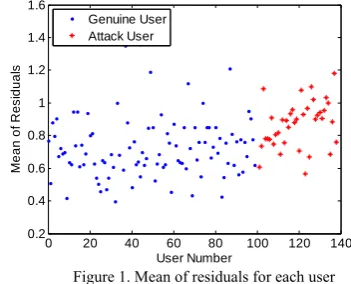
e = −r r (5) The reliability of data or other interferences can be obtained by the residual analysis. From the analysis of Equation 5, we know that eui is larger when rui is larger. In general, rui always has the maximum value for push attacks, which means the attackers tend to have larger residuals. The mean of residuals for each user is depicted in Fig. 1. As is shown in Fig. 1, residuals of attack users are larger than those of the most genuine users.
0 20 40 60 80 100 120 140 0.2
0.4 0.6 0.8 1 1.2 1.4 1.6
User Number
M
ean of
R
e
s
idual
s
Genuine User Attack User
Figure 1. Mean of residuals for each user
Definition 2. (Breakdown point). Breakdown point is
the smallest proportion of outliers that an estimate will bear, denoted by
ε
∗.In robust estimate, the breakdown point is usually used as a metric to measure the anti-interference ability for multiple outliers. The higher the breakdown point is, the better the anti-interference ability is.
Definition 3. (LMedS-estimator). Let eui be the
residual of user u∈U to item i∈I , then LMedS-estimator is to minimize the median of squared residuals, that is the solving of model parameters
, ∗ ∗
q p :
2 0 arg min (
, )
ui
ui r med e
>
∗ ∗ =
where med( )⋅ is a median calculation function.
By the Huber method [22], we can get the breakdown point of LMedS-estimator ε∗=(
[
N/ 2]
− +f 2) /N , where N is the number of ratings in rating matrix. The breakdown point of LMedS-estimator all depends on N, since f is much less than N. When N→ ∞ , the LMedS-estimator has the largest breakdown point50%
ε∗= . Therefore, the anti-interference ability of
LMedS-estimator for multiple outliers is well.
Since LMedS-estimator is to minimize the scatter of the residuals and it converges like n−1 3, this slow rate of convergence can be improved by introducing RLS-estimator. Therefore, the two estimators can be combined and applied to matrix factorization model.
Definition 4. (RLS-estimator). Let eui be the residual
of user u∈U to item i∈I, then RLS-estimator is to minimize the sum of reweighted squared residual, that is the solving of model parameters q∗ ∗,p :
2
0
arg mi
)
,
n
(
ui
ui ui
r
w e
e
>
∗ ∗ =
∑
×
q
p
(7)where w(eui) is a weight function constructed by LMedS-estimator in this paper.
The efficiency of LMedS-estimator is low when the noises of data is Gaussian distribution, so the scale factor S should be defined before the construction of weight function. The expression is given by:
2 2
1 (1 ) ( )ui
k
S k med e
N f
= × + ×
− (8)
where N is the number of ratings in the rating matrix, k1 is an asymptotic correction factor by which LMedS-estimator can have the same efficiency as the least squares estimator when the noises of data is Gaussian distribution, k2 is the correction coefficient which makes the estimator approximately unbiased. In this paper, we set k1=1.4286, k2=5.
We can define the weight function w(eui) based on LMedS-estimator and scale factor S, the expression is given by:
1,
0 (
,
) i
ui
u e
h S
otherwise w e
⎧ ≤
⎪
=⎨
⎪⎩ (9)
where h is a constant. B. The LMedSMF Algorithm
The core idea of LMedSMF algorithm is as follows. 1) Factorize the rating matrix, and realize the initialization of feature matrix P and Q, R=QTP.
2) Calculate the residual between real rating and prediction, eui=rui− ×
T i u
q p , define the scale factor S, and then define the weight function w(eui) by S to get the reweighted squared residual.
3) Construct the objective function of RLS-estimator
by w(eui), calculate parameters of the model by stochastic gradient descent, which will obtain the feature matrix P and Q.
4) Generate recommendation for the target user, ˆ = T
R Q P.
Based on the above steps, the description of LMedSMF algorithm is described as follows.
Algorithm: LMedSMF
Input: rating matrix R, the set of users U, the set
of items I, the number of hidden categories f.
Output: the feature matrix for user, item P, Q.
1 Initialize the feature matrix P = p( , ,1 " pm), ( , , )
= 1 " n
Q q q
2 repeat
3 for each u∈U do
4 for i∈I do
5 if rui ≠0 then
6 eui←rui− × T i u
q p
7 ( )2
ui median←med e
8 2
1 (1 )
k
S k median
N f
← × + ×
−
9 if eui h S ≤ then 10 w e( )ui ←1 11 else
12 w e( )ui ←0 13 end if
14 fork=1 to fdo
15 qik ←qik + ×γ w e( )ui × ×eui puk 16 puk← puk+ ×γ w e( )ui × ×eui qik 17 end for
18 end if
19 end for
20 end for
21 untilP, Q no longer changes
22 returnP, Q
VI EXPERIMENTAL EVALUATION A. Experiment Data and Settings
To evaluate the performance of LMedSMF algorithm, we select two different-scale MovieLens datasets as the experimental data in this paper.
1) MovieLens 100K dataset. This dataset contains of 100,000 ratings from 943 users on 1,682 movies. Movies are rated on a scale of one to five, and each user has rated at least 20 movies.
2) MovieLens 10M dataset. This dataset contains of 10,000,054 ratings from 71,567 users on 10,681 movies. Movies are rated on a scale of one to five, and each user has rated at least 20 movies.
The two datasets are all divided randomly in a ratio 80:20 into training and test sets. Attack profiles are all target the same item that is selected at random, and the attack profiles are generated with various attack types at various filler sizes across various attack sizes for push attacks, respectively.
B. Evaluation Metrics
The root mean squared error (RMSE) and prediction shift (PS) are used to measure the performance of the proposed algorithm.
RMSE is commonly used in recommender systems as the measurement of accuracy, and it is defined as follows:
2
, ˆ
E
1 (
R SM u U i I ui ui)
U r r
∈ ∈ −
=
−
∑
(10)PS measures the effectiveness of attacks by the differences between predictions before and after attacks, and it can be defined as follows:
, (ˆ ˆ )
PS u U i I rui rui
U
∈ ∈ ′ −
=
∑
(11)where PS denotes the prediction shift for user u on item i, ˆui
r′ and rˆui are predictions after and before attacks respectively.
C. Experimental Results and Analysis on the MovieLens 100K dataset
To evaluate the performance of LMedSMF algorithm, we conduct experiments on the MovieLens 100K dataset and compare LMedSMF with M-estimator based matrix factorization (MMF) and LTS-estimator based matrix factorization (LTSMF) in terms of accuracy and prediction shift metrics. TABLE I, TABLE II and TABLE III show the comparison of RMSE and PS for three algorithms with various attack types at various filler sizes across various attack sizes.
TABLE I.
COMPARISONOF RMSE AND PS ON THEMOVIELENS100KDATASET FOR THREE ALGORITHMSWITH AVERAGE ATTACK
Attack size 1% 2% 5% 10% 20%
Filler size 1% 3% 1% 3% 1% 3% 1% 3% 1% 3%
MMF RMSE 0.9571 0.9577 0.9583 0.9573 0.9568 0.9568 0.9574 0.9555 0.9561 0.9551 PS 0.7999 0.7183 1.2864 1.0380 1.6708 1.1809 1.8204 1.3095 1.8029 1.4524 LTSMF RMSE 0.9538 0.9546 0.9532 0.9539 0.9533 0.9524 0.9533 0.9524 0.9514 0.9515 PS 0.7875 0.6245 1.1431 0.9229 1.4122 1.0545 1.5807 1.1916 1.5658 1.3480 LMedSMF RMSE 0.9506 0.9514 0.9507 0.9500 0.9509 0.9507 0.9512 0.9502 0.9495 0.9498 PS 0.7076 0.5651 1.0406 0.8366 1.3259 1.0355 1.4117 1.1013 1.3861 1.2617
TABLE II.
COMPARISONOF RMSE AND PS ON THEMOVIELENS100KDATASET FOR THREE ALGORITHMSWITH AOP ATTACK
Attack size 1% 2% 5% 10% 20%
Filler size 1% 3% 1% 3% 1% 3% 1% 3% 1% 3%
MMF RMSE 0.9584 0.9587 0.9581 0.9587 0.9592 0.9587 0.9586 0.9596 0.9587 0.9596 PS 0.7430 0.7184 1.1040 1.0210 1.5622 1.3788 1.6526 1.4529 1.6749 1.5300 LTSMF RMSE 0.9536 0.9548 0.9544 0.9531 0.9538 0.9537 0.9537 0.9549 0.9551 0.9540 PS 0.7389 0.6677 1.0348 0.9522 1.3465 1.2080 1.5199 1.3692 1.5914 1.4539 LMedSMF RMSE 0.9518 0.9515 0.9522 0.9518 0.9517 0.9515 0.9515 0.9528 0.9521 0.9528 PS 0.7137 0.6109 0.9920 0.8763 1.2687 1.1726 1.3373 1.2568 1.3846 1.3367
TABLE III.
COMPARISONOF RMSE AND PS ON THEMOVIELENS100KDATASET FOR THREE ALGORITHMSWITH RANDOM ATTACK
Attack size 1% 2% 5% 10% 20%
Filler size 1% 3% 1% 3% 1% 3% 1% 3% 1% 3%
As shown in TABLE I, TABLE II and TABLE III, the RMSE of MMF is the largest, LTSMF’s comes the second, and the RMSE of LMedSMF is the smallest. Therefore, the accuracy of LMedSMF algorithm is better than that of MMF and LTSMF.
From the comparison of PS in TABLE I, TABLE II and TABLE III, it can be seen that MMF exhibits a poor performance on robustness, LTSMF works better than MMF, and LMedSMF shows the best robustness. With the increase of attack size, PS of the three algorithms increases gradually, but the growth of PS for LMedSMF is the slowest. Take the PS in TABLE I for example, when the attack size is 2% and filler size is 1%, the robustness of LMedSMF is improved by 10% and 24% respectively compared with LTSMF and MMF. For the same attack type and attack size, the general trend of PS for the three algorithms is approximately the same at
filler size 1% and 3%, but the superiority of LMedSMF is still obvious. Take the PS in TABLE II for example, when theattack size is 2% and filler size is 3%, the robustness of LMedSMF algorithm is improved by 8% and 15% respectively compared with LTSMF and MMF.
D. Experimental Results and Analysis on the MovieLens 10M dataset
To further evaluate the performance of LMedSMF algorithm, we also conduct experiments on the MovieLens 10M dataset and compare LMedSMF with MMF and LTSMF in terms of accuracy and prediction shift metrics. TABLE IV, TABLE V and TABLE VI show the comparison of RMSE and PS for three algorithms with various attack types at various filler sizes across various attack sizes.
TABLE IV.
COMPARISONOF RMSE AND PS ON THEMOVIELENS10MDATASET FOR THREE ALGORITHMSWITH AVERAGE ATTACK
Attack size 0.1% 0.2% 0.5% 1% 2%
Filler size 0.5% 0.8% 0.5% 0.8% 0.5% 0.8% 0.5% 0.8% 0.5% 0.8% MMF RMSE 0.9510 0.9502 0.9505 0.9506 0.9509 0.9501 0.9520 0.9523 0.9523 0.9505
PS 0.5871 0.5514 0.7432 0.7252 1.2579 1.2621 1.6304 1.6804 1.8913 1.9064 LTSMF RMSE 0.9493 0.9470 0.9497 0.9479 0.9479 0.9479 0.9478 0.9473 0.9475 0.9476 PS 0.5756 0.5655 0.7588 0.7008 1.3593 1.2934 1.6860 1.6738 1.8318 1.8879 LMedSMF RMSE 0.9424 0.9415 0.9415 0.9428 0.9431 0.9429 0.9417 0.9427 0.9429 0.9433 PS 0.5486 0.5265 0.5850 0.6288 0.9068 0.8879 1.2758 1.3668 1.7946 1.8345
TABLE V.
COMPARISONOF RMSE AND PS ON THEMOVIELENS10MDATASET FOR THREE ALGORITHMSWITH AOP ATTACK
Attack size 0.1% 0.2% 0.5% 1% 2%
Filler size 0.5% 0.8% 0.5% 0.8% 0.5% 0.8% 0.5% 0.8% 0.5% 0.8% MMF RMSE 0.9503 0.9502 0.9508 0.9516 0.9506 0.9506 0.9531 0.9532 0.9565 0.9550
PS 0.5596 0.5692 0.7386 0.7696 1.2486 1.2549 1.7496 1.8395 1.9719 0.9532 LTSMF RMSE 0.9475 0.9482 0.9467 0.9480 0.9489 0.9487 0.9486 0.9486 0.9509 0.9503 PS 0.5523 0.5527 0.7187 0.7183 1.2796 1.2561 1.7515 1.7400 1.9694 1.9544 LMedSMF RMSE 0.9412 0.9425 0.9412 0.9415 0.9417 0.9421 0.9431 0.9436 0.9442 0.9435 PS 0.5507 0.5438 0.6160 0.6295 0.8436 0.9579 1.3061 1.2336 1.7693 1.8079
TABLE VI.
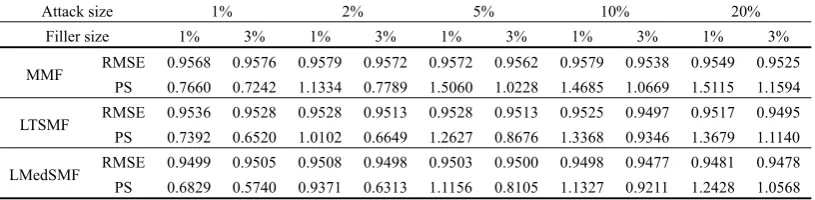
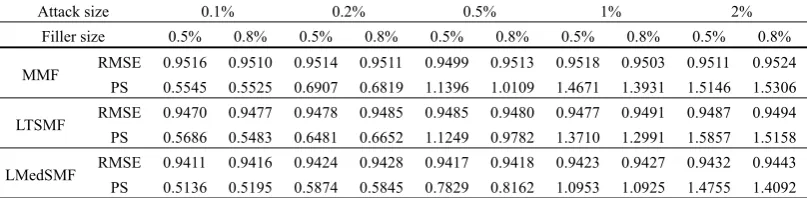
COMPARISONOF RMSE AND PS ON THEMOVIELENS10MDATASET FOR THREE ALGORITHMSWITH RANDOM ATTACK
Attack size 0.1% 0.2% 0.5% 1% 2%
Filler size 0.5% 0.8% 0.5% 0.8% 0.5% 0.8% 0.5% 0.8% 0.5% 0.8% MMF RMSE 0.9516 0.9510 0.9514 0.9511 0.9499 0.9513 0.9518 0.9503 0.9511 0.9524
PS 0.5545 0.5525 0.6907 0.6819 1.1396 1.0109 1.4671 1.3931 1.5146 1.5306 LTSMF RMSE 0.9470 0.9477 0.9478 0.9485 0.9485 0.9480 0.9477 0.9491 0.9487 0.9494 PS 0.5686 0.5483 0.6481 0.6652 1.1249 0.9782 1.3710 1.2991 1.5857 1.5158 LMedSMF RMSE 0.9411 0.9416 0.9424 0.9428 0.9417 0.9418 0.9423 0.9427 0.9432 0.9443 PS 0.5136 0.5195 0.5874 0.5845 0.7829 0.8162 1.0953 1.0925 1.4755 1.4092 As shown in TABLE IV, TABLE V and TABLE VI, the
RMSE values of the three algorithms are smaller than those of in TABLE I, TABLE II and TABLE III. In addition, the accuracy of LMedSMF algorithm is still better than that of MMF and LTSMF.
From the comparison of PS in TABLE IV, TABLE V and TABLE VI, it can be seen that the robustness of LMedSMF has improved significantly compared with MMF and LTSMF. Take the PS in TABLE IV for
example, when the attack size is 1% and filler size is 0.8%, the robustness of LMedSMF is improved by 31% and 32% respectively compared with LTSMF and MMF.
and M-estimator.
E. The Influence of Parameter on PS
To illustrate the influence of parameter h (see Equation 9) on prediction shift of LMedSMF algorithm, we conduct experiments on the MovieLens 100K dataset with various attack types at 2% attack size and 1% filler size, and experiments on the MovieLens 10M dataset with various attack types at 0.2% attack size and 0.5% filler size. The prediction shift curves with different h under average attack, AoP attack, and random attack are depicted in Fig. 2 and Fig. 3 respectively.
0.5 1 1.5 2 2.5 3 3.5 4 4.5 5 0.9
0.95 1 1.05 1.1 1.15
h
P
redi
ct
ion S
hi
ft
average attack AoP attack random attack
Figure 2. The prediction shift curves with different h on the MovieLens 100K dataset
1 1.5 2 2.5 3 3.5 4 4.5 5 0.58
0.59 0.6 0.61 0.62 0.63 0.64
h
P
redi
ct
ion S
hi
ft
average attack AoP attack random attack
Figure 3. The prediction shift curves with different h on the MovieLens 10M dataset
As is shown in Fig. 2, when h is greater than 1 and less than 2.5, with the increase of h, the prediction shift of LMedSMF under three attack types reduces gradually. But when h is greater than 2.5, the prediction shift increases gradually. When h is equal to 2.5, the smallest prediction shift will be obtained, that is to say the weight function w(eui) will achieve the best effect when h=2.5. Similarly, the prediction shift of LMedSMF in Fig. 3 is also the smallest when h=2.5. Therefore, we set h to 2.5.
V CONCLUSIONS AND FUTURE WORK
In this paper we propose a robust collaborative recommendation algorithm based on least median squares estimator. We introduce the LMedS-estimator and RLS-estimator to realize the robust estimate of feature matrix P and Q. Compared with the existing robust recommendation algorithms, LMedSMF is a more accurate and comprehensive method which minimizes the influence of shilling attacks. Furthermore, the LMedSMF
algorithm has both MMF’s and LTSMF’s advantages, which can effectively improve the robustness of algorithm. In our future work, we will focus on improving the accuracy of LMedSMF algorithm.
ACKNOWLEDGMENT
This work was supported by the Natural Science Foundation of Hebei Province, China (No. F2011203219, No. F2013203124) and the Key Program of Research on Science and Technology of Higher Education Institutions of Hebei Province, China (No. ZH2012028).
REFERENCES
[1]. H. Li, S. Zhang and X. Wang, “A personalization recommendation algorithm for e-commerce,” Journal of Software, 2013, vol. 8, no. 1, pp. 176-183.
[2]. X. Y. Su, M. Taghi and Khoshgoftaar, “A survey of collaborative filtering techniques,” Advances in Artificial Intelligence, January 2009, vol. 2009, no. 4, pp. 1-20.
[3]. H.F. Sun, Y. Peng, J.L. Chen, C. Liu and Y.Z. Sun, “A new similarity measure based on adjusted Euclidean distance for memory-based collaborative filtering,” Journal of Software, 2011, vol. 6, no. 6, pp. 993-1000.
[4]. Y. Koren and R.Bell, “Advances in collaborative filtering,” Recommender System Handbook, Springer,
2011, pp. 145-186.
[5]. M. P. O’Mahony, N. J. Hurley and G. C. M. Silvestre, “Promoting recommendations: An attack on collaborative filtering,” Database and Expert Systems Applications Lecture Notes in Computer Science, Springer, 2002, Vol.
2453, no. 13, pp. 494-503.
[6]. R. Burke, B. Mobasher and R. Bhaumik, “Limited knowledge shilling attacks in collaborative filtering systems,” Proceedings of the 3rd IJCAI Workshop in Intelligent Techniques for Personalization, Edinburgh,
Scotland, August 2005.
[7]. B. Mobasher, R. Burke, C. Williams and R. Bhaumik, “Analysis and detection of segment-focused attacks against collaborative recommendation,” Advances in web mining and usage analysis lecture notes in Computer Science, Springer, 2006, Vol. 4189, no. 7, pp. 96-118.
[8]. B. Mehta, “Unsupervised shilling detection for collaborative filtering,” Proceedings of the Twenty-Second AAAI Conference on Artificial Intelligence, AAAI Press,
Vancouver, Canada, 2007, pp. 1402-1407.
[9]. M. O’Mahony, N. Hurley, N. Kushmerick and G. Silvestre, “Collaborative recommendation: A robustness analysis,”
ACM Transactions on Internet Technology, 2004, vol. 4,
no. 4, pp. 344-377.
[10]. Y. Koren, R. Bell and C. Volinsky, “Matrix factorization techniques for recommender systems,” IEEE Computer Society, 2009, vol. 42, no. 8, pp. 30-37.
[11]. Y. Koren, “Factorization meets the neighborhood: a multifaceted collaborative filtering model,” Proceedings of the 14th ACM SIGKDD International Conference on Knowledge Discovery and Data Mining, 2008, pp.
426-434.
[12]. Robert M. Bell and Y. Koren, “Scalable collaborative filtering with jointly derived neighborhood interpolation weights,” Seventh IEEE International Conference on Data Mining, 2007, pp. 43-52.
[14]. Y. Koren, “collaborative filtering with temporal dynamics,” Proceedings of the 14th ACM SIGKDD International Conference on Knowledge Discovery and Data Mining, 2009, pp. 447-456.
[15]. R. Salakhutdinov and A. Mnih, “Probabilistic matrix factorization,” Proceedings of Twenty-First Annual Conference on Neural Information Processing Systems,
2008, pp. 1257-1264.
[16]. L. C. Chen, “Building aterm suggestion and ranking system based on a probabilistic analysis model and a semantic analysis graph,” Decision Support Systems, 2012,
Vol. 53, no. 1, pp. 257-266.
[17]. B. Mehta and W. Nejdl, “Attack resistant collaborative filtering,” Proceedings of the 31st Annual International ACM SIGIR Conference on Research and Development in Information Retrieval, 2008, pp. 75-82.
[18]. B. Mehta, T. Hofmann, W. Nejdl. Robust collaborative filtering. Proceedings of the ACM Conference on Recommender Systems, 2007, pp. 49-56.
[19]. Z. Cheng and N. Hurley, “Robust collaborative Recommendation by Least Trimmed Squares Matrix Factorization,” Proceedings of the 22nd International Conference on Tools with Artificial Intelligence, 2010, pp.
105-112.
[20]. A. Karatzoglou and M. Weimer, “Quantile matrix factorization for collaborative filtering,” Proceeding of the 11th International Conference on Electronic Commerce
and Web Technologies, 2010, pp. 253-264.
[21]. D.Y. Jia, F. Z. Zhang and S. Liu, “A robust collaborative filtering recommendation algorithm based on multidimensional trust model,” Journal of Software, 2013,
vol. 8, no. 1, pp. 11-18.
[22]. D. L.Donoho and P.J.Huber, “The notion of breakdown point,” A Festschrift for Erich Lehmann, Wadsworth,
Belmont, CA, 1983.
Fuzhi Zhang was born in 1964. Currently, he is a professor and
PhD supervisor in school of Information Science and Engineering, Yanshan University, Qinhuangdao, China. His research interests include intelligent information processing, network and information security, and service-oriented computing.
Shuangxia Sun was born in 1987. Currently, she is a master