Speech Emotion Recognition Using Novel
HHT-TEO Based Features
Li Xiang1 Li Xin 1, 2, 3
1 .School of Mechatronical Engineering & Automation, Shanghai University, Shanghai 2. State Key Laboratory of Robotics and System, HIT
3. Shanghai Key Laboratory of Power Station Automation Technology [email protected]
Abstract—Speech emotion recognition is an important issue in the development of human-computer interactions. In this paper a series of novel robust features for speech emotion recognition is proposed. Those features, which derived from the Hilbert-Huang transform (HHT) and Teager energy operator (TEO), have the characteristics of multi-resolution, self-adaptability and high precision of distinguish ability. In the experiments, seven status of emotion were selected to be recognized and the highest 85% recognition rate was achieved within the classification accuracy of boredom reached up to 100%. The numerical results indicate that the proposed features are robust and the performance of speech emotion recognition is improved substantially.
Index Terms—HHT, Signal trend, Teager energy operator, instantaneous frequency, speech emotion recognition
I. INTRODUCTION
In the development of human-computer interactions, such a system must be able to create an affective interaction with users: it must have the ability to perceive, interpret, express and regulate emotions [1]. In this case, recognizing users’ emotional state is one of the main requirements for computers to successfully interact with humans. Most studies for the emotion recognition system were focused on facial expression and speech signal analysis. However, the human emotions can be expressed in ways of gestures and physiological signals such as electromyogram (EMG), electrooculogram (EOG) and electroencephalogram (EEG), because emotion status is inherently reflected in the activity of the nervous system [2].
In the field of signal processing, extracting and eliminating the signal trend is an important part of signal processing. The existence of signal trend would result in great error with respect to the correlation analysis in time domain or power spectral analysis in frequency domain, and even lead to the completely loss of the authenticity of the low-frequency spectrum[3]. The speech signal is more stable after the removal of signal trend, so that it is more in line with the assumption that the speech signals are stationary in a short time. The current methods of eliminating the signal trend are average slope method, finite difference method, low-pass filtering method, the least-squares fitting methods and the wavelet method, etc.
Nevertheless, these methods typically require a presumption that the signal trend is linear, or polynomial, or exponential, which is not feasible to deal with the signals possess complex and random changes.
The traditional speech signal processing are based on the two basic assumptions: the human vocal system is linear, and the speech signals are stationary in a short time. In the modern signal processing, however, the nonlinear and non-stationary signals are used as the objects of signal analysis and processing. Consequently, traditional methods of dealing with non-stationary signals such as Short-time Fourier transform (SFT), Wigner-Ville Distribution (WVD) and Wavelet Transform are not appropriate under such cases because all of the approaches aforementioned are essentially based on the Fourier transform, which cannot free themselves from the limitations of Fourier analysis. Furthermore, the operation of framing is based on the assumption of short-term stable, which resulted in the disclosure of spectrum information; even windowing cannot be a good solution to this problem.
characteristics of multi-resolution, self-adaptability and high precision to distinguish. HHT is essentially to conduct a smooth treatment to a non-smooth signal, by the result to gradually decompose the different scale of fluctuation or the tendency existing in the signals so as to produce series of data alignment that are with various characteristic scales. HHT hasn’t any fixed prior-basis and its decomposition is totally based on the data itself. This can avoid the fake components which are produced during the FFT. The IMF is educed based on the time characteristic scale of series data. Different series data can produce different IMF. Each IMF can be regarded as an inherent modal of the signal. The instantaneous frequency, thereby, obtained by the HHT has clear physical meaning and can express the local characters of the signal.
HHT method has been widely used since the inception because of its superiority in many areas such as the nonlinear systems analysis [6] [7], the marine environmental analysis [8], earthquake physics [9], bio-medical field [10], equipment fault diagnosis and vibration engineering [11] [12]. Although much research has been conducted on majority of aforementioned studies, there has been limited work implemented in the area of speech emotion recognition (SER). One recent study considered SER using the Hilbert marginal spectrum reported the best recognition rate of 90% obtained, which is 22 percentages higher than the Fourier Transform based feature MFCC [13].
In this paper, the classification effect of the MFCC extracted from the speech signal after the removal of signal trend, which is called SMFCC, is verified firstly. Secondly, we focused on the aspect of HHT based instantaneous energy. With this approach, a novel feature called ECC and its improved features named TECC and EFCC were extracted. Finally, combination of the ECC, TECC and EFCC with the SMFCC were carried out. The proposed features were evaluated for the task of SER using HMM, and it is shown that the SMFCC, ECC, TECC and EFCC outperform the traditional short-term average energy, pitch and MFCC substantially.
The paper is organized as follows. Section II describes the project outline and implementation of the intelligent emotional robot. Section III enunciates the HHT method. Next, Section IV provides the feature extraction approaches proposed in this paper. Section V presents the experimental results and analysis based on the features extracted in Section IV. Finally, Section VI gives some concluding remarks.
II. HHT METHOD
A. Empirical mode decomposition (EMD) [17]
EMD is a signal analysis method which is based on the time scale characteristics of data themselves to perform signal decomposition without any presumed basic function. EMD is established on the basis of hypothesis of the following:
(a) Time signal
x t
( )
has at least two extremum points: one is the maximum point and the other is the minimum point.(b) Time featured scale is decided by time apart of the continuous extremum points.
(c) In case the
x t
( )
is without an extremum, but inflection points, its extremum is able to be obtained by one or more orders’ differentials, and finally to get the result of integration of sub-values.This method is derived from the assumption that any signal consists of a series of simple but different intrinsic modes of oscillation. Each linear or non-linear mode will have the same number of extreme and zero crossings, and there is only one extreme between successive zero crossings. Each mode should be independent of the others. In this way, each signal can be decomposed into a number of IMFs, and each IMF must satisfy the following definitions [18]:
(a) In one column of data, the numbers pass through zero and extremum point must be equal, or with one number difference at most.
(b) At any point, the average value of envelopes that determined at local maximum point and that of the local minimum must be zero.
Among the two conditions mentioned above, the first one is similar to the narrow band requirement of the traditional stationary Gaussian Process while the second is a new limit condition raised up by Mr. Huang and et al, i.e. modified the traditional overhaul condition to local condition, so that to avoid harmful fluctuation of instantaneous parameter which is caused by asymmetric shape of signal wave. An IMF represents a simple oscillatory mode compared with a common simple harmonic function. By definition, any temporal signal
( )
x t
can be decomposed as follows:(1) Identify all of the local extrema and then connect all of the local maxima with a cubic spline line as the upper envelope.
(2) Repeat step (1) for the local minima to produce the lower envelope. The upper and lower envelopes should cover all of the data between them.
(3) The mean of the upper and lower envelope value is designated as
m
1, and the difference between the signal( )
x t
andm
1is the first component,h
1, i.e.,( )
1 1x t
−
m
=
h
(1) Ideally, ifh
1 is an IMF, thenh
1 is the first component ofx t
( )
.(4) If
h
1 is not an IMF, then it is treated as the original signal, and steps (1) to (3) are repeated; then,1 11 11
1(k 1) 1k 1k
h
−−
m
=
h
(3) It is then designated as1 1k
c
=
h
(4) which is the first IMF component of the original data;c
1should contain the finest scale or the component of the signal that has the shortest period.
(5) Separate
c
1 fromx t
( )
to obtain the residuer
1as
( )
1 1
r
=
x t
−
c
(5) wherer
1 is treated as the original data. By repeating the above steps, the second IMF component,r
2 ofx t
( )
, can be obtained. If the above procedures are repeatedn
times, thenn
types of the IMFs of signalx t
( )
can be created by1 2 2
1
n n n
r
c
r
r
−c
r
− =
⎫
⎪
⎬
⎪
−
= ⎭
#
(6)The decomposition process is stopped when
r
n becomes a monotonic function from which no more IMFs can be extracted. By summing up Eqs. (5) and (6), the general form is1
( )
( )
( )
nj n
j
x t
c t
r t
=
=
∑
+
(7)Residue
r
n is the mean trend ofx t
( )
. The IMFs1
,
2, ...,
nc
c
c
include different frequency bands that range from high to low. The frequency components contained in each frequency band are different, and they change according to the variation of signalx t
( )
, whereasn
r
represents the central tendency of signalx t
( )
.B. Intrinsic mode function (IMF) [17]
The Intrinsic Mode Function (IMF) is the signal that is satisfied with the following two conditions:
1) In one column of data, the numbers pass through zero and extremum point must be equal, or with one number difference at most.
2) At any point, the average value of envelopes that determined at local maximum point and that of the local minimum must be zero.
Among the two conditions mentioned above, the first one is similar to the narrow band requirement of the traditional stationary Gaussian Process while the second is a new limit condition raised up by Mr. Huang and et al, i.e. modified the traditional overhaul condition to local condition, so that to avoid harmful fluctuation of instantaneous parameter which is caused by asymmetric shape of signal wave. To determine if is IMF or not, is just to see whether is satisfied with the two conditions mentioned above. If not, is taken as
, calculate according to formula (8), as the following formula:
11
( )
1( )
11( )
h t
=
h t
−
m t
(8)Repeat the above process by m times, until IMF is fully satisfied with the necessary conditions, then is the first IMF, put it down as which expresses the highest frequency element among the signal data. Minus from , a new data sequence without high frequency element is thus obtained.
1
( )
1( )
1( )
r t
=
x t
−
c t
(9) Taken as the repeated step (1) of the original data sequence, then a series of and the final non-depositional order that named residual term representing mean value or tendency is achievable. Consequently, the original data sequence may represent the sum of a group of IMF values plus a residual term as shown in the following formula:1
( )
( )
( )
nn j
j
x t
c
t
r
t
=
=
∑
+
(10)C. Hilbert energy spectrum
When all of the IMF of time signals are collected, implement Hilbert transform to each IMF sub value as follow:
1
( )
( )
X t
Y t
p
dt
t
t
π
+∞
−∞
′
′
=
′
−
∫
(11) Take as the real part and as the imaginary part, thus construct the analytic signal :( )
( )
( )
( )
( )
j tZ t
=
X t
+
iY t
=
a t
e
θ (12) Where is the instant amplitude and is the instant phase as follows which perfectly reflected the instantaneity of data.2 2
( ) ( ) ( )
a t =
X
t +Y
t (13)( )
( )
arctan
( )
Y t
t
X t
θ
=
⎛
⎜
⎞
⎟
⎝
⎠
(14)Consequently, the definition of instantaneous
frequency is:
( )
( )
t
d
t
dt
θ
ω
=
(15) Upon the Hilbert transform is done to IMF values, the original data sequence can be explained as the following:( )
( )
Re
( )
j it dti
( ) 1
( , )
Re
( )
in
j t dt i
i
w
H
ω
t
a e
t
=
∫
=
∑
(17)Then the Hilbert spectrum of the original signal is obtained through the sum of the Hilbert spectrum of all the IMF components:
1
( , )
( , )
n
i i
H
ω
t
H
ω
t
=
=
∑
(18) If we only consider the energy corresponding to time while ignoring its frequency information, the expression of IMF marginal energy can be obtained. Owing to energy can be described as amplitude square, therefore, the Hilbert energy spectrum is obtained through the amplitude square in formula (19) denoted as . reflects the distribution rule of signal energy in various space (or time) scale to some extent.2
( )
( , )
E t
H
t d
ω
ω
ω
=
∫
(19)The Hilbert energy spectrum of the original signal is obtained through the sum of the Hilbert energy spectrum of all the IMF components:
1
( )
( )
n
i i
E t
E
t
=
=
∑
(20) III. FEATURE EXTRACTIONA. SMFCC: the EMD based signal reconstruction method
The convergence criteria of EMD guarantees that the residual term
r
nis monotone function, of which the cycle is greater than the signal record length. Therefore, EMD method can be applied without any priori assumption, through ther
nto easily identify and extract the signal trend. In addition, besides the long-period items which is greater than the recording time, some more complex signal trend need to be considered. Ultimately, the definition of the signal trend can be extended to the amounts of IMF of which the frequency is lower than the specified frequencyf
c. The zero-crossing rate detection method was performed in the study to identify and extract the signal trend. By setting a certain threshold, we can calculate the slowly changed signal trend. Threshold formula is as follows:If
1
0.01
i
IMF
IMF
R
R
<
(
i
=
2, 3... )
n
(21)where
R
represents the zero-crossing rate. ThenIMF
iis the signal trend, the sum of which is denoted as
( )
ri
T t
=
∑
IMF
(22)Subsequently, the
T t
r( )
was subtracted from the original speech signal, the rest of which is a relatively stable speech signal, denoted asS t
x( )
.( )
( )
( )
x r
S t
=
X t
−
T t
(23)( )
X t
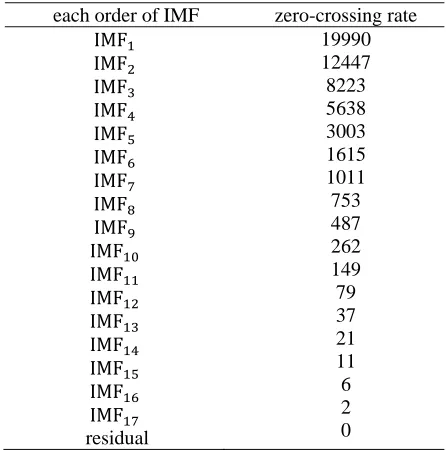
represents the original speech signal.In this paper, the simulation results inform that general speech signal can be decomposed into about 18 IMFs, in which the top 10 IMFs can be classified to the
S t
x( )
.Table 1 illustrates an example in the respect of the zero-crossing rate of each order of IMF.
Table 1. The zero-crossing rate of each order of IMF
each order of IMF zero-crossing rate IMF
IMF IMF IMF IMF IMF IMF IMF IMF IMF IMF IMF IMF IMF IMF IMF IMF residual
19990 12447 8223 5638 3003 1615 1011 753 487 262 149 79 37 21 11 6 2 0
As shown in the table 1, from the beginning of
IMF
11, the zero-crossing rate compared with that of the
IMF
1has already less than 0.01. Therefore, each order of IMF greater than the
IMF
11is the slowly changed signal trend, and can be eliminated when performing the speech signal processing.For extracting the S_MFCC feature, EMD method was conducted on the original speech signal firstly. Secondly, the zero-crossing rate of each order of IMF was calculated, and
S t
x( )
was obtained according to(8)(9)(10). Thereby, the S_MFCC was obtained by calculating the MFCC of
S t
x( )
. MFCCs with 12 orders were computed as in (11) whereM
is the number of cepstrum coefficients andX
k represents the log-energy output of thek
filter.20
1
1
[ (
)
] ,
1, 2,..,
2
s
2
o
0
c
k i
k
MFCC
X
i k
π
i
M
=
=
∑
−
=
(24)
B. ECC: Hilbert energy spectrum based features
transform (DCT), the 12-order cepstrum parameters were extracted as the compositions of ECC.
C. Improved features of ECC: TECC and EFCC
By the algorithm proposed above, two improvements were developed based on analysis of the Hilbert energy spectrum.
1) Combination with the Teager energy operator. The majority of studies in the field of SER have concentrated on the features derived from a linear speech production models which assume that airflow propagates in the vocal tract as a plane wave. This pulsatile flow is considered the source of sound production. According to studies by Teager [18], however, this assumption may not hold since the flow is actually separate and concomitant vortices are distributed throughout the vocal tract. Teager suggested that the true source of sound production is actually the vortex-flow interactions, which are nonlinear. This observation was supported by the theory in fluid mechanics [19] as well as by numerical simulation of Navier–Stokes equation [20]. It is believed that changes in vocal system physiology induced by emotional conditions such as muscle tension will affect the vortex-flow interaction patterns in the vocal tract [21]. Therefore, nonlinear speech features are necessary for classification of different emotional status.
In an effort to reflect the instantaneous energy of nonlinear vortex-flow interactions, Teager developed an energy operator, with the supporting observation that hearing is the process of detecting the energy. The simple and elegant form of the operator was introduced by Kaiser as
[ ]
( )
( )
( )
22( )
c
d
x t
x t
x t
x t
dt
t
d
d
ψ
=
⎡
⎢
⎤
⎥
−
⎡
⎢
⎤
⎥
⎣
⎦
⎢
⎣
⎥
⎦
(25)Where is Teager energy operator (TEO), and is single component of the continuous speech signal.
Since speech is represented in discrete form in most current speech processing systems, Kaiser [22] derived the operator for discrete-time signals from its continuous form as
[
]
2( )
( )
(
1) (
1)
x n
x
n
x n
x n
ψ
=
−
+
−
(26)Where is sampled speech signal.
As a powerful nonlinear operator, TEO gives a remarkable performance in the field of background noise suppression and signal feature extraction. It retained the quasi-steady-state assumptions in cepstral analysis, and thus more effective characterizations of the complexity of speech signals can be obtained. In this paper, therefore, feature extraction by combining the Hilbert energy spectrum with the TEO was carried out and the features named TECC were extracted. The purpose here is to identify whether the nonlinear instantaneous energy features are effective when performing emotion recognition.
For extracting TECC feature, the TEO was applied to the Hilbert energy spectrum firstly, and then a frame size of 25ms and a shift of 12.5 ms were employed for windowing. Consequently, the spectrum was divided into a number of sub-bands and overlaps existed between the
sub-bands. Finally, calculated the natural logarithm of sub-band energy and complement the DCT, the 12-order cepstrum parameters were extracted as the compositions of TECC.
2) Instantaneous frequency-weighted energy. Hilbert energy spectrum is the distribution of energy in the time domain. Although precise expression of the energy is obtained, the instantaneous frequency, however, is ignored. In a separate study [23], according to the results of analysis of emotional speech, distribution of spectral energy also varies on speech produced under different emotions. It is suggested that emotion may affect energy distribution of speech among different frequency bands. With compare to neutral speech, it is shown that additional energy is typically moved from low to high frequency bands with regard to angry, happy and sad emotion [24]. Energy distribution varies due to different frequencies, lead to the main energy is located in different bands under various emotions. The traditional time-domain energy analysis, thereby, was verified neglecting the breath-noise and consonants which have low amplitude but the high frequencies. Aside from this, the instantaneous energy of each IMF components is considered to be proportional with the amplitude and has nothing to do with the instantaneous frequency
in current standard approach. However, according to the physical model of instantaneous frequency, not only the instantaneous energy is included in the energy envelope of , but also in the instantaneous frequency . Since the internal energy is proportional with its circumferential velocity by physical sense. In light of the above considerations, instantaneous frequency-weighted energy was developed to improve the ECC, and thus the features called EFCC were obtained.
The instantaneous frequency-weighted energy is conducted by the weighted operation using instantaneous frequency of each IMF from formula (15):
(
2)
( )
( , )
( )
EF t
H
t
t
d
ω
ω
ω
ω
=
∫
×
(27)Then the instantaneous frequency-weighted energy of the original signal is obtained through the sum of the instantaneous frequency-weighted energy of all the IMF components:
1
( )
( )
n
i i
EF t
EF
t
=
=
∑
(28) The weighted operation using instantaneous frequency included the influence factors of amplitude as well as frequency, and reflected the density of energy distribution to some extent likewise. With this approach, the effects of breath-noise and consonants on the SER were well considered.energy and complement the DCT, the 12-order cepstrum parameters were extracted as the compositions of EFCC.
IV. EXPERIMENTAL RESULTS AND ANALYSIS
A. Speech Database
The Berlin emotional speech database [25] was applied in our studies. Five female and five male actors uttered ten sentences in German that have little emotional content textually. The speech was recorded with 16-bit precision and at a sampling rate of 22 kHz. A total of 490 utterances were divided among seven emotional classes: neutral, anger, fear, joy, sadness, disgust and boredom. The duration of the utterances varies from one to two seconds. 70% of the utterances were used for training and the rest for testing.
B. Results and Analysis
Continuous Hidden Markov Models were trained to constitute our SER system with each HMM has 5 Status and 5 Gaussian mixtures. Additionally, the confusion degree was calculated aside from the recognition accuracy for the purpose of measuring the confusion conditions between two emotions which defined as follows:
M
ij ji100%
N
N
+
N
=
×
(29)Where is the number of samples of emotion which mistakenly identified as emotion . Likewise, is the number of samples of emotion which mistakenly identified as emotion . is the total number of samples for testing.
Four groups of comparative experiments were designed in this paper. All of the features used here also included their derived parameters: the first and second-order differential.
1). MFCC and SMFCC were employed as the first group. The numerical results were elucidated from table I to table II.
TABLE I.EXPERIMENTAL RESULTS USING MFCC
Emotion Recognized emotion(%): 74.29 on average
Anger Boredom Disgust Fear Happiness Neutral Sadness Anger 70 0 0 0 30 0 0 Boredom 0 90 10 10 0 30 5 Disgust 5 0 90 0 10 5 5 Fear 5 0 0 70 10 0 5 Happiness 15 0 0 0 50 0 0 Neutral 5 0 0 15 0 65 0 Sadness 0 10 0 5 0 0 85
TABLE II.EXPERIMENTAL RESULTS USING SMFCC
Emotion Recognized emotion(%): 76.43 on average
Anger Boredom Disgust Fear Happiness Neutral Sadness Anger 70 0 0 0 25 0 0 Boredom 0 80 5 10 0 5 15 Disgust 5 5 90 0 5 15 0 Fear 10 0 5 75 10 5 0 Happiness 15 0 0 0 60 0 0 Neutral 0 0 0 20 0 75 0 Sadness 0 15 0 5 0 0 85
The results illustrate that compared with MFCC, SMFCC improved the overall classification capacity by 2.14%, which proves that the speech signal after eliminating the signal trend is more adaptable to be employed as the speech database.
2). Short-term average energy (ASE), ECC, TECC and EFCC were employed as the second group to observe their performance in the SER. The numerical results were elucidated from table III to table VI.
TABLE III.EXPERIMENTAL RESULTS USING ASE
emotion Recognized emotion(%): 48.57 on average
Anger Boredom Disgust Fear Happiness Neutral Sadness Anger 40 0 10 0 5 0 0 Boredom 0 70 15 5 5 40 15 Disgust 10 0 25 15 20 10 10 Fear 10 0 10 45 5 0 0 Happiness 15 5 10 0 60 5 0 Neutral 15 15 15 15 5 40 15 Sadness 10 10 15 20 0 5 60
TABLE IV.EXPERIMENTAL RESULTS USING ECC
emotion Recognized emotion(%):64.29 on average
Anger Boredom Disgust Fear Happiness Neutral Sadness Anger 70 0 0 5 20 0 0 Boredom 0 65 0 0 5 20 15 Disgust 5 5 75 5 10 10 5 Fear 15 10 5 75 10 10 0 Happiness 10 5 0 5 45 0 0 Neutral 0 10 20 5 10 55 15 Sadness 0 5 0 5 0 5 65
TABLE V.EXPERIMENTAL RESULTS USING TECC
emotion Recognized emotion(%):68.57 on average
Anger Boredom Disgust Fear Happiness Neutral Sadness Anger 65 0 0 0 10 0 0 Boredom 0 75 15 5 0 25 30 Disgust 0 0 60 5 0 5 5 Fear 20 0 5 75 0 5 0 Happiness 10 0 5 0 85 0 0 Neutral 5 15 15 10 5 65 10 Sadness 0 10 0 5 0 0 55
TABLE VI.EXPERIMENTAL RESULTS USING EFCC
emotion Recognized emotion(%): 67.14 on average
Anger Boredom Disgust Fear Happiness Neutral Sadness Anger 65 0 0 5 20 0 0 Boredom 0 85 25 0 0 25 25 Disgust 0 5 65 5 0 0 5 Fear 20 0 0 65 5 5 0 Happiness 10 0 5 5 75 5 0 Neutral 0 0 5 15 0 55 5 Sadness 5 10 0 5 0 10 60
more accurate description of the distribution and changes of energy in the time domain. Moreover, from the point of view of single emotion, the higher classification ratios were obtained when using ECC to recognize disgust and fear utterances, and the same when using TECC for the happiness and EFCC for the sadness.
3). Hilbert energy spectrum is the distribution of energy in the time domain. Although precise expression of the energy is obtained, the instantaneous frequency, however, is ignored. MFCC have good performance in description of the human ear's auditory characteristics, and the frequency spectrum under Mel frequency domain can be obtained, as a result, through the short-term analysis techniques of the time domain signal. Taking the considerations aforesaid into account and for the purpose of investigating whether the proposed features can have better performance, the combination of MFCC with ECC, TECC and EFCC were performed in this group of comparative experiments. The numerical results were given out from table VII to table XI.
TABLE VII.EXPERIMENTAL RESULTS USING ASE AND MFCC
Emotion Recognized emotion(%): 77.86 on average
Anger Boredom Disgust Fear Happiness Neutral Sadness Anger 80 0 0 0 30 0 0 Boredom 0 80 0 5 0 10 10 Disgust 5 0 85 10 0 5 5 Fear 5 0 0 70 5 0 0 Happiness 10 0 0 10 60 0 0 Neutral 0 15 10 5 5 85 0 Sadness 0 5 5 0 0 0 85
TABLE VIII.EXPERIMENTAL RESULTS USING F0 AND MFCC
Emotion Recognized emotion(%): 78.57 on average
Anger Boredom Disgust Fear Happiness Neutral Sadness Anger 75 0 0 0 20 0 0 Boredom 0 95 15 10 0 5 15 Disgust 5 0 70 0 0 0 10 Fear 5 0 0 70 10 0 0 Happiness 10 0 5 5 70 0 0 Neutral 5 5 10 10 0 95 0 Sadness 0 0 0 5 0 0 75
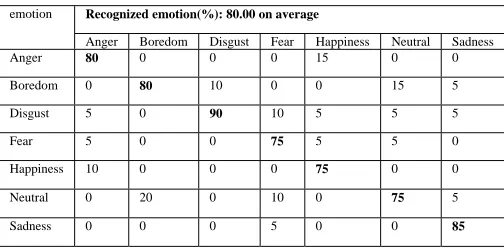
TABLE IX.EXPERIMENTAL RESULTS USING ECC AND MFCC
emotion Recognized emotion(%): 80.00 on average
Anger Boredom Disgust Fear Happiness Neutral Sadness Anger 80 0 0 0 15 0 0 Boredom 0 80 10 0 0 15 5 Disgust 5 0 90 10 5 5 5 Fear 5 0 0 75 5 5 0 Happiness 10 0 0 0 75 0 0 Neutral 0 20 0 10 0 75 5 Sadness 0 0 0 5 0 0 85
TABLE X.EXPERIMENTAL RESULTS USING TECC AND MFCC
emotion Recognized emotion(%): 81.43 on average
Ange r
Boredo m
Disgus t
Fea r
Happines s
Neutra l
Sadnes s Anger 80 0 0 0 25 0 0 Boredom 0 90 5 5 0 10 0 Disgust 0 0 80 10 0 0 10 Fear 10 0 5 80 5 10 0 Happines
s
0 0 0 0 70 0 0 Neutral 0 10 10 5 0 80 0 Sadness 0 0 0 0 0 0 90
TABLE XI.EXPERIMENTAL RESULTS USING EFCC AND MFCC
emotion Recognized emotion(%): 83.57 on average
Ange r
Boredo m
Disgus t
Fea r
Happines s
Neutra l
Sadnes s Anger 75 0 0 0 5 0 0 Boredom 0 100 15 0 0 5 5 Disgust 0 0 75 5 5 0 10 Fear 15 0 0 75 5 5 0 Happines
s
10 0 0 0 85 0 0 Neutral 0 0 10 15 0 90 0 Sadness 0 0 0 5 0 0 85
Table I indicate that the recognition rate is not satisfying when using only the MFCC features. In an exhaustive review, it is better to combine ECC, TECC and EFCC with MFCC. 5.71%, 7.14% and 9.28% relative improvements of classification capacity were obtained when compared with MFCC. The performance of emotion classification is improved with increment of 2.14%, 3.57% and 5.71% when compared with ASE+MFCC and with increment of 1.43%, 2.86% and 5.10% when compared with F0+MFCC.The classification results also demonstrate that in comparison with ECC, the improved features TECC and EFCC have better performances in terms of accuracy with increment of 1.43% and 3.57%. Furthermore, the combination of EFCC with MFCC is found to provide the best discrimination for the task of SER in this group. It is also suggested that the combination of time-domain characteristics with frequency domain characteristics can greatly improve the classification accuracy since the emotional information reflected in both the aspects of time domain and frequency domain.
TABLE XII.EXPERIMENTAL RESULTS USING ECC AND SMFCC
emotion Recognized emotion(%): 81.43 on average
Ange r
Boredo m
Disgus t
Fea r
Happines s
Neutra l
Sadnes s Anger 85 0 0 0 15 0 0 Boredom 0 80 10 0 0 15 5 Disgust 5 0 90 10 5 5 0 Fear 0 0 0 75 5 5 0 Happines
s
10 0 0 0 75 0 0 Neutral 0 20 0 10 0 75 5 Sadness 0 0 0 5 0 0 90
TABLE XIII.EXPERIMENTAL RESULTS USING TECC AND SMFCC
emotion Recognized emotion(%): 82.14 on average
Ange r
Boredo m
Disgus t
Fea r
Happines s
Neutra l
Sadnes s Anger 80 0 0 0 25 0 0 Boredom 0 90 5 5 0 5 0 Disgust 0 0 80 10 0 0 10 Fear 10 0 5 80 5 10 0 Happines
s
0 0 0 0 70 0 0 Neutral 0 10 10 5 0 85 0 Sadness 0 0 0 0 0 0 90
TABLE XIV.EXPERIMENTAL RESULTS USING EFCC AND SMFCC
emotion Recognized emotion(%): 85.00 on average
Ange r
Boredo m
Disgus t
Fea r
Happines s
Neutra l
Sadnes s Anger 80 0 0 0 5 0 0 Boredom 0 100 15 0 0 5 5 Disgust 0 0 80 5 5 0 10 Fear 10 0 0 75 5 5 0 Happines
s
10 0 0 0 85 0 0 Neutral 0 0 5 15 0 90 0 Sadness 0 0 0 5 0 0 85
In this group of experiment, the proposed features of our work: SMFCC, ECC, TECC and EFCC performed better. The recognition rate with increment of 1.43%, 0.71% and 1.43% were obtained when compared ECC+MFCC, TECC+MFCC, EFCC+MFCC with ECC+SMFCC, TECC+SMFCC, EFCC+SMFCC respectively. Moreover, it is worth noting that the recognition rate of boredom emotion reached up to 100%.
Through the above analysis it is quite evident that the proposed features SMFCC, ECC, TECC and EFCC are in fact, effective because of the superiority of HHT method and the improved approach presented in this paper.
The confusion degree of 21 groups of emotions and their mean in the third and fourth group of experiments were calculated as shown in Fig.1 to Fig.3.
TABLE XV. 21 GROUPS OF EMOTIONS
No. of emotions Emotion types
1 Anger-Boredom 2 Anger-Disgust 3 Anger-Fear 4 Anger-Happiness 5 Anger-Neutral 6 Anger-Sadness 7 Boredom-Disgust 8 Boredom-Fear 9 Boredom-Happiness 10 Boredom-Neutral 11 Boredom-Sadness 12 Disgust-Fear 13 Disgust-Happiness 14 Disgust-Neutral 15 Disgust-Sadness 16 Fear-Happiness 17 Fear-Neutral 18 Fear-Sadness 19 Happiness-Neutral 20 Happiness-Sadness 21 Neutral-Sadness
Fig.1. confusion degree of 5 experiments in the group III
As is shown in the figure above, F0+MFCC and ASE+MFCC perform comparably, while the ECC+MFCC, TECC+MFCC and EFCC+MFCC outperform them in terms of confusion degree especially in the group of Anger-Happiness.
Fig.2. Average confusion degree of 5 experiments in the group III
Fig.3. confusion degree of 3 experiments in the group IV
Fig.3 portrays that the features of EFCC+SMFCC has the lowest confusion degree in this experimental group. Thus confirms that a more precisely calculation of the signals' instantaneous energy and a more complete description of the signal oscillation modes can be obtained by EFCC compared with ECC and TECC.
From the point of view of single emotion, the feature combination which has the highest recognition rate was enumerated in table XVI.
TABLE XVI.FEATURE COMBINATION WHICH HAS THE HIGHEST RECOGNITION RATE OF SINGLE EMOTION
Anger ECC+SMFCC(85%)
Boredom EFCC+MFCC, EFCC+SMFCC(100%)
Disgust MFCC,ECC+MFCC, ECC+SMFCC(90%)
Fear TECC+MFCC, TECC+SMFCC(80%)
Happiness TECC,EFCC+MFCC, EFCC+SMFCC(85%)
Neutral F0+MFCC(95%)
Sadness TECC+MFCC, ECC+SMFCC, TECC+SMFCC
(90%)
The results, except the Neutral emotion, manifest that in the aspect of single emotion, all of the highest accuracy rates were obtained by the proposed features and their combinations with the MFCC or the SMFCC. Apart from this, the proposed features of TECC, EFCC+MFCC and EFCC+SMFCC performed better in the promotion of the classification accuracy of happiness which has the most dissatisfactory recognition effect. The validity of the features proposed in this paper, subsequently, is further confirmed.
V. CONCLUSIONS
Signal processing is one of the key points of feature extraction. EMD method can extract or remove the average of the data series effectively and adaptively. It also can get rid of the trend part of the data and decompose the complicated data into some liner and stationary mode. Furthermore, different with FFT, which is based on cosine functions, HHT is self-adaptive and can acquire better performance in some signal segments,
and these make it can be used in analyzing both stationary and non-stationary signals. To that end, Hilbert-Huang Transform method was employed in this paper which focused on the aspect of HHT based instantaneous energy. With these approaches, a improved feature of MFCC named SMFCC were developed, and another novel feature called ECC and its improved features TECC and EFCC were extracted. The proposed features are evaluated for the task of SER using HMM and it is shown that the SMFCC, ECC, TECC and EFCC features outperform traditional short-term average energy, pitch and MFCC substantially.
In the future, a speech emotion recognition system that combines with facial features and EEG involved in multimodal interactions will be investigated.
ACKNOWLEDGEMENTS
This paper is supported by the State Key Laboratory of Robotics and System (HIT): SKLS-2009-MS-10 and Shanghai University, "11th Five-Year Plan" 211 Construction Project.
REFERENCES
[1] Picard, R.: Affective computing. MIT Press, Boston
(1997)
[2] Neto, Anselmo Frizera Celeste, Wanderley Cardoso;
Martins, Vinicius Ruiz; Filho, Teodiano Freire Bastos, “Human-Machine Interface based on electro-biological signals for mobile vehicles”, IEEE International Symposium on Industrial Electronics, v 4, p 2954-2959, 2006.
[3] Rohit Moghe, Mirrasoul J. Mousavi, “Trend Analysis
Techniques for Incipient Fault Prediction,” Power & Energy Society General Meeting, 2009. pp.1-8.
[4] Norden E H, Zheng S, Steven R L, “The Empirical Mode
Decomposition and the Hilbert Spectrum for Nonlinear and Non-stationary Time Series Analysis,” Proc. R. soc. Lond. A, 1998:903-905.
[5] Manling Huang, Pingdong Wu, Ying Liu et al,
“Application and Contrast in Brain-Computer Interface between Hilbert-Huang Transform and Wavelet Transform, ”9th International Conference for Young
Computer Scientists, ICYCS 2008,18-21,Nov,2008,pp.1706-1710.
[6] Ayenu-Prah, A.Y., Attoh-Okine, N.O, “Comparative
study of hilbert-huang transform, fourier transform and wavelet transform in pavement profile analysis, ”Vehicle System Dynamics, v 47, n 4, pp. 437-456, April 2009.
[7] Yong, Huang, Yongqiang, Liu, Zhiping, Hong, “Detection
and location of power quality disturbances based on mathematical morphology and Hilbert-Huang transform, ”Proceedings of 9th International Conference on Electronic Measurement and Instruments,pp.2319-2324,2009
[8] Pan, Jiayi, Yan, Xiao-Hai, Zheng, Quanan et al,
“Interpretation of scatter meter ocean surface wind vector EOFs over the Northwestern Pacific, Remote Sensing of Environment, ”v 84, n 1, pp.53-68, January 1, 2003.
[9] Yinfeng, Dong, Yingmin, Li, Mingkui, Xiao et al,
“Analysis of earthquake ground motions using an improved Hilbert-Huang transform, ”Soil Dynamics and Earthquake Engineering, v 28, n 1, pp.7-19, January 2008.
characteristics of gastrointestinal motility based on Hilbert-Huang transform method, ”High Technology Letters, v 14, n 1, pp. 30-34, March 2008.
[11] Yang, Lu, Shen, Huai-Rong, “Research and comparison
on the application of Hilbert-Huang transform and wavelet transform to fault feature extraction, ”Binggong Xuebao/Acta Armamentarii, v 30, n 5, pp. 628-632, May 2009.
[12] Wu, T.Y., Chung, Y.L, “Misalignment diagnosis of
rotating machinery through vibration analysis via the hybrid EEMD and EMD approach, ”Smart Materials and Structures, v 18, n 9, 2009
[13] XIE Shan, ZENG Yi-cheng, JIANG Yang-bo,
“Application of Hilbert marginal spectrum in speech emotion recognition,” Technical Acoustics, Vol.28, No.2, Apr, 2009.
[14] Kim, Ji-Hwan; Oh, Yung-Hwan, “Feature vector
classification based speech emotion recognition for service robots,” IEEE Transactions on Consumer Electronics, v 55, n 3, p 1590-1596, 2009.
[15] K.Kong and D.Jeon, “Design and control of an
exoskeleton for elderly and patients,” IEEE/ASMETrans.Mechatronics, vol.11, no.4, pp. 428–432, Aug.2006.
[16] Y.Mori,J.Okada,andK.Takayama, “Development of a
standing style transfer system “ABLE” for disabled lower limbs,” IEEE/ASMETrans.Mechatronics, vol.11, no.4, pp. 372–380, Aug.2006.
[17] Ding Pei, Yu Chongchong, He Xiaoyu, “A Study and
Application of HHT in Vibration Signal Analysis of
Bridge Structural Health Monitoring System, ”CISP '09. 2nd International Congress on 17-19 Oct. 2009, pp.1-5
[18] H. M. Teager and S. M. Teager, “A phenomenological
model for vowel production in the vocal tract,” Speech Science: Recent Advances, pp.73–109, 1983.
[19] A. J. Chorin and J. E. Marsden, “A Mathematical
Introduction to Fluid Mechanics, ”2nd ed. Berlin, Germany: Springer-Verlag, 1990.
[20] T. J. Thomas, “A finite element model of fluid flow in the
vocal tract,” Comput. Speech Lang., vol. 1, pp. 131–151, 1986.
[21] Zhou, G.; Hansen, J.H.L.; Kaiser, J.F, “Nonlinear feature
based classification of speech under stress, ”IEEE Transactions on Speech and Audio Processing, v 9, n 3, pp. 201-216, March 2001
[22] Kaiser J F. On a simple algorithm to calculate the ‘energy’
of a signal. ICASSP-90, 1990,pp.381-384.
[23] GAO Hui and CHEN Shan-guang, “Emotion
classification of mandarin speech based on TEO nonlinear features, ”Software Engineering, Artificial Intelligence, Networking and Parallel/ Distributed Computing,2007,3pp.394-398
[24] Hui G.; Guangchuan S.; Shanguang C, “Feature analysis
of mandarin speech under various emotional status, ”Space Medical and Medical Engineering, Beijing,2005,Vol 18(5), pp.350-354.
[25] F. Burkhardt, A. Paeschke, M. Rolfes, and W. S. B. Weiss.