Published online September 20, 2014 (http://www.sciencepublishinggroup.com/j/ijepp) doi: 10.11648/j.ijepp.20140205.12
ISSN: 2330-7528 (Print); ISSN: 2330-7536 (Online)
Evaluation about drinking bottle’s reduce and reuse
effectiveness: Super light returnable glass bottles and life
cycle assessment
Shuichi Tamura
1, *, Robert William Marek
21Graduate School of Environment and Information Sciences, Yokohama National University, Yokohama, Japan 2Public Works Department, Sasebo, U. S. Naval Facilities Engineering Command Far East, Sasebo, Japan
Email address:
[email protected] (S. Tamura)
To cite this article:
Shuichi Tamura, Robert William Marek. Evaluation about Drinking Bottle’s Reduce and Reuse Effectiveness: Super Light Returnable Glass Bottles and Life Cycle Assessment. International Journal of Environmental Protection and Policy. Vol. 2, No. 5, 2014, pp. 153-160. doi: 10.11648/j.ijepp.20140205.12
Abstract:
"Reduce, Reuse, and Recycle are terms which are familiar to us as the "3Rs. " The 3Rs enable us to decrease pollution in the environment. The "Super Light Returnable Glass Bottle " is a light and reusable glass bottle generated by advancements in the technology of glass engineering. By manufacturing and using "Super Light Returnable Glass Bottles " as opposed to other container types, potentially we can reduce up to 80% of CO2 emissions. This article introduces what "Super Light Returnable Glass Bottles " are, shows how glass bottles are manufactured, and then proposes an approach to promote its use. We show the potential environmental benefits of Super Light Returnable Glass Bottles by conducting a Life Cycle Assessment (LCA) analysis for drinking containers. We demonstrate the effectiveness of "Reduce " and "Reuse " in the 3Rs by simulating the change in CO2 emissions resulting from glass bottle reuse and reduction in glass bottle weight.Keywords:
3R, Super Light Returnable Glass Bottle, Life Cycle Assessment1. Introduction
1.1. Introduction to Reduce and Reuse
Let us think about returnable bottles. When you return the empty bottles to the store, the store sends the empty bottles back to the manufacturers. The bottles are refilled and then shipped back to the stores to be sold again, thereby enabling us to conserve resources and reduce wastes. The use of returnable bottles also reduces CO2 emissions. This research provides an approach to improve the reduction of CO2 emissions through the use of Super Light Returnable glass bottles.
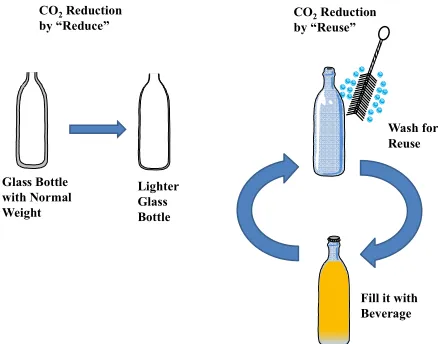
Figure 1 demonstrates the concept of this research. The CO2 reduction by the weight reduction of glass bottles are demonstrated on the left side, whereas the CO2 reduction through the reuse of glass bottles is demonstrated on the right side. Regarding the CO2 reduction by the weight reduction of glass bottles, they are created with less amount of raw materials where additional numbers of glass bottles can be created with the same amount of raw materials. Regarding glass bottle reuse, reusing the glass bottles will
saves the raw materials for glass bottle creation. Weight reduction of glass bottles and reusing glass bottles leads to the same effect: they reduce the quantity of raw materials for glass bottle creation and will concurrently reduce the amount of CO2 emission through the manufactural process.
Fill it with Beverage
Wash for Reuse
Glass Bottle with Normal Weight
Lighter Glass Bottle CO2Reduction
by “Reduce”
CO2Reduction
by “Reuse”
1.2. Glass Bottle Lightness Index Vale L
As an index which determines the lightness of glass bottles, Japan Glass Bottle Association adopted the glass bottle lightness index value L for use in the glass bottle industry[1].
Value L=0.44×Bottle Weight (g)÷Capacity When Full (ml)
0.77
(1)
We contacted the Japan Glass Bottle Association and were provided the following historical information about the Value L equation:
"Mr. Eddingston, who worked for Emhart Glass S.A., proposed it as a glass bottle lightness index in 1976. It is said that he collected the information for glass bottle products in the European market at that time and modeled the regression equation from the statistic analysis. Emhart Glass S.A. and Mr. Eddingston lost the related documents so details are not clear ".
In the glass bottle industry, glass bottle lightness index value L is now understood in the following way.
Glass bottle lightness is considered as being proportional to glass bottle thickness. If the thickness value is lower, the lightness value is lower too. Therefore the following equation holds:
Glass Bottle Thickness = Glass Volume/Glass Bottle Area (2)
Given that a bottle is spherical and taking "r " as radius, the equation to calculate "Glass Volume " is "4/3πr3 ". The equation for "Glass Bottle Area " is "4πr2 ".
As for "Glass Volume, " the following equation holds:
Glass Volume=Weight/Glass Density (3)
In the equation of "Glass Bottle Thickness " we substitute "Glass Volume " with "Weight/Glass Density. " We next cancel "r " in "4πr2 " of "Glass Bottle Area " (which is found in the "Glass Bottle Thickness " equation) by substitution. We then rearrange the "Glass Volume " equation to the "r " equation as follows:
Glass Volume= 4/3 π r3 → r = (Glass Volume×3/4/π)1/3 (4)
If we substitute this with "r " in "Glass Bottle Area =4πr2 ":
Glass Bottle Area = 4π×(Glass Volume×3/4/π)2/3 (5)
Given that 4π×(3/4/π)2/3 is K:
Glass Bottle Area=K×Glass Volume2/3 (6)
This is combined with "Glass Volume=Weight/Glass Density: "
Glass Bottle Thickness = (Weight/Glass Density)/K×Glass Volume2/3= Weight/(K×Glass Density)×Glass Volume
2/3
(7)
The equation above closely corresponds to Glass Bottle
Lightness Value L = "K×Glass Density, or 4π×(3/4/π)2/3×glass density. " 2/3 Power is represented as "0.67 ", which is close to "0.77. " The 0.77 is greater than 2/3 because bottles are not a sphere. Because a glass bottle is not a sphere and the shape of bottles vary, the results of statistical investigation show that 0.77, which is larger than 2/3 (i.e., 0.67) can be substituted in the equation.
Manufacturers say that the difficulties with manufacturing the actual glass bottle are as follows:
1. Larger bottles are easy to make light whereas smaller bottles are hard to make light.
2. Bottles with a large neck are hard to make light. The reason is that weight of a glass bottle is determined by the type of bottle neck and bottle size. Small size bottles and bottles with a large neck tend to be hard to make light because the bottle neck weight of small size bottles and bottles with a large neck need a larger proportion of material than that of normal bottles.
2. Method
We interviewed manufactures of glass bottles on the glass bottle creation process. Regarding reduction, reuse and recycling, we interviewed and collected administrative documents from public organizations such as city halls, nonprofit organizations (NPO), and others. The Life Cycle Assessment for this research is based on "Workshop for Containers’ Comparison, A Report on Comparison of Various Containers by LCA Method 2001 "
3. Results and Discussion
3.1. Lightness Value L Less than 0.5 Glass Bottle (Super Light Glass Bottles)
Bottles lighter than Value L 0.7 Glass Bottles were developed by Toyo Glass Co., ltd. and Nihon Yamamura Glass Co., ltd. Toyo Glass Co., ltd. developed glass bottles with Value L 0.5 while Nihon Yamamura Glass Co., ltd developed glass bottles with Value L 0.6.
Glass bottles with value L less than 0.5 are not available on the market, but they are considered as the lightest bottles in the world.
As for the name of the light bottles, Toyo Glass Co., ltd. calls glass bottles of Value L less than 0.6 as "Extremely Super Light Bottles " and glass bottles of Value L less than 0.5 as "Extremely Extremely Super Light Bottles ". Nihon Yamamura Glass Co., ltd. calls glass bottles of Value L below 0.6 as "Super Super Light Bottles ". Glass bottles of Lightness Index Value L 0.5 are not on the market, so Japan Glass Bottle Association does not give a name to these bottles.
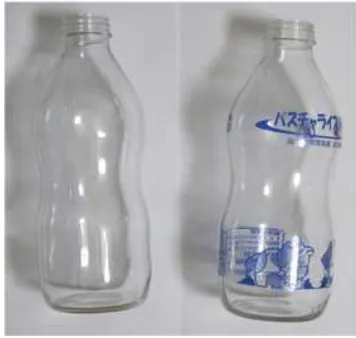
Figure 2. Glass Bottle less than Value less than 0.5
For the bottle samples shown in the above photograph, volume when full is 624ml, weight is 160g, and the Glass Bottle Lightness Index Value L is 0.496.
As for glass bottles with Glass Bottle Lightness Index Value L less than 0.5, the information in the following table is provided:
Table 1. Glass Bottle Lightness Index Value L
Displayed Volume Volume When Full Value L Less Than 0.5
100ml (110ml) Less Than 42g
500ml (525ml) Less Than 140g
1000ml (1050ml) Less Than 240g
For glass bottles with a volume 500ml、when we compare bottles of Value L less than 0.7 with ones of Value L Less than 0.5, we get a 27% weight reduction.
Hereafter this research refers to Value L less than 0.5 as "Super Light Bottles. "
3.2. Glass Bottle Manufacture Processes: Blow and Blow Process; Press and Blow Process; Narrow Neck Press and Blow Process
Investigations into manufacturing processes of light glass bottles were made. Roughly speaking, glass bottle manufacture processes are divided into two types. They are (1) Blow and Blow Process, and (2) Press and Blow Process. First we discuss the Blow and Blow Process. A "Gob, " which is a block of glass goes into the mold and air is sent in from below. The mold then is turned upside down and air is forcefully blown to form the bottle.
Bottles created with this process are used as normal lightness bottles.
The Press and Blow Process goes through the same manufacture process but with one difference being that the air is blown only one time. Instead of the process which sends the air to the gob, the plunger ( or mold) creates the shape of the glass bottles.
Super Light Glass Bottles are created by the Narrow Neck Press and Blow Process which is the applied Press and Blow Process.
The Narrow Neck Press and Blow Process is almost the same process as Press and Blow, the difference being the long and thin plunger.
With this manufacturing process, we can create Super Light Glass Bottles.
3.3. Returnable Coating: Plastic Coating
We next turn to the returnable coating sprayed on returnable bottles, which is a plastic coating used only for returnable bottles.
The coating consists of a base layer which is formed of styrene butadiene rubber and a top layer which is formed of urethane resin[2].
It has a buffer effect and anti-shattering effect. According to Toyo Glass Co., ltd., originally the coating was invented for bottles used in vending machines, and then it was applied as a coating for returnable bottles.
In Figure3 (the bottle on the left), we show a bottle before the plastic coating is sprayed onto it, and on the right we show a bottle after the plastic coating is applied.
Figure 3. Glass Bottles without/with Plastic Coating
The plastic coating is sprayed on the bottle from below the bottle neck to above the grounding block. The Plastic Coating is sprayed only on the outside of the glass bottles. Returnable bottles that are sprayed by Plastic Coating have lower loss percentages from breakage during the bottle washing process.
Plastic Coating does not affect the recycling properties of the bottle except for giving it an amber color in appearance because of the carbon contained in the Plastic Coating. Plastic Coating does not affect glass bottle strength.
The present research selects Super Light Glass Bottles sprayed by Plastic Coating as the most environmentally friendly glass bottles.
3.4. Reflections on the Relationship between Safety and Environment with Super Light Returnable Glass Bottle Use
(1) The glass bottles can break an impact inside vending machines, and
(2) The glass bottles might break when they contain soda.
Because Super Light Glass Bottles are created very thin, their strength is easily assumed to be lower than normal glass bottles.
Because Super Light Glass Bottles are created very thin, their strength is easily assumed to be lower than normal glass bottles.
Glass bottles receive impacts when they are dropped, including Water Hammer. Water Hammer Phenomenon and damages from dropped impacts can destroy glass bottles.
The following paragraph explains Water Hammer Phenomenon when a glass bottles is dropped inside a vending machine[3].
A glass bottle with liquid is dropped to the board inside the vending machine. At this time the glass bottles accelerates whereas the liquid inside does not. This causes a cavity to form at the bottom of the glass bottle, and the glass bottle head space is pressurized. When the cavity is destroyed, a liquid micro jet is generated that causes erosive forces (i.e. damages). A pressure from 350-3500MPa is generated but the duration time is very short and local. Therefore damages created by the Water Hammer Phenomenon are very small. After that, the pressurized glass bottle head space moves the liquid and it gives the dynamic pressure to the bottom of the glass bottle. The glass bottle is destroyed from the inside.
Next we turn to the issue that "glass bottles might break when they have soda inside them. "
The typical inner pressure of a glass bottle filled with soda is 0.2-0.4MPa under normal temperatures. When the temperature is 40℃, the inner pressure is going to be 0.35-0.6MPa. For soda glass bottles there is a test method and standard for resistance of inner pressure, which is JIS S 2303 and JIS S 2351[4].
The virgin strength of materials for glass bottles is approximately 70MPa[5]. Therefore, Super Light Returnable Glass Bottles should be able to contain soda without any problems; however, some damages will occur when glass bottles are used repeatedly as returnable glass bottles are.
Glass bottles are breakable products and at the same time they are environmentally friendly. The issue at stake is how society will balance the environmental benefits of glass bottle use against safety concerns, which ultimately will be a trade-off relationship.
Safety is being improved because of technological advancements. In particular, the plastic coating (a kind of returnable coating) used for Super Light Returnable Glass Bottles has anti-shattering properties; however, note that this coating does not entirely sweep away all safety concerns.
3.5. A Proposal for Promotion of Super Light Returnable Glass Bottle Use
We propose to introduce an environmental tax on
containers, which increases the product cost in proportion to the amount of environmental pollution such as carbon dioxide emissions associated with the type of container. The introduction of an environmental tax has been widely discussed. The expected effects are to promote bottle lightness as well as their reuse regarding containers. Returnable containers will tend to be cheaper than single use containers because they will have less CO2 emissions, and therefore a lower tax. In the same manner, light weight containers will tend to be relatively cheaper because they have less CO2 emissions. The environmental tax will create competition, which will favor light weight returnable glass bottles over other containers.
As a result, containers with greater CO2 emissions will be difficult to sell and containers which have less CO2 will be easier to sell because of the environmental tax.
Not only containers, but also other products which have less CO2 emissions should get a larger share of the market because of the introduction of the environmental tax.
The environmental tax will be most effective if it is implemented at the Federal or national level of government. A Federal tax at the national level will avoid inequalities in the tax system at the local levels of government and will ensure that the tax is applied fairly and universally.
The present research does not promote the adoption of deposit systems because Japan has many small retail stores such as convenience stores, for which deposit systems are not considered suitable.
Deposit systems may be supported by people who want smaller government involvement and responsibility because it is based on the Extended Producer Responsibility. We first need to prioritize the establishment of a system in Japan, considering the fact that Japan does not have a system similar to a country like Germany.
We need to realize that deposit systems must promote "Reuse " not "Reduce. "
3.6. Comparison of Containers by LCA Analysis
We propose to introduce an environmental tax on containers, which increases the product cost in proportion to the amount of environmental pollution such as carbon dioxide emissions associated with the type of container. The introduction of an environmental tax has been widely discussed. The expected effects are to promote bottle lightness as well as their reuse regarding containers. Returnable containers will tend to be cheaper than single use containers because they will have less CO2 emissions, and therefore a lower tax. In the same manner, light weight containers will tend to be relatively cheaper because they have less CO2 emissions. The environmental tax will create competition, which will favor light weight returnable glass bottles over other containers.
The LCA analysis in the present research is made based on the framework of "A Report on Comparison of Various Containers by LCA Method "[6]. Assumed basic values for Life Cycle Assessment are gained from:
Bottle Recycling
The basic data for LCA of plastic bottles is: 500ml, plastic bottle weight 31.87g, PP cap 2.87g, LDPE packing 0.29g, PS1.29g, coating material 1.00g, yield rate 97% and recycling rate 41%[7].
2. Aluminum Can:The website of Japan Aluminum Can Recycling Association[8].
The basic data for LCA of aluminum cans is: 500ml, aluminum weight 15.2g, aluminum top 3.2g, aluminum tab 0.4g, coating material 0.57g, yield rate 80.34% and
recycling rate 87.3%.
3. Steel Can:The website of Japan Steel Can Recycling Association[9].
The basic data for LCA of steel cans is: 500ml, steel can weight 77.87g, aluminum top 3.5g, aluminum tab 0.4g, coating material 0.57g, yield rate 98.7% and recycling rate 88.5%.
The present LCA analysis gives the values in the table in Figure 4.
Figure 4. Comparison of Containers by LCA Analysis
Containers which emit the greatest amount of CO2 are steel cans (3 pieces). Aluminum cans, normal single use glass bottles, plastic bottles, Super Light Single Use Glass Bottles, and Super Light Returnable Glass Bottles follow them in this order, respectively. When we compare "Super Light Returnable Glass Bottles (5 cycles), " with "Super Light Returnable Glass Bottles (20 cycles) " and "Super Light Returnable Glass Bottles (60 cycles), " "Super Light Returnable Glass Bottles (60 cycles) " emit the smallest amount of CO2.
The amount of a steel can (3 pieces) CO2 emission is 10.6 times as much as the Super Light Returnable Glass Bottles (60 cycles). (the amount of Super Light Returnable Glass Bottles CO2 emission is 9.4% of the steel can (3 pieces) CO2 emission.)
The amount of the aluminum can CO2 emission is 4.18 times as much as the Super Light Returnable Glass Bottles (60 cycles). (the amount of Super Light Returnable Glass Bottles CO2 emission is 23.9% of the aluminum can CO2 emission).
The amount of normal single use glass bottle CO2 emission is 3.48 times as much as the Super Light Returnable Glass Bottles (60 cycles). (the amount of Super
Light Returnable Glass Bottles CO2 emission is 28.8% of the normal single use glass bottle CO2 emission).
The amount of plastic bottle CO2 emission is 3.23 times as much as the Super Light Returnable Glass Bottles (60 cycles)(the amount of Super Light Returnable Glass Bottles CO2 emission is 31% of the plastic bottle CO2 emission).
The amount of Super Light Single Use Glass Bottle CO2 emission is 1.84 times as much as the Super Light Returnable Glass Bottles(60 cycles). (the amount of Super Light Returnable Glass Bottles CO2 emission is 54.3% of the Super Light Single Use Glass Bottle CO2 emission). This result is useful in considering the effect of cycles (trips). In the next chapter, we further examine cycle (trip) variations. If the containers have more weight, we find the effect more easily. So we use normal returnable glass bottles for the simulation.
Normal single use glass bottles are compared with Super Light Single Use Glass Bottles. The amount of a normal single use glass bottle CO2 emission is 1.89 times as much as the Super Light Single Use Glass Bottles (the amount of normal single use glass bottle CO2 emission is 52.8% of the Super Light Single Use Glass Bottle CO2 emission).
Glass Bottles is 58.3% as much as the normal single use glass bottles. By reduction of glass bottle weight, we recognize the reduction of CO2 emission. The next chapter further examines glass bottle weight reduction.
Normal single use glass bottles are compared with Super Light Single Use Glass Bottles in the next section.
3.7. Environmental Pollution Reduction by Super Light Returnable Glass Bottle
We simulate the Super Light Glass Bottles reduction in environmental pollution from CO2 emissions. We replace all drinking containers with Super Light Returnable Glass Bottles (60 cycles). It is assumed that all containers are 500ml and that all glass bottles are single use glass bottles.
The weight of each container is as follows: 1. weight of an Super Light Returnable
Glass Bottle
0.146kg
2. weight of a normal single use glass bottle 0.348kg
3. weight of a steel can (3 pieces) 0.082kg
4. weight of an aluminum can 0.019kg
5. weight of a plastic bottle 0.037kg
In Japan, the total amount of drinking container weight is as follows:
1. total weight of normal single use glass bottle
1,010,000,000kg [10]
2. total weight of steel can (3 pieces)
710,000,000kg [11]
3. total weight of aluminum can 299,000,000kg [12] 4. total weight of plastic bottle 535,000,000kg[13]
Total weight of containers is divided by weight of each container. We are able to calculate the number of all containers used in Japan.
1. Numbers of normal single use
glass bottles 2,910,000,000
2. Numbers of steel cans (3 pieces) 8,660,000,000
3. Numbers of aluminum cans 15,800,000,000
4. Numbers of plastic bottles 14,400,000,000 We calculate the CO2 emission difference between each container and the Super Light Returnable Glass Bottle, as follows:
1. CO2 difference of a normal single use
glass bottle 0.0807kg
2. CO2 difference of an steel can (3 pieces) 0.318kg 3. CO2 difference of an aluminum can 0.135kg 4. CO2 difference of a plastic bottle 0.0737kg
By multiplying this CO2 emission difference with the number of all containers in Japan, we calculate the total CO2 emission difference of each container, as follows:
1. Total CO2 emission difference of
normal single use glass bottles 235,000,000kg
2. Total CO2 emission difference of
a steel cans (3 pieces) 2,750,000,000kg
3. Total CO2 emission difference of
an aluminum cans 2,130,000,000kg
4. Total CO2 emission difference of
plastic bottles 1,060,000,000kg
The sum of them is 5,620,000,000kg (5,620,000 tons).
This number represents CO2 emission reduction that would be achieved by replacing all containers with Super Light Returnable Glass Bottles. Separately we are able to calculate 6,990,000,000 kg(6,990,000 tons)as CO2 emission of all drinking containers. As a result, in total we would be able to achieve an 80.4% CO2 emission reduction.
3.8. Simulation of Environmental Pollution Variation with the Number of Cycles
We next simulate reduction of CO2 emissions based on the number of cycles (trips). When we simulate Super Light Returnable Glass Bottle CO2 emissions, Super Light Returnable Glass Bottles is very small.
However we see significant improvement using normal returnable glass bottles because CO2 emission with normal glass bottles is large.
The value changes are demonstrated in Figure 5:
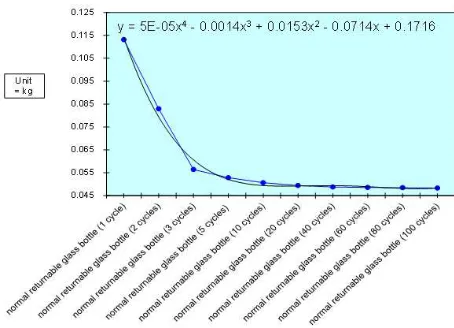
Figure 5. Cycle Number and CO2 Emission Amount
1. normal returnable glass bottle (1 cycle) 0.113 kg 2. normal returnable glass bottle (2 cycles) 0.0617kg 3. normal returnable glass bottle (3 cycles) 0.0564kg 4. normal returnable glass bottle (5 cycles) 0.0531kg 5. normal returnable glass bottle (10 cycles) 0.0508kg 6. normal returnable glass bottle (20 cycles) 0.0496kg 7. normal returnable glass bottle (40 cycles) 0.049kg 8. normal returnable glass bottle (60 cycles) 0.0488kg 9. normal returnable glass bottle (80 cycles) 0.0487kg
10. normal returnable glass bottle (100
cycles) 0.0485kg
Collection rates get up to 99% when cycles reach 100 times. The number seems impossible. Remember that survival rates in washing processes are 99.75% (400 cycles). Theoretically, it is possible. There is a steep drop in CO2 emissions for use cycles between 1 and 3. The Value flattens out when 3 use cycles are exceeded.
Figure 5 demonstrates the relationship between cycle number and the amount of CO2 emission. We also added the trendline. This 4th order polynomial trendline could be considered as an approximation which we are looking for.
The equation for the trendline would be:
Where:
Y = CO2 Emission Amount for Glass Bottles,
X = Cycle Number
a, b, c, d = Coefficient and Residue for Glass Bottle’s CO2 Emission Amount (9)
"Coefficient and Residue for Glass Bottle’s CO2 Emission Amount " are 5E-5(i.e. 0.000005), 0.0014, 0.0153, 0.0714 and 0.1716 respectively.
3.9. Simulation of Glass Bottle Lightness Variation
We next simulate CO2 emission changes verses changes in glass bottle lightness.
We calculate the CO2 emission of 500ml glass bottles demonstrated in Figure 6:
1. value L 1.22 weight 343.3 g
2. value L 1.1 weight 310.7 g
3. value L 1.0 weight 282.5 g
4. value L 0.9 weight 254.2 g
5. value L 0.8 weight 226 g
6. value L 0.7 weight 197.7 g
7. value L 0.6 weight 169.5 g
8. value L 0.5 weight 141.2 g
9. value L 0.4 weight 113 g
10. value L 0.3 weight 84.7 g
11. value L 0.2 weight 56.5 g
12. value L 0.1 weight 28.2 g
The graph given above has the following amounts of CO2 emission:
Figure 6. Relationship between CO2 Emission and Value L
The graph given in Figure 6 has the following amounts0.0449 of CO2 emission:
1. value L 1.22 0.113 kg
2. value L 1.1 0.105 kg
3. value L 1.0 0.0975 kg
4. value L 0.9 0.0900 kg
5. value L 0.8 0.0825 kg
6. value L 0.7 0.0750 kg
7. value L 0.6 0.0674 kg
8. value L 0.5 0.0599 kg
9. value L 0.4 0.0524 kg
10. value L 0.3 0.0449 kg
11. value L 0.2 0.0374 kg
12. value L 0.1 0.0299 kg
Although value L of the lightest glass bottle is 0.5, we make the simulation even for glass bottles lighter than value L 0.5 in order to understand the effect of the weight reduction. From the graph above, lightness index value L is changed in proportion to glass bottle weight. When we compare this with the simulation of cycle changes, the simulation of cycle changes shows a rapid change up to 5 cycles. This simulation is different from it.
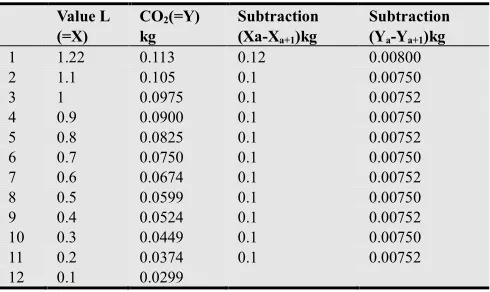
To obtain the formula for generalization, we created Table 2.
Table 2. Glass Bottle and Lightness Index Value L
Value L (=X)
CO2(=Y) kg
Subtraction (Xa-Xa+1)kg
Subtraction (Ya-Ya+1)kg
1 1.22 0.113 0.12 0.00800
2 1.1 0.105 0.1 0.00750
3 1 0.0975 0.1 0.00752
4 0.9 0.0900 0.1 0.00750
5 0.8 0.0825 0.1 0.00752
6 0.7 0.0750 0.1 0.00750
7 0.6 0.0674 0.1 0.00752
8 0.5 0.0599 0.1 0.00750
9 0.4 0.0524 0.1 0.00752
10 0.3 0.0449 0.1 0.00750
11 0.2 0.0374 0.1 0.00752
12 0.1 0.0299
We find that CO2 emission weight and Value L are in direct proportion to each other. In this connection, we would like to refer the following equation addressed in Section 1.2.
Value L=0.44×Bottle Weight (g)÷Capacity When Full (ml)
0.77
(1)
This equation cannot be applicable to the relationship between CO2 Emission Value L because the capacity of all glass bottles is 525ml.
Now we have acquired the following equation:
Y = a X + b
Where:
Y = CO2 Emission Amount for Glass Bottles,
X = Value L
a = Coefficient for Glass Bottle’s CO2 Emission Amount
b = CO2 Emission Amount for Non-Glass Bottle Portion (such as a Cap and a Label) (9)
4. Conclusion
When we consider simulation of cycle (trip) changes in the section 3.8 ( "Reuse " in the 3Rs) and simulation of lightness index value L changes in this section ( "Reduce " in the 3Rs), we find that both are effective. The point is that both of two environmental pollution reduction approaches can be made at the same time. Super Light Returnable Glass Bottles, which have the effects of both (Reduce and Reuse) inherent in them have a potential for 80.4% reduction of CO2 emissions compared to the present.
"Reduce " and "Reuse " from the 3Rs are well- known as effective ways to reduce environmental impacts. When they meet advanced technology which creates Super Light Returnable Glass Bottles, they might realize a quite amount of reduction of CO2 emissions.
Acknowledgements
The authors would like to thank Yokohama City Hall, the Toyo Glass Co. Ltd., Japan Glass Bottle Association and for their assistance with data collection and useful suggestions. Our appreciation also goes to Mr. Joseph Voellinger for useful suggestions.
References
[1] Japan Glass Bottle Association Website:
http://www.glassbottle.org/archives/arch01/torikumi/keiryo/ shisu.html
[2] Y. Yamato, Science of Glass Bottle, The Society of Packaging Science & Technology, Japan, 2003, pp62
[3] Y. Yamato, Science of Glass Bottle, The Society of Packaging Science & Technology, Japan 2003, pp86-87.
[4] Y. Yamato, Science of Glass Bottle, The Society of Packaging Science & Technology, Japan, 2003, p77.
[5] Y. Yamato, Science of Glass Bottle, The Society of Packaging Science & Technology, Japan, 2003, pp50.
[6] Workshop for Containers’ Comparison, A Report on Comparison of Various Containers by LCA Method, 2001.
[7] The Council for PET Bottle Recycling Website, http://www.petbottle-rec.gr.jp/nenji/2006/index.html
[8] Japan Aluminum Can Recycling Association Websites http://www.alumi-can.or.jp/.
[9] Japan Steel Can Recycling Association website http://www.steelcan.jp/recycle/index.html.
[10] Japan Glass Bottle Association Website http://www.glassbottle.org/marketing.
[11] Japan Steel Can Recycling Association Website: http://www.steelcan.jp/recycle/calculation.html and http://www.steelcan.jp/knowledge/drink.html
[12] Japan Aluminum Can Recycling Association Website : http://www.alumi-can.or.jp/