Published online May 20, 2014 (http://www.sciencepublishinggroup.com/j/ijepe) doi: 10.11648/j.ijepe.20140302.17
Automatic power factor correction based on alienation
technique
R. Abd Allah
Buraydah Colleges, Faculty of Engineering, Electrical Power Department, Qassim Region, Kingdom of Saudi Arabia
Email address:
To cite this article:
R. Abd Allah. Automatic Power Factor Correction Based on Alienation Technique. International Journal of Energy and Power Engineering. Vol. 3, No. 2, 2014, pp. 83-92. doi: 10.11648/j.ijepe.20140302.17
Abstract:
In modern digital protection and control systems, an alienation technique has recently become the workhorse of quantitative research and analysis. In this paper, an alienation technique is developed for calculations of original power factor on-line, active and compensation reactive powers and determination of the required number of capacitor banks to get the desired power factor. Alienation coefficients are calculated between phase voltage and current signals of power supply. These calculations are performed within one-cycle. Thus, the algorithm is well suited for implementation in a digital reactive power control scheme. This scheme is able accurately to identify the required capacitor rating to get the desired power factor under different loading levels. It does not need any extra equipment as it depends only on the voltage and line-current measurements which are mostly available at the relay location. Alternative transient program (ATP) and MATLAB programs are used to implement the proposed technique.Keywords:
Power System, Power Factor Correction, Correlation Coefficient, Alienation Coefficient, Reactive Power Control Relays, ATP Software, MATLAB1. Introduction
Power Factor (PF) is a measure of electrical efficiency
and is given by the ratio of active power consumed by the
load to apparent power delivered to the load. The power factor is also calculated as the cosine of the angle between the active power and apparent power. The AC waveforms of voltage and current also calculates the power factor as the cosine of the angle, however this time the angle is the difference between zero-crossing positions of each waveform on the x-axis. It varies with load and it has a value from 0 to 1.
It is important to know that in power factor improvement, the reactive power required by the load does not change. It is supplied by some device in local. For the dimensioning of the capacitor bank to be installed in order to improve the power factor of a plant, it is necessary to calculate correctly power factor according to the consumption or to the load cycle of the plant. To carry out distributed or group power
factor correction, it is necessary to calculate the Cos(ϕ) of
the single load or of the group of loads; this can be carried directly, through direct measuring by means of a power factor meter or indirectly, through the reading of the active and reactive energy meters or through the reading of the
voltmeter, ammeter and wattmeter.
Improving energy efficiency is one of the key goals of smart grid initiatives across the globe. In practice, a significant portion (5-10%) of generated energy is lost in transmission and distribution (T&D) system. In some countries like India T&D loss is as high as 26% [1]. Hence,
there is immensepotential to improve the energy efficiency
by minimizing the transmission and distribution loss in the
grid.Power factor correction not only reduces system loses
but also releases system capacity and improves voltage regulation which enables the utility to provide cheaper and easier services of the quality desired in modern industry
[2-3].Power Factor Correction (PFC) schemes [4] have been
proposed for quite some time in the field of power electronics. The main aim of this PFC has been to reduce Total Harmonic Distortion (THD) and thereby improving the power factor. Recently, there is a growing trend for providing incentive for good power factor and/or penalty for poor power factor. Similarly power factor correction can also be achieved using other equipment like Battery
Energy Storage System (BESS) [5]. The paper in [6]
correction AC/AC converters effectively improved the power factor up to PF = 0.999 and the power transfer efficiency up to 97.8 %. A new digital control strategy of Parallel Duty Cycle Control (PDC) for power factor correction (PFC) is presented and analyzed in paper [7]. Based on this control strategy, the duty cycle determination algorithm includes the current term and the voltage term, which can be calculated in parallel. So, as compared conventional digital PFC control methods, the PDC control can achieve higher switching frequency, lower cost, lower calculation requirement and better performance. Paper [8]
introduces a single-phase digital power-factor correction
(PFC) control approach that requires no input voltage sensing or explicit current-loop compensation, yet results in low-harmonic operation over a universal input voltage range and loads ranging from high-power operation in continuous conduction mode down to the near-zero load. The controller is based on low-resolution A/D converters
and digital pulse width modulator, requires no
microcontroller or DSP programming, and is well suited for a simple, low-cost integrated-circuit realization, or as a hardware description language core suitable for integration with other power control and power management functions. The method introduced in paper [9] analyzes and studies the Active Power Factor Correction (APFC) based on the three-phase rectifier. The results of APFC showed that the grids-side input current wave is changed with a sine wave, has the same phase with the grid-side input voltage wave. Another proposed scheme avoids use of additional costly
hardware like capacitor/inductor bank. This scheme
achieves power factor correction with minimal extra hardware through intelligent scheduling of electrical loads [10]; this is processed by using capacitive loads located in power system. A conceptual design of microcontroller based Automatic Power Factor Correction (APFC Relay) is proposed in [11]. The design of this auto adjustable power factor correction is to ensure the entire power system always preserving almost unity power factor and thus optimizing the current consumption and compared with predetermines reference value. The method in [12] presents the design, development and implementation of active power factor corrector comprising microcontroller based hardware and compatible software which will be able to
control the power factorof both linear and non-linear loads.
This paper proposes a reactive power control scheme based on alienation technique. The technique measures the phase voltage and line current drawn from power supply. It calculates alienation coefficients between the phase voltage and line current for power factor correction. The control scheme inserts the required number of capacitor banks to get the desired power factor. The suggested technique can operate accurately during one-cycle period of the fundamental frequency.
2. Proposed Technique
In this paper, ATP software [13] is used to get reliable simulation results before, during and after capacitor bank insertion for power factor correction. The suggested reactive power control scheme is based on alienation concept [14-15] in order to determine the current power factor of power system and improve poor power factor. Phase voltage and current signals of power supply are obtained and stored in a file; this data is in the discrete sampled form. These voltage and current samples are processed in MATLAB to estimate alienation coefficients between them.
2.1. Basic Principles
The suggested reactive power control scheme is based on alienation concept in order to determine the original power factor and improve poor power factor of power system. Phase voltage and line-current measurements at power supply side are sufficient to implement this technique. Two corresponding windows for the voltage and current signals measured at power supply side for alienation coefficients calculations.
2.2. Alienation Coefficients Calculation
The variance between any two signals is defined as the alienation coefficient [16-19]; it is derived from correlation coefficient. Alienation coefficient can detect any phase difference between any two electrical signals in power system; thus it is a good tool to propose an algorithm for making reactive power control relay against poor power factor, where the alienation calculated between voltage and current signals can recognize a phase shift between them and to operate in response to it.
The cross-correlation coefficient (rs) is calculated
between two windows in the two sampled signals obtained from two different transducers or directly from electric circuit, where the two windows are shifted from each other with a time interval h∆t. The cross-correlation function of two signals (vs and is) is given by Equation 1. Our proposed technique uses the two signals shifted from each other when the time interval h∆t = 0, where h = 0 (h is the number of samples between the two windows which are shifted from each other and ∆t is the time interval of one sample). ) )) ( ( 1 )) ( ( ( ) )) ( ( 1 )) ( ( ( ) ( ) ( 1 ) ( ) ( 1 2 1 2 2 1 2 1 1 1 1
∑
∑
∑
∑
∑
∑
∑
= = = = = = = ∆ + − ∆ + × − ∆ + − ∆ + = m k s m k s m k s m k s m k s m k s m k s s s t h k i m t h k i k v m k v t h k i k v m t h k i k vr (1)
This technique is based on alienation coefficient (As) which is obtained from cross-correlation coefficient (rs).
between 0 and 1. The alienation coefficient (As) between the two signals (vs and is) is estimated as follows:
2 ) (
1 s
s r
A = − (2)
Where, rs = the cross-correlation coefficient which is
calculated from Equation 1.
2.3. Power Factor Correction Procedures
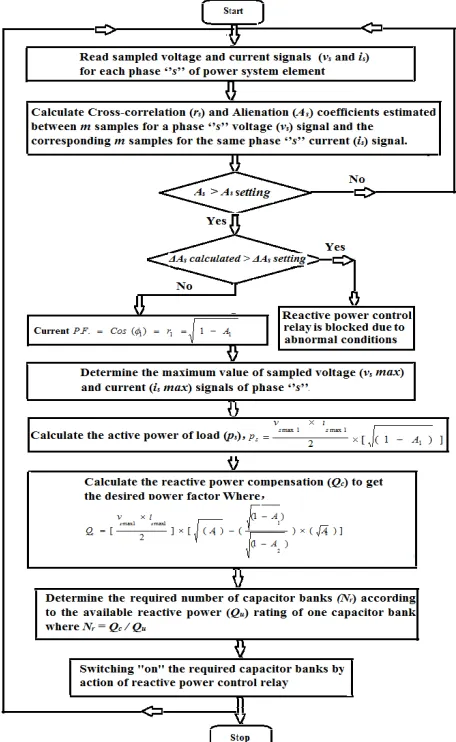
Flow chart for reactive power control scheme algorithm based on alienation technique is shown in Fig. 1. The algorithm has the following procedures:
1- Read discrete sampled voltage and current signals (vs
and is) for phase ‘’s’’ at power supply side (obtained from
ATP tool).
2- Calculate cross-correlation coefficient (rs) by using MATLAB tool,
Cross-correlation coefficient (rs) is estimated between m
samples for a phase ‘’s’’ voltage (vs) signal and the corresponding m samples for the same phase ‘’s’’ current (is) signal at power supply side. The selected m samples are the number of samples per cycle which are used as a correlated window in our algorithm to obtain and correct the original power factor. The cross-correlation coefficient (rs) is calculated as shown in Equation 3.
k i m k i k v m k v k i k v m k i k v r m k s m k s m k s m k s m k s m k s m k s s s ) )) ( ( 1 )) ( ( ( ) )) ( ( 1 )) ( ( ( ) ( ) ( 1 ) ( ) ( 1 2 1 2 2 1 2 1 1 1 1
∑
∑
∑
∑
∑
∑
∑
= = = = = = = − × − −= (3)
Where,
rs: Cross-correlation coefficient is estimated between m samples for a phase ‘’s’’ voltage (vs) signal and the corresponding m samples for the same phase ‘’s’’ current (is) signal at power supply terminals.
s: the phase designation A, B or C.
m: the number of samples per window to be correlated
used in the algorithm (N = the number of samples per cycle,
N = m selected in our algorithm).
vs (k): the sampled voltage values at instant k at power supply terminals of phase ‘’s’’.
is(k): the sampled current values at instant k drawn from
power supply of phase ‘’s’’.
3- Calculate the current power factor (P.F.), by using the
alienation (A1) before PFC as follows:
A r Cos F
P. .= (φ1)= 1= 1− 1 (4)
4- Determine the original maximum value of sampled voltage (vs) and current (is) signals (per each cycle) for phase ‘’s’’, vsmax1 and ismax1, respectively.
5- Calculate the active power of load (ps), out from power supply, for phase ‘’s’’ by using the alienation (A1)
estimated before PFC and the maximum values (vsmax1 and
ismax1) of voltage and current signals (per each cycle).
r i v p p
p s s s 1
1 max 1 max 2 1 2 × × = = = ] ) 1 ( [ 2 1 1 max 1 max 2
1 A
i v p p
p = = s = s × s × − (5)
6- Calculate the reactive power compensation (Qc) to get
the desired power factor by using Equation 6 which is derived as follows:
) sin( 2 1 1 max 1 max
1 × Φ
× = vs is
Q i v
Q s s sin( )
2 2
2 max 2
max
2 × Φ
× =
2
1 Q
Q Qc= −
)] sin( 2 ) sin( 2
[ max1× max1× Φ1 − max2× max2× Φ2
= s s s s
c i v i v Q cos ( ) 1 )
(
sin 1
2 1
2 Φ + Φ =
] ) ( cos 1 [ ) sin( 1 2
1 = − Φ
Φ 1 ) ( cos ) (
sin2 2 2 2
Φ + Φ = ] ) ( cos 1 [ )
sin(Φ2 = − 2Φ2
] ) ( cos 1 ( 2 ) ( cos 1 ( 2 [ 2 2 2 max 2 max 1 2 1 max 1
max × × − Φ − × × − Φ
= s s s s
c i v i v Q ] ) 1 ( 2 ) 1 ( 2
[vmax1 imax1 r21 v max2 imax2 r22
Qc s s s s × −
× − − × × = 2 1 1
1
(r)A = −
r
A2=1−(2)2
1
1 1 A
r = −
2
2 1 A
r = −
] 2
2
[ max1 max1 1 max2 max2 A2
i v A i v
Qc = s × s × − s × s ×
] 2 [ ) 1 ( 1 max 1 max 1 1 1
1 vs is
A p r p × = − = ] 2 [ ) 1 ( 2 max 2 max 2 2 2
2 vs is
A p r
p = ×
− = ] [ 2 2 1 1 r A r A P
Qc = s× −
] ) 1 ( ) 1 ( [ 2 2 1 1 A A A A P
Qc s
k
P
Q
c s1
×
=
] ) 1 ( ) 1 ( [
2 2
1 1 1
A
A
A A
k
− − − =
)] ( ) ) 1 (
) 1 ( ( ) ( [ ] 2
[ 2
2 1 1
1 max 1
max A
A A A
i v
Q s s
c ×
− − − ×
×
= (6)
When the desired P.F.= cos(ϕ2) = r2 = 1, then A2 = 0
] [ ) 1 (
1
1 1
1 A
A
k ×
− =
] [ ) 1 (
1
1 1
A
A
P
Qc s ×
− × =
] ) ( [ ] 2
[vmax1 imax1 A1
Qc = s × s ×
s
r k P
C = 2×
] ) ) ( 2 (
[ 2
1 1
2
v f
k k
srms × Π =
] ) ) (
( [
2 1 max 1
2
v
f
k
k
s × Π =
Where,
Q1 = The reactive power before PFC.
Q2 = The reactive power after PFC.
p1 = The active power before PFC.
p2 = The active power after PFC.
Qc = The reactive power compensation.
r1 = Cross-correlation coefficient calculated before PFC.
r2 = Cross-correlation coefficient selected to obtain
desired PFC.
A1 = Alienation coefficient calculated before PFC (A1 =
1-(r1)2).
A2 = Alienation coefficient selected to obtain desired
PFC (A2 = 1- (r2) 2), the selected value (A2)is a
value between 0 to 0.1, the selected value is ''0'' in our algorithm).
k1 = A factor depends on alienation coefficients (A1, A2)
before and after PFC.
k2 = A factor depends on alienation coefficients (A1, A2)
before and after PFC and the magnitude and frequency of phase voltage.
Cr = the required capacitance in Farad.
Φ1 = Cos-1(r1), (where, Cos(Φ1) = the original operating power factor angle before PFC).
Φ2 = The desired and selected power factor angle,
(where, Cos(Φ2) = the new operating power factor desired.
vsrms1 = The RMS phase voltage, in Volt, measured before PFC.
vsmax1 and vsmax2 = the maximum values of voltage
signals ,in Volt, measured before and after PFC,
respectively.
ismax1 and ismax2 = the maximum values of current signals, in Amp, measured before and after PFC, respectively.
f = 50 Hz, (where, f = the nominal frequency for power
supply voltage) ᴫ = 3.14159
7-Determine the required number of capacitor banks (Nr)
according to the available reactive power rating (Qu) of one
capacitor bank as follows:
Nr = Qc / Qu (7)
8- Reactive power control relay sends closing signals, for CBs of the required number of capacitor banks, to get unity power factor.
9- Action of capacitor banks insertion by the scheme relies on the following rules:
(a) If 0.0 ≤ As ≤ Assetting (for all phases), Assetting = 0.1, then this case is normal operation condition with desired power factor.
(b) If As > Assetting(for any phase), then this case requires a certain number of capacitor banks to get unity power factor.
To implement our technique, Alienation coefficient (As) is used for calculations of the current power factor (cos(ϕ1)), the active power drawn by load (ps), the reactive
power compensation (Qc) and power factor correction.
Phase alienation coefficient (As), calculated between
voltage and current values at voltage supply side, detects poor power factor (If A1 > 0.1) and hence it is used for automatic adjustable PFC.
The action of scheme is blocked in cases of abnormal conditions (such as: undervoltage, overload/overcurrent, switching, resonant voltage, current transformer saturation and inrush current). These conditions are detected by a transition for alienation coefficient if ∆As(calculated) >
∆As(setting), the selected setting in our proposed algorithm is 0.03); or by a transition for voltage and current signals of power supply if ∆vs < 20%(Vn) or ∆is> 20%(In), as Vn and
In are the nominal voltage and current of power supply, respectively.
3. Electric Circuit Description
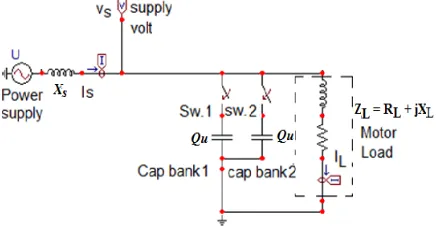
The simulated circuit for power factor correction under study is shown in Fig. 2. The circuit parameters are obtained from the name plate of three phase induction motor and are given in Table 1.
Figure 2. The simulated circuit for power factor correction.
4. Simulation Results
The voltage and current signals (vs and is), from ATP software, generated at sampling rate of 100 samples per cycle; this gives a sampling frequency of 5 KHz. The total simulation time is 0.5 Sec (i.e. the total number of samples is 2500). The inception time for capacitor bank(s) connection is 0.1 Sec (i.e. at sample number 500) from the beginning of simulation time. The proposed technique takes into consideration the wide variations of operating conditions such as different loading levels.
Case 1: PF Correction by Using two Capacitor Banks
The operating conditions of the simulated electric circuit are shown in Table 1. Figures 3 (a-f) show the simulation results for power factor correction in case of load
impedance of ZL = 3.6504+j 3.544 and using two capacitor
banks. The Figures present the instantaneous phase voltage and current signals of power supply, their cross-correlation
and alienation coefficients, instantaneous phase load current, maximum values of voltage and current of power supply, active and compensation reactive powers and the calculated capacitance before, during and after PFC. In this case, it is noticed that the maximum value of phase voltage (vsmax2) for power supply after PFC is higher than the
maximum value of phasevoltage (vsmax1) before PFC; their
values after and before PFC are nearly 187.4 V and 175.4 V, respectively as shown in Fig. 3(c);whereas the
maximum value of totalcurrent (ismax2) drawn from power
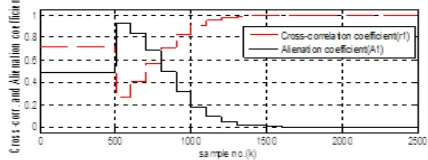
supply after PFC is lower than the maximum value of total current (ismax1) before PFC; their values after and before PFC are nearly 26.44 Amp and 34.46 Amp, respectively as shown in Fig. 3(d). The cross-correlation coefficients (r2) calculated between voltage and current at power supply side are equal and close to unity after PFC; whereas their values (r1) is lower and close to 0.717 before PFC as presented in Fig. 3(b). The algorithm calculates cross-correlation coefficient between each two corresponding windows for voltage and current signals at the power supply side, where the duration time of the correlated window is one cycle. The calculated alienation coefficients
(As) depends on the calculated cross-correlation coefficient
(rs); their values (A2) are equal and close to zero after PFC; whereas their values (A1) are higher and close to 0.486 before PFC as shown in Fig. 3(b). The calculated active
powers (Ps1) are close to 2168.2 Watt before PFC, and they
(Ps2) increase to 2473.8Watt after PFC as shown in Figure
3(e). But the calculated reactive powers compensations
(Qc1) are close to 2105.6 VAR before PFC, and they (Qc2)
decrease to 5.978 VAR after PFC (see Figure 3(e)). Figure 3(f) shows the required capacitance (Cr) in Farad before, during and after PFC; their values are nearly 435.81 µFarad and 0 µFarad, respectively. The maximum value of load current (iL) is not approximately changed before and after PFC, their values are 34.46 Amp and 36.86 Amp, respectively, as shown in Fig. 3(a).
From the shown results, it is clear that the alienation coefficient before and after PFC is good measurement to determine the value of current power factor (i.e. PF Meter). The proposed scheme has also power meter algorithm for measuring active and reactive powers. Besides it has an algorithm of digital reactive power control relay to obtain desired power factor. The action of digital reactive power control relay depends on the alienation values; if their values are greater than pre-setting value (As(setting)= 0.1 is selected) then its algorithm estimates the required number of capacitor banks (Nr) by using the calculated
reactive power compensation (Qc) and the available
reactive power rating (Qu = 1052.8 VAR) of one capacitor
after PFC, their values are 50 Hz. There are distortion harmonics with high frequency injected in the voltage and current signals of power supply with insertion of the two capacitor banks; it is clear their effects on the electrical signals from sample number of 500 to 1400, see Figures 3(a-f). Thus the scheme action is blocked in cases of abnormal conditions (CB switching and resonant voltage). These conditions are detected by a transition for alienation coefficient (∆As) if ∆As(calculated) > ∆As(setting), the selected setting in our proposed algorithm is 0.02.
Table 1. Electric Circuit Parameters Data.
Electric Circuit Parameter Data
Power Supply (as Voltage Source):
Nominal voltage 230 V
Nominal Frequency 50 Hz
Source Reactance(Xs) 0.5 Ω Three Phase Induction Motor (as inductive
load):
Rated active power 7.46 Kwatt (10 HP)
Nominal voltage 220/380 V
Rated current 26.1/15.1 A
Frequency 50 Hz
Rated speed 3470 r/min Single phase fixed capacitances:
(connected parallel with load) 114 Micro Farad
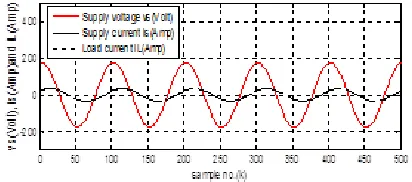
(a) Thesupplyvoltage,totalsupplycurrentandloadcurrentsignals.
(a-1) Thesupplyvoltage,totalsupplycurrentandloadcurrentsignalsbefore PFC.
(a-2)Thesupplyvoltage,totalsupplycurrentandloadcurrentsignalsafter PFC.
(b) Cross-correlation and Alienation Coefficients between phase voltage (vs) and current signal (is).
(c) The maximum value of supply voltage per each cycle (vsmax).
(d) The maximum value of total supply current per each cycle (ismax).
(e) The calculated active and compensation reactive powers.
(f) The required capacitance (cr) in Farad.
Case 2: PF Correction by Using one Capacitor Bank
In this case, all parameters are kept as in case 1 except that only one capacitor bank is connected. Figures 4(a-f) show the simulation results for case 2 by using load impedance of ZL = 3.6504+j 3.544 and only one capacitor bank. The Figures present the instantaneous phase voltage and current signals of power supply, their cross-correlation and alienation coefficients, instantaneous load current, maximum values of voltage and current of power supply, active and reactive powers compensation and the
calculated capacitance before, during and after PFC.In this
case, it is noticed that the maximum value of phase voltage (vsmax2) for power supply after PFC is higher than the
maximum value of phase voltage (vsmax1) before PFC; their
values after and before PFC are nearly 181.3 Volt and 175.4 Volt, respectively as shown in Fig. 4(c);whereas the
maximum value of totalcurrent (ismax2) drawn from power
supply after PFC is lower than the maximum value of total current (ismax1) before PFC; their values after and before PFC are nearly 28.41 Amp and 34.46 Amp, respectively as shown in Fig. 4(d).The cross-correlation coefficients (r2) calculated between voltage and current at power supply side are equal and close to 0.899 after PFC; whereas their values (r1) is lower and close to 0.717 before PFC as presented in Fig. 4(b). As mentioned before, the calculated alienation coefficients (As) is derived from the calculated cross-correlation coefficient (rs); their values (A2) are equal
and close to 0.192 after PFC; whereas their values (A1) are
higher and close to 0.486 before PFC as shown in Fig. 4(b).
The calculated active powers (Ps1) are close to 2168.2 Watt
before PFC, and they (Ps2) increase to 2313.3 Watt after PFC as shown in Figure 4(e). But the calculated reactive
powers compensations (Qc1) are close to 2105.6 VAR
before PFC, and they (Qc2) decrease to 1123.2 VAR after PFC (see Figure 4(e)). Figure 4(f) shows the required capacitance (Cr) in Farad before, during and after PFC; their values are nearly 435.81 µFarad and 217.9 µFarad,
respectively.The maximum value of load current (iL) is not
approximately changed before and after PFC, their values are 34.46 Amp and 35.61Amp, respectively, as shown in Fig. 4(a).As listed in Table 2 and Table 3 the frequency (f1,
f2) of power supply voltage is not changed before and after
PFC, their values are 50 Hz. There are distortion harmonics with high frequency injected in the voltage and current signals of power supply with insertion of one capacitor bank; it is clear its effect on the electrical signals from sample number of 500 to 1400, see Figures 4(a-f).
(a) Thesupplyvoltage,totalsupplycurrentandloadcurrentsignals.
(a-1) Thesupplyvoltage, totalsupplycurrentandloadcurrentsignalsbefore PFC.
(a-2)Thesupplyvoltage,totalsupplycurrentandloadcurrentsignalsafter PFC.
(b) Cross-correlation and Alienation coefficients between phase voltage (vs) and current signal (is).
(c) The maximum value of supply voltage per each cycle (vsmax).
(e) The calculated active and compensation reactive powers.
(f) The required capacitance (cr) in Farad.
Figures 4(a-f). The simulation results in case of power factor correction by using one capacitor banks.
These conditions are detected by a transition for alienation coefficient (∆As).
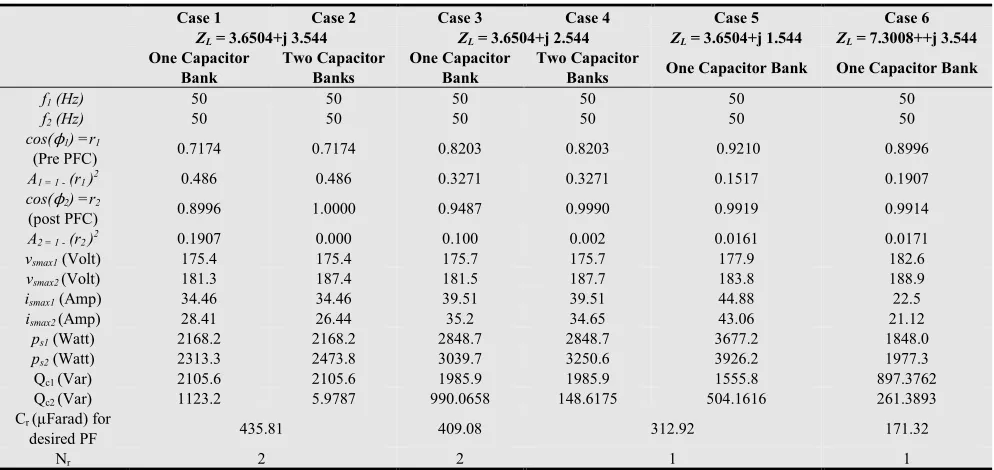
Summary of frequencies (f1, f2), alienation coefficients (r1, r2 , A1, A2) calculated between voltage and current signals, maximum values of voltage and current (vsmax1,
vsmax2, ismax1, ismax2) at power supply side, active and compensation reactive powers (Ps1, Ps2, Qc1, Qc2) and the
required capacitance (Cr) before and after PFC in cases of
different conditions of load currents/operating power factors; results of these case studies are listed in Table 2 and Table 3. The results showed the following information: (b) The measured supply voltage magnitude (at power supply side) is increasing after PFC.
(a) The measured supply current magnitude (out from power supply) is decreasing after PFC.
(c) The measured active power at power supply side is increasing after PFC.
(d) The measured reactive power at power supply side is decreasing after PFC.
(e) The calculated power factor is increasing after PFC (from 0.717 lag to 0.899 lag with using one capacitor bank and to unity with using two capacitor banks); this means power factor correction is verified.
Table 2. Recorded Readings in Different Cases of Power Factor Correction.
Case 1 Case 2 Case 3 Case 4 Case 5 Case 6
ZL = 3.6504+j 3.544 ZL = 3.6504+j 2.544 ZL = 3.6504+j 1.544 ZL = 7.3008++j 3.544
One Capacitor Bank
Two Capacitor Banks
One Capacitor Bank
Two Capacitor
Banks One Capacitor Bank One Capacitor Bank
f1 (Hz) 50 50 50 50 50 50
f2 (Hz) 50 50 50 50 50 50
cos(ϕ1) =r1
(Pre PFC) 0.7174 0.7174 0.8203 0.8203 0.9210 0.8996
A1 = 1 - (r1 )2 0.486 0.486 0.3271 0.3271 0.1517 0.1907
cos(ϕ2) =r2
(post PFC) 0.8996 1.0000 0.9487 0.9990 0.9919 0.9914
A2 = 1 - (r2 )2 0.1907 0.000 0.100 0.002 0.0161 0.0171
vsmax1 (Volt) 175.4 175.4 175.7 175.7 177.9 182.6
vsmax2 (Volt) 181.3 187.4 181.5 187.7 183.8 188.9
ismax1 (Amp) 34.46 34.46 39.51 39.51 44.88 22.5
ismax2 (Amp) 28.41 26.44 35.2 34.65 43.06 21.12
ps1 (Watt) 2168.2 2168.2 2848.7 2848.7 3677.2 1848.0 ps2 (Watt) 2313.3 2473.8 3039.7 3250.6 3926.2 1977.3
Qc1 (Var) 2105.6 2105.6 1985.9 1985.9 1555.8 897.3762
Qc2 (Var) 1123.2 5.9787 990.0658 148.6175 504.1616 261.3893
Cr (µFarad) for
desired PF 435.81 409.08 312.92 171.32
Nr 2 2 1 1
Number ''1'' Denotes Recorded Readings Pre-PFC Desired PF = Selected From ''0.95'' To ''1'' Number ''2'' Denotes Recorded Readings Post-PFC
Table 3. Recorded Readings in Different Cases of Power Factor Correction.
Electrical Parameter
Case 7 Case 8 Case 9 Case 10 Case 11 Case 12 Case 13
ZL= 3+j 3.544 ZL = 2.6504+j 3.544 ZL = 2+j 3.544
One Capacitor Bank
Two Capacitor Banks
One Capacitor Bank
Two Capacitor
Banks
One Capacitor
Bank
Two Capacitor
Banks
Three Capacitor
Bank
f1 (Hz) 50 50 50 50 50 50 50
f2 (Hz) 50 50 50 50 50 50 50
cos(ϕ1) = r1
(Pre PFC) 0.6460 0.6460 0.5988 0.5988 0.4914 0.4914 0.4914
Electrical Parameter
Case 7 Case 8 Case 9 Case 10 Case 11 Case 12 Case 13
ZL= 3+j 3.544 ZL = 2.6504+j 3.544 ZL = 2+j 3.544
One Capacitor Bank
Two Capacitor Banks
One Capacitor Bank
Two Capacitor
Banks
One Capacitor
Bank
Two Capacitor
Banks
Three Capacitor
Bank cos(ϕ2) = r2
(post PFC) 0.8231 0.9811 0.7685 0.9509 0.6362 0.8421 0.9944
A2 = 1 - (r2 )2 0.3225 0.0374 0.4094 0.0958 0.5952 0.2909 0.0112
vsmax1 (Volt) 173.2 173.2 171.9 171.9 169.4 169.4 169.4
vsmax2 (Volt) 179.2 185.2 178.3 184.1 177.9 182.7 185.7
ismax1 (Amp) 37.29 37.29 38.83 38.83 41.61 41.61 41.61
ismax2 (Amp) 30.31 26.36 31.39 26.52 34.05 26.74 24.33
ps1 (Watt) 2085.7 2085.7 1998.3 1998.3 1731.9 1731.9 1731.9 ps2 (Watt) 2222.7 2375.8 2127.3 2274.2 1834.2 1966.9 2116.3
Qc1 (Var) 2464.7 2464.7 2672.9 2672.9 3069.9 3069.9 3069.9
Qc2 (Var) 1533.4 468.8514 1771.0 740.4316 2224.4 1259.8 225.4637
Cr (µFarad) for
desired PF 523.21 575.96 681.10
Nr 2 2 3
Number ''1'' Denotes Recorded Readings Pre-PFC Desired PF = Selected From ''0.95'' To ''1'' Number ''2'' Denotes Recorded Readings Post-PFC
From the obtained results, it clearly appears that the proposed technique based on alienation algorithm succeeded in power factor calculation besides identification of the required number of capacitor banks to get improved and desired power factor. The technique has also the advantage of auto adjustable power factor correction to ensure the entire power system always preserving almost unity power factor and thus optimizing the current consumption.
5. Conclusions
In this paper, an alienation technique for automatic power factor correction has been proposed. The main achievements of this work are as follows:
1. Phase voltage and line-current measurements at power supply side are sufficient to implement this technique.
2. Introduced a new technique based on alienation algorithm for calculation of current power factor on-line and acts as a power factor meter.
3. Succeeded in determination of required capacitor rating and number of capacitor banks, based on alienation coefficients, to obtain new power factor desired.
4. It is auto adjustable power factor correction to ensure the entire power system always preserving almost unity power factor and thus optimizing the current consumption.
5. It is accurate to identify power factor and reactive power compensation values.
6.The suggested alienation technique is characterized by
being simple, fast, reliable and accurate and can be implemented practically, thus it can be used as a base for implementing a cheap and reliable digital reactive power control relay in power system.
7. The reliability of the proposed method is quite high. 8. It is quite effective over a wide range of a pre-PFC power levels and power factor angles.
9. The technique does not use the power system element data as it needs only measuring the phase voltage and line-current.
10. It can control the proposed algorithm sensitivity (initiation of reactive power control relay) by selecting alienation setting.
11. The harmonics and abnormal conditions are detected by estimation of transition for alienation coefficients and hence the proposed scheme is blocked in order to avoid capacitor bank insertion during these conditions.
References
[1] K. K. Kapil, “Reduction in transmission and distribution loses, an opportunity for earning carbon credits”, Available online: http://www.slideshare.net/kris_kapil/cdm-in-reduction-in-transmission and-distribution-losses.
[2] Y. Jiang, F.C. Lee, G. Hua and W. Tang, “A novel single-phase power factor correction scheme,” Eighth Annual Applied Power Electronics Conference and Exposition, pp: 287-292, 1993.
[3] S. Basu and M.H.J. Bollen, “A Novel Common Power Factor Correction Scheme for Homes and Offices,” IEEE Transactions on Power Delivery, Volume: 20, Issue: 3, pp: 2257 - 2263, 2005.
[4] L. W. W. Morrow, “Power-factor correction,” Transactions of the American Institute of Electrical Engineers, vol. XLIV, pp. 1–7, Jan 1925.
[5] D.K. Maly and K.S. Kwan, “Optimal battery energy storage system (BESS) charge scheduling with dynamic programming,” IEE Proceedings in Science, Measurement and Technology, pp: 453- 458, 1995. Fang Lin Luo and Hong Ye, ''Research on DC-Modulated Power Factor Correction AC/AC Converters'' Industrial Electronics Society, 2007. IECON 2007. 33rd Annual Conference of the IEEE, PP: 1478 – 1483, Nov. 2007.
[7] Mather, B.A. and Maksimović, D., ''A Simple Digital Power-Factor Correction Rectifier Controller'', Power Electronics, IEEE Transactions on (Volume: 26 , Issue: 1) , PP: 9 – 19, Jan. 2011.
[8] Wang Su, ''Research and Simulation of Active Power Factor Correction Based on the Three-Phase Rectifier'', Power and Energy Engineering Conference (APPEEC), 2011 Asia-Pacific, PP:1 – 3, March 2011.
[9] J. Hazra, Balakrishnan Narayanaswamy, Kaushik Das, Ashok Pon Kumar, Deva P Seetharam, De Silva Liyanage and Sathyajith Mathew "Decentralized Power Factor Correction." Sustainable Future Energy 2012 and 10th See Forum
Innovation for Sustainable and Secure Energy 21-23 November 2012, Brunei Darussalam.
[10] Sanjay N. Patel, Mulav P. Rathod, Keyur C. Patel, Parth H. Panchal, Jaimin N. Prajapati , ''Thyristorised Real Time Power Factor Correction (TRTPFC)'', International Journal of Engineering Research & Technology, Vol.2 - Issue 3, March – 2013.
[11] Abhinav Sharma, Vishal Nayyar, S. Chatterji, Ritula Thakur3and P.K. Lehana, ''PIC Microcontroller Based SVC for Reactive Power Compensation and Power Factor Correction'', International Journal of Advanced Research in Computer Science and Software Engineering, Volume 3, Issue 9, September 2013.
[12] ATP - version 3.5 for Windows 9x/NT/2000/XP - Users' Manual – Preliminary Release No. 1.1 - October 2002.
[13] W. Hauschild, and W. Mosch, “Statistical Techniques for High Voltage Engineering”, hand book, English edition published by peter pere grinus Ltd., London, United Kingdom, chapter 2, pp. 78-79, 1992.
[14] Edwards, A. L. "The Correlation Coefficient." Ch. 4 in an Introduction to Linear Regression and Correlation. San Francisco, CA: W. H. Freeman, pp. 33-46, 1976.
[15] M.Vitins, "A correlation Method for transmission line protection'', IEEE Transactions Power Apparatus and Systems, Vol.97, No.5, Sep/Oct 1978, pp.1607-1617.
[16] Snedecor, G. W. and Cochran, W. G. "The Sample Correlation Coefficient r and Properties of r." 10.1-10.2 in Statistical Methods, 7th ed. Ames, IA: Iowa State Press, pp. 175-178, 1980.
[17] Press, W. H.; Flannery, B. P.; Teukolsky, S. A.; and Vetterling, W. T. "Linear Correlation", Cambridge, England: Cambridge University Press, pp. 630-633, 1992.