Published online December 24, 2014 (http://www.sciencepublishinggroup.com/j/ajls) doi: 10.11648/j.ajls.s.2015030102.14
ISSN: 2328-5702 (Print); ISSN: 2328-5737 (Online)
Metabolic and morphological changes in rats’ eye after
7-days microgravity simulation
Margarita Vyalkina
1, Anatoly Fedorov
2, Erika Eskina
3, Yulia Medvedeva
1, Elena Arkhipova
1,
Marina Lebedeva
1, Nadezhda Khlebnikova
1, Mikhail Baranov
4, Mikhail Karganov
11
Lab of Physicochemical and Ecological Pathophysiology, Institute of General Pathology and Pathophysiology, Moscow, Russia 2
Lab of the Fundamental Investigations in Ophthalmology, Research Institute of Eye Diseases, Moscow, Russia 3
Ophthalmological Department of Federal Medical-Biology Agency of Russia, Sphere Eye Clinic, Moscow, Russia 4
Experimental Clinical Dept., Research Institute for Space Medicine, Federal Biomedical Agency of Russia, Moscow, Russia
Email address:
[email protected] (M. Karganov)
To cite this article:
Margarita Vyalkina, Anatoly Fedorov, Erika Eskina, Yulia Medvedeva, Elena Arkhipova, Marina Lebedeva, Nadezhda Khlebnikova, Mikhail Baranov, Mikhail Karganov. Metabolic and Morphological Changes in Rats’ Eye after 7-Days Microgravity Simulation. American Journal of Life Sciences. Special Issue: Space Flight Factors: From Cell to Body. Vol. 3, No. 1-2, 2015, pp. 18-24. doi: 10.11648/j.ajls.s.2015030102.14
Abstract:
Microgravity simulation in rats resulted to changes in eye lavage content. Molecular subfraction analysis with laser correlation spectroscopy revealed significant differences in the pattern of particle distribution in five intervals: 1.9 -2.56 nm, 4.64-6.25 nm, 91.3 nm, 165-300 nm, and 400-734 nm. Microgravity modeling induced a series of interrelated processes in the retina of experimental rats manifesting in decreasing of total and layer-by-layer thickness of the retina, mild edema, and consequently, the increasing of specific density of neurons. In the inner nuclear layer, the cell density decreased because of the amacrine and bipolar cells. These changes could be explained by relative ischemia of the retinal layers, which are dependent on the retinal vessels circulation system.Keywords:
Amacrine Cells, Bipolar Cells, Laser Correlation Spectroscopy, Microgravity Simulation, Muller Cells, Retinal Vessels1. Introduction
During the last years, following the increased intensity of space flights, the investigations of weightlessness influence on the human body in general as well as on the delicate and high developed body functions are also increasing.
It was published [1] that approximately 20% of astronauts on International Space Station (ISS) missions have developed measurable ophthalmic changes after flight. Authors found out the significant role of such nutrition factors as folate– and vitamin B-12-dependent 1-carbon and related biochemical indices and alteration of their metabolic pathway. The biochemical differences observed in crewmembers with vision issues strongly suggest that their folate- and vitamin B-12-dependent 1-carbon transfer metabolism was affected before and during flight. According to these changes were found out the hyperopic shift in cycloplegic refraction. It was suggested that polymorphisms in enzymes of this pathway may interact with microgravity to cause these pathophysiologic difference. It was also hypothesized that
microgravity-induced cephalad fluid shifts and resultant increased intracranial pressure and/or localized intraorbital changes may be involved.
It was also found out that microgravity in humans cause decreasing of intraocular pressure (IOP) [2], as well as optical coherence tomography (OCT) documented an increase in retinal thickness and volume with following corresponding scotomas. It took almost 6 months until these changes came back to the baseline.
Severe cases presented additional signs, such as globe flattening with hyperopic shifts, choroidal folds and cotton wool spots, resulting in some cases in permanent visual impairment. It is clear, that all these changes can lead to the changes of visual functions and influence the ability of the staff to make right and quick decisions.
of the experimental animals [6, 7] for 7 days in a special stand with a head-down tilt of 30o. The stand consisted of a frame with a beam rolling between the two guide rails and carrying a movable carriage. The carriage moved in all directions in the horizontal plane above a grid floor (40×40 cm), under which a tray for collection of excrements was placed. For uniform body weight distribution, a special system consisting of a Capron sheath with holes for limbs was used for suspension of the animal to the movable carriage. Two metal plates placed in the sheath along the animal back prevented sagging and ensured the chosen suspension angle for the animal body.
Figure 1. Experimental animal in the stand for microgravity modeling.
Lavage samples from both eyes were collected as follows: 200 µl physiological saline was applied to the eye with a disposable tip without touching the cornea and simultaneously collected with another pipette to avoid the contact of fluid excess with the hair. The samples were stored at +4oC for 3-4 h or at -20oC for no more than 5 days until assay. Immediately before the analysis, the samples were centrifuged for 15 min at 3000 rpm and the supernatant was added to the measuring cell of the instrument. Laser correlation spectroscopy (LCS) allows analysis of the subfraction composition of bioingredients in a wide range of their molecular sizes (from 1 to 10,000 nm). From the physical point of view, the method is based on principles of Doppler spectroscopy [8]. Detailed LC-histograms formed by
and peripheral zone were isolated. The fragments were postfixed in 1% osmium tetroxyde (1 h), dehydrated in increasing concentrations of an organic solvent, and embedded in mix of epoxy resins epon-araldite (1:1). Semi-thin 0.5-1.5-µ sections were cut on an Ultratome-IV (LKB, Sweden) and stained with methylene blue and fuchsin (polychrom staining). The preparations were examined under a Leica DM-2500 light microscope, photographed using a Leica DFC320 camera, and images were analyzed using Image Scope Color software.
3. Results and Discussion
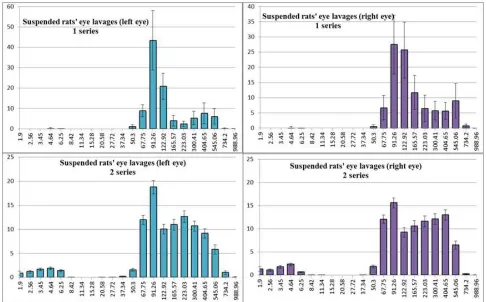
Two experimental series with 7-day simulation of microgravity were performed, the interval between the series was 9 months. First, it was necessary to ensure stability and reproducibility of the results. To this end, we compared the results obtained for the left and right eyes of experimental and control animals. As is seen from Figures 2 and 3, there were no significant differences in the particle distributions in the washout fluids from the left and right eyes in both the control and experimental groups. Minor differences between the series can be explained by seasonal fluctuations of serum homeostasis. These findings allow us pool the results obtained from both eyes within the same series.
Figure 2. Histogram of size distribution of particles in control rats’ eye lavages. Ordinate – contribution of particles of the corresponding zone into light scattering (%). Abscissa – particle size (nm).
changes.
Normally on semi-thin sections, rat retina by its
neurons and glial cells equally decreasing as well.
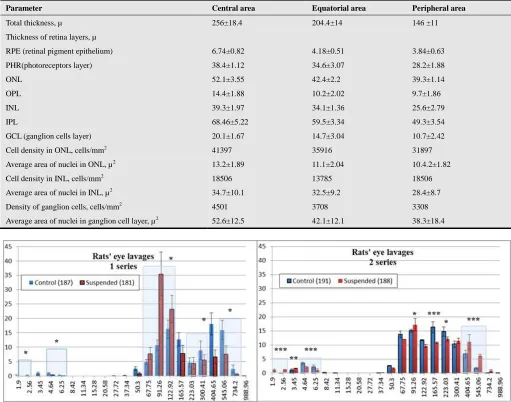
Table 1. Morphometric parameters of rat retina (control group, n=5)
Parameter Central area Equatorial area Peripheral area
Total thickness, µ 256±18.4 204.4±14 146 ±11
Thickness of retina layers, µ
RPE (retinal pigment epithelium) 6.74±0.82 4.18±0.51 3.84±0.63
PHR(photoreceptors layer) 38.4±1.12 34.6±3.07 28.2±1.88
ONL 52.1±3.55 42.4±2.2 39.3±1.14
OPL 14.4±1.88 10.2±2.02 9.7±1.86
INL 39.3±1.97 34.1±1.36 25.6±2.79
IPL 68.46±5.22 59.5±3.34 49.3±3.54
GCL (ganglion cells layer) 20.1±1.67 14.7±3.04 10.7±2.42
Cell density in ONL, cells/mm2 41397 35916 31897
Average area of nuclei in ONL, µ2 13.2±1.89 11.1±2.04 10.4.2±1.82
Cell density in INL, cells/mm2 18506 13785 18506
Average area of nuclei in INL, µ2 34.7±10.1 32.5±9.2 28.4±8.7
Density of ganglion cells, cells/mm2 4501 3708 3308
Average area of nuclei in ganglion cell layer, µ2 52.6±12.5 42.1±12.1 38.3±18.4
Figure 4. Histogram of size distribution of particles in control and suspended rats’ eye lavages. Ordinate – contribution of particles of the corresponding zone into light scattering (%). Abscissa – particle size (nm). Blue zone – area of significance.
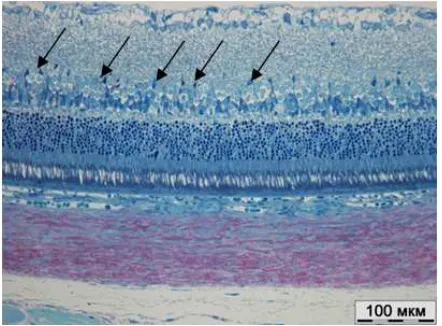
Figure 5. Control group. Posterior pole area. Great blood vessel in the nerve fiber layer (arrow). Semithin section. Staining with methylene blue and fuchsin.
Figure 6. Control group. Equatorial area. Semithin section. Staining with methylene blue and fuchsin.
Figure 7. Control group. Equatorial area. Patent retinal capillaries reached external plexiform layer (arrow). Semithin section. Staining with methylene blue and fuchsin.
After the 7 day of experiment, the total thickness of the retina in the central zone (posterior pole) decreased a little (up to 218±3.95 µ) without specific predominance of any layer. In contrast to narrowed retinal arterioles, retinal veins looked dilated (Fig. 9), this change of vessel diameter can lead to hypoxia of the inner layers of the retina and alterations related to venous stasis. Also at this period we can see that neuronal density in the corresponding layers slightly decreased, but the size of neurocyte nuclei was increased, thus the difference between the layers thickness in the compared groups disappears (Table 2). Increased nuclei size can be a sign of over activation of the synthetic processes, which exhaust cell reserves.
Table 2. Morphometric parameters of rat retina (experimental group, n=8 )
Parameter Central area Equatorial area Peripheral area
Total thickness, µ 218±3,95 182,4±14 133 ±11
Thickness of retina layers, µ
RPE (retinal pigment epithelium) 4,31±0,72 4,18±0,51 3,84±0,63
PHR (photoreceptors layer) 34,3±1,52 34,6±3,07 26,2±2,58
ONL 49,9±1,19 36,6±2,2 30,3±1,14
OPL 10,2±2,1 9,84±1,02 5,11±1,58
INL 32,5±1,87 25,6±3,72 17,7±1,79
IPL 62,3±3,39 59,5±3,34 43,3±4,54
GCL (ganglion cells layer) 15,8±2,68 13,3±1,84 8,97±1,41
Cell density in ONL, cells/mm2 38710 36581 32369
Average area of nuclei in ONL, µ2 14,9±2,15 13,5±3,14 12,8±3,74
Cell density in INL, cells/mm2 15721 13957 12600
Average area of nuclei in INL, µ2 33,4±5,7 35,7±8,1 39,7±2,6
Density of ganglion cells, cells/mm2 3801 3608 3278
Figure 8. Control group. Peripheral area. Dilated vessels in the nerve fiber layer (arrows). Semi-thin section. Staining with methylene blue and fuchsin.
Figure 9. Experimental group. Posterior pole area. Dilated retinal vein (arrow). Semithin section. Staining with methylene blue and fuchsin.
In the equatorial area, rarefaction and enlargement of neurons in inner nuclear layer (INL) becomes more evident. Thinning of INL from the inner side visually appears like "movement" of the Muller cells nuclei closer to the boarder of IPL (Fig. 10).
Figure 10. Experimental group. Equatorial area. Thinning of inner nuclear layer “brings” nuclei of Muller cells (arrows) towards the inner plexiform layer. Semithin section. Staining with methylene blue and fuchsin.
Figure 11. Experimental group. Equatorial area. Aggregation of erythrocytes in deep retinal capillaries (arrow). Edema and rarefaction of amacrine (Am) and bipolar (BP) cells. M – Muller cells. Semi-thin section. Staining with methylene blue and fuchsin.
At higher magnification, we can see that the density of INL nuclei decreased because of the bipolar and horizontal cells (Fig. 11). Erythrocyte aggregation (sludging) in deep capillary loops can lead to worsening of nutrition for the dependent inner retinal layers.
Figure 12. Experimental group. Peripheral area of the retina. No dilated vessels. Reduced density of neurons and increase in their mean area. Semi-thin section. Staining with methylene blue and fuchsin.
The total density of the retina in peripheral zones decreased up to 133±11.2 µ (Fig. 8). w as well as the tendency of contraction of choroidal and retinal vessels was also seen. Most of the capillaries were occluded with erythrocyte aggregates.
Thus, microgravity modeling induced a series of interrelated processes in the retina of experimental rats manifesting in decreasing of total and layer-by-layer thickness of the retina, mild edema, and consequently, the increasing of specific density of neurons. These changes were more visible in the inner nuclear and ganglion cell layers.
In the inner nuclear layer, the cell density decreased because of the amacrine and bipolar cells.
the IPL. The size of ganglion cell layer neurons was increased due to the cell edema. These changes could be explained by relative ischemia of the retinal layers, which are dependent on the retinal vessels circulation system.
The latter is characterized by constriction of the large arterial vessels, dilation of veins, and erythrocyte aggregation in microvessels impairing transcapillary blood flow. It is evident that the retinal circulation system is less resistant to gravity factors than the choriocapillary bed. Long-term exposure to factors causing ischemia in the inner layers of the retina, i.e. regions supplied via retinal vessels, can disturb processing of the primary signal from photoreceptors and impair highly organized and sensitive functions of the visual analyzer provided by bipolar and ganglion cells. This fact should be taken into account when planning visual tasks for astronauts.
Comparative morphometric analysis revealed significant differences in the thickness of the retinal pigment epithelium and photoreceptors in the central zone of the retina supplied with blood EXCLUSIVELY from the choroidal vessels. Hence, these areas are more hemodynamically vulnerable than equatorial and peripheral regions of the retina, where significant changes at the chosen exposure were recorded only in the outer nuclear and plexiform layers. The most pronounced changes (reduced thickness) were observed in the inner nuclear layer of the central, equatorial, and peripheral regions of the retina.
All morphometric differences in the both groups were statistically insignificant, transient, and temporary. Longer experimental exposure to the gravity factors can help to identify most susceptible elements of the visual analyzer. We hope to obtain these data in further experiments at different terms after microgravity modeling.
References
[1] Zwart S.R., Gibson C.R., Mader T.H., Ericson K., Ploutz-Snyder R., Heer M., Smith S.M., “Vision changes after spaceflight are related to alterations in folate– and vitamin B-12–dependent one-carbon metabolism,” J. Nutr. 142: 2012, pp. 427–431.
[2] Taibbi G., Kaplowitz K., Cromwell R.L., Godley B.F., Zanello S.B., Vizzeri G., “Effects of 30-Day Head-Down Bed Rest on Ocular Structures and Visual Function in a Healthy Subject,” Aviat Space Environ Med, vol. 84(2), 2013, pp. 148-154.
[3] Zanello S.B., Nguyen A., Theriot C.A., “Retinal non-visual photoreception in space,” Aviat Space Environ Med, vol.84(12), 2013, pp. 1277-1280.
[4] Chylack L.T. Jr, Peterson L.E., Feiveson A.H., Wear M.L., Manuel F.K., Tung W.H., Hardy D.S., Marak L.J., Cucinotta F.A., “NASA study of cataract in astronauts (NASCA). Report 1: Cross-sectional study of the relationship of exposure to space radiation and risk of lens opacity,” Radiat Res., vol.172(1), 2009, pp.10-20. doi: 10.1667/RR1580.1.
[5] Roberts J.E., Kukielczak B.M., Chignell C.F., Sik B.H., Hu D.N., Principato M.A., “Simulated microgravity induced damage in human retinal pigment epithelial cells,” Mol Vis., vol.30(12), 2006, pp. 633-538.
[6] Morey E.R., Sabelman E.E., Turner R.T., Baylink D.J., “A new rat model simulating some aspects of space flight,” Physiologist, vol.22, No. 6, 1979, pp.S23-24.
[7] Ilin E.A., Novikov V.E., “Stand for modelling the physiological effects of weightlessness in laboratory experiments with rats,” Kosm Biol Aviakosm Med, vol.14, No 3, 1980, pp.79-80. (in Russian)
[8] Karganov M., Alchinova I., Arkhipova E., Skalny A.V., “Laser Correlation Spectroscopy: Nutritional, Ecological and Toxic Aspects,” In: “Biophysics”. A.N. Misra ed. InTech, 2012, -ISBN 978-953-51-0376-9. P.1-16. DOI: 10.5772/35254
[9] Karganov M., Skalny A., Alchinova I., Khlebnikova N., Grabeklis A., Lakarova E., Eisazadeh S., “Combined use of laser correlation spectroscopy and ICP-AES, ICP-MS determination of macro- and trace elements in human biosubstrates for intoxication risk assessment,” Trace elements and electrolytes, vol. 28, No 2, 2011, pp.124-127.
[10] B. E. Crucian, R. P. Stowe, D. L. Pierson, C. F. Sams, “Immune system dysregulation following short- vs longduration spaceflight,” Aviation Space and Environmental Medicine, vol. 79, No 9, 2008, pp. 835–843.
[11] G. Sonnenfeld, J. S. Butel, W. T. Shearer, “Effects of the space flight environment on the immune system,” Reviews on Environmental Health, vol. 18, No. 1, 2003, pp. 1–17.
[12] Girardi C., De Pittà C., Casara S., Calura E., Romualdi C., Celotti L., Mognato M., “Integration Analysis of MicroRNA and mRNA Expression Profiles in Human Peripheral Blood Lymphocytes Cultured in Modeled Microgravity,” BioMed Research International, 2014, Article ID 296747, 16 pages, http://dx.doi.org/10.1155/2014/296747
[13] Alchinova I., Arkhipova E., Medvedeva Yu., Cherepov A., Antipov A., Lysenko N., Noskin L., Karganov M., “The complex of tests for the quantitative evaluation of the effects of radiation on laboratory animals,” – this issue, pp. 5 – 12.