ISSN: 2231-5381 http://www.ijettjournal.org
Page 399Optimization of Sand Casting Process
Parameters for 46MnSi
4
Alloy Steel Trash
Plate Castings Applicable for Roller Stand
Kidu Geberecherkos Weldeanenia
#1, Asmamaw Tegegne Abebe
#2Federal TVET Institute, Addis-Ababa, Ethiopia
Abstract
This research is intended to optimize the sand casting process parameters of trash plate castings produced from 46MnSi4 alloy steel in ferrous metal foundryapplicable for roller stand of sugar industry.The trash plate should attain high toughness and resistant to the roller load. However the due to different reasons including casting parameters the plate gets low quality and is usually affected by different defects including porosity. The objective of the this research was thus optimizing sand casting process parameters of 46MnSi4 alloy steel trash plate castings manufactured at Akaki Basic Metal Industry for the purpose of roller stand used in sugar industries. To carry out the researchphysical observation, photographic analysis, brainwashing and experimentation methods were used. Purposive sampling method was considered and 18 samples (trash plates) were taken for analysis. Experiment was carried out using Taguchi design approach and then effects of factors were analysed using Minitab software.
Optimum settings of the selected process parameters namely pouring time, runner size and pouring temperature ware 82 seconds, 62cm2 and 1672Oc respectively. Contribution of factors were analysed using ANOVA method and results obtained were pouring time accounted equals 66.33% of the total effect, the runner size 19.44% and pouring temperature was 6.27%.Thus the dominant parameter affecting the quality of the plat was pouring time of liquid metal, which needs careful setting.
Keywords: Parameter optimization, gating system design, optimum settings, casting defects, analysis of variance.
I.
INTRODUCTIONCasting is one of the production processes of components that occupy the world market in the production of components for human use. Both ferrous and nonferrous metals are cast using different methods including sand casting. However the soundness of cast products are affected due to different reasons including inappropriate process parameter settings. Casting defects like shrinkage, crack, porosity etc. are some of the common defects affecting the quality of castings. Setting optimum
parameters is one of the important issue for achieving sound castings. Various methods such as Taguchi method, Minitab analysis, ANOVA and others may involve in optimizing the process parameters of sand casting.
As experience and literature [1] show design of experiment is a systematic method used to determine the relationship between factors that affecta process and itsoutput. It is used to investigate cause-and-effect relationships and needed to manage process inputs for optimization of the output. Experimental design can be used at the point of greatest leverage to reduce design costs by speeding up the design process, reducing late engineering design changes, and reducing product material and labor complexity, and are powerful tools to achieve manufacturing cost savings by minimizing process variation and reducing rework, scrap, and the need for inspection.Taguchi [2] was developed the idea of orthogonal array method analysis and design of experiments. Orthogonal arrays are used to organize the parameters affecting the process and the levels at which they should be varies. The orthogonal array method is best used when there is an intermediate number of variables [2], few interactions between variables, and when only a few variables contribute significantly and tests pairs of combinations. These arrays are selected basedon number of parameters (variables) and the number of levels. This allows to collect the necessary data essential to determine factors that strongly affect product quality by conducting a minimum number of experimentations, thus saving time and resources.
From the above it is possible to underline that using the mentioned methods optimizing parameters of sand casting is important element that helps to improve quality of castings.
ISSN: 2231-5381 http://www.ijettjournal.org
Page 400is used for varieties of applications including sugar factories.Statistical analysis for quality control is applied by the industry and common defects affecting the trash plate as mentioned in [3] include porosity, blow hole and other related voids.The researchers studied four process parameters including sand to binder ratio, mould permeability, pouring temperature and deoxident amount in three levels. Nine experiments were conducted using Taguchi’s DoE by changing selected variables. However the researchers show only the effects of the mentioned defects but did not optimize the parameters. Theoptimum design and analysis of riser [4] for sand casting of heat flow within the casting, and from the casting to the mould and finally the temperature history of all points inside the casting have been studied. The study described also simulation of solidification process that enables visualization of the progress of freezing inside the casting and identification of the last freezing regions that facilitated the optimized placement The study also include design of feeders and feeding aids with improvement in yield while ensuring casting soundness without expensive and time consuming trial runs. The result presents that the optimum location of riser using ANSYS software helped in minimizing the solidification related defects, thereby providing a defect free casting. An optimization techniquefor sand casting process parameters based on the Taguchi method has been also carried out[5] for investigating the effects of sand casting process parameters, namely the mould temperature, pouring temperature and runner size while kept other parameters constant on the hardness and impact energy values of aluminium alloy castings. The effect of the selected process parameters on hardness and impact energy and subsequent setting of the parameters were accomplished using Taguchi’s parameter design approach. Among the industrial activities [6] sand casting process still remains as one of the most complex and indefinite activities. It describes that due to the complex relationship between casting defects and green sand properties, it is imperative to control many green sand characteristics that influence casting quality.From research [7] it is clear that shrinkage is a major defect in sand casting and often becomes a cause of casting rejections and rework in casting industry. It is a phenomenon concerning the reduction in the size of a casting during its transition from a liquid to a solid state. The volume in both the liquid and solid phases changes under the influence of temperature. The difference in density of the liquid and solid phases, [7] which causes a significant difference in the volume of these phases, should be taken into account. The Taguchi method [8] was applied to optimize the sand casting process parameters of the castings manufactured in iron foundry by maximizing the signal to noise ratios and minimizing the noise factors. Researcher [8] studied eight process parameters such including moisture, sand particle size, green compression strength, mould
hardness, permeability, pouring temperature, pouring time and pressure test. Eighteen experiments were conducted using Taguchi’s L18 DOE by changing selected variables. The study was considered casting defects as quality characteristic and the smaller the better number of casting defect was taken as the better process performance. From the above it is possible to conclude that analysing and optimizing casting parameters using various methods including Taguchi DOE is effective instrument to obtain sound castings. Thus the current research focuses on the optimization of parameters causing defects on the trash plate mentioned above.
II.
MATERIALS AND METHODSThe trash plate material was 46MnSi4 alloy steel with
the chemical composition of C: 0.459, Mn: 1.15, Si: 0.72, S: 0.030, P: 0.045 and other elements with the balance of iron. the trash plate is used in sugar industries that is applicable for roller stand and for squeezing the baggass of sugar cane in order to separate juice. Composition analysis was made using mobile spectrometer. the mold materials and additives used were mixed sand (new and reclaimed silica sand), parting sand, resin (binders) and catalyst (chemical), zirconium, dolomite powder(facing sand),alcohol, metallic paint. The de-slagging agent, pure aluminium and asbestos were also used
METHODS
Mixed method includingexperimental method was used following the procedure explained below. Physical observation, brain washing and interviews of 15 worker including, casters, mold makers, pattern makers, expertise and managerial groups to gather expert were used in conducting the research. To carry out the experiment sand casting was selected. The patterns were prepared from wood and coated with paint. The clay content and GFN values of the mixed silica sand used for mold preparation were tested using causticsoda solution and sieve analyser machine respectively. The mold was prepared from dry silica sandthat was bonded with resin and catalyst that furnished with dolomite powder.
Eighteen trash plate pattern samples ordered by sugar industries were selected using purposive sampling method. The net weight of each trash plate was 684.41kg and its final dimensions were 2300 x439x168mm corresponding to length, width and largest height respectively.
ISSN: 2231-5381 http://www.ijettjournal.org
Page 401Figure 1: 3D-geometry of actual trash plate patterns
III.
DATAANDEXPERIMENTALANALYSISPhysical observation of the trash plates was made and was found that porosity, shrinkage, sand sintering and shape changes were the main problems, which affect the trash plate.
The data collected from interviews and brain storming were also analysed and was found that the defects were occurring due to lack of controlling the input process parametersthat was connected with lack of skilled man power and proper controlling parameters of casting. Material properties and handling system were also considered as factors for the formation of the mentioned defects.
Dimensions of the actual trash plate patterns were designed using CATIA V5 software considering machining allowance, shrinkage allowance and draft angel that was given by the foundry experts of the case industry (figure2) and then, the gating system elements were designed from the gross weight of the trash plates’ using gating ratio and constructed on the prepared dry sand mold.
Figure 2: Side-view of actual trash plate patterns
When designing the pattern machining allowance, shrinkage allowance and draft angle that have been given by foundry pattern section which was 6mm, 2%,1o respectively, actual sizes of the patterns (final dimensions of mold cavity) was estimated and found to be 2346x465x176 mm respectively to length, width and larger height. Also, draft angel was given to the top curved surfaces and the lengths of top sides were found 2350mm. The initial volume and total surface area of each pattern (mold cavity) was checked using CATIA software and found as 0.087m3 and 2.464m2respectively, which was within the standard
dimension of the industry allowed for the trash plate. Figure 2 displays the side view of actual trash plate designed by CATIA software.
While conducting the research gross weight analysis was also carried out. Weight of castings (Wg) were also considered as one element that may affect the quality of casting.
The gross weight of casting can be defined as the weight of metal in mould cavity and weight of all gating system elements or yielding of material (excess weight of parts removed from casting by machining and grinding operations). Using the maximum casting yield of steel material of 60%, that was given by the foundry’s method section, the gross weight of casting,
Wg, that was used in a single mold was determined using Equation(1) as following [9].
(1)
The net weight, total volume, surface area and density of each patterns used in trash plate castings were designed using CATIA software and found mass (784.853kg), density(7860Kg/m3), total volume (0.10m3), surface area (2.659m2), length (2346
(base)-2350(top)mm), width (465mm), largest
height(176mm) and largest thickness (121.26mm). As per the designed and actual trash plate patterns dimensions, the required mould sizes was estimated and found that length 2900mm, width 1000mm and total height 610mm, choking range of 40mm. The moulds used have initial temperature of 27 OC, room temperature of 20OC and poured at tilted angle of 7O(from horizontal). External metallic chill with dimensions of 46.5 x22x3 mm were also constructed and used in the heavy section of the plates. The concept of size analysis helped to determine the gating system type and parameters, determine the controlling parameters and the materials required for the given plate casting.Analysis of gross weight was followed byestimation of pouring time which is one aspect to enhance the quality of casting. Pouring time here is the time needed to fill the mold cavities completely with molten metal of the 46MnSi4 alloy steel. Pouring
time was calculated by considered the fluidity factor,
S, depending on iron composition and pouring temperature taken from[12], thickness of the large casting wall, T, and gross weight of castings (kg), Wg
using Equation(2) [10].
) (sec) (2)
The pouring time estimated using the numerical method of Equation (2) above indicates the total time required to fill the given weight of metal into the gating system elements’ and mold cavities was 82 seconds.
ISSN: 2231-5381 http://www.ijettjournal.org
Page 402cross-sectional area of the passages. The critical gating system elements of the trash plate castings namely ingate, runner, sprue, sprue base, pouring basin, riser and riser base were designed. Here, total ingate areas required [9, 11] in one trash plate casting were calculated from the formula provided in Equation (3).
(3)
Where, Ai-total ingate areas, Wg -gross weight of casting (Kg),ρm - density of metal used, H-effective
height of metal head in the cope side of the mold which is 300mm, µ- efficiency factor or nozzle coefficient which is a function of gating system employed commonly used as 0.2, g - acceleration due to gravity, - pouring time in seconds.
Thus, according to the equation used a single ingate area with a size of 52 cm2was found. From this area volume and weight of molten metal accumulated in the ingate section were estimated by considering density of the material (steel) as 7860Kg/m3 and found as 0.00026m3 and 2.0436 Kg respectively.
The size of runner used was determined using gating ratio design [9]rule for steel castingsin which the values given by the ABMI foundry department as 1:1.2:1.6 to ingate area: runner area: sprue exit area.So, area (size) of runner was estimated using Equation (4) as following;
(Arun) = ingatearea(Ai) x1.2 (4)
From Equation (4) above the maximum size of the runner was found as 62.4cm2 and then the actual volume and weight of the molten metal accumulated in it were estimated and found as 0.00063m3 and 4.952Kg respectively.
Similarly, the exit area (size) of the sprue, which is molten metal receiver section after passing over the dam of pouring basin, was determined using Equation (4) in which 1.2 replaced by 1.6 and found as 83.2 cm2. Hence, the exit diameter of sprue used was found as10.29cm and its entrance diameteras 11.8cm (area of 109.4cm2), which was determined from 1.15 times the exit diameter [12].The minimum height of a sprue was considered and taken equivalent to height of the mold in the cope side (300mm). The actual sprue dimensions used near to the designed values were 110mm of top diameter and 80mm of exit diameter with fillet radius 2mm. As result, a sprue with 300mm height, entrance and exit areas of sprue found as 95 cm2 and 50.27cm2 respectively.
Then mixed sand (new-sand and reclaimed sand) was rammed on the pattern using hand molding tools. The mold cavities were painted with zirconium to improve the refractoriness of the mold and to provide surface finish of castings and heated using alcohol for drying. Pressurized type gating system was designed to control turbulence flow of the melt and to reduce the
disturbance of mold in which case entrapment of air may be the cause of porosity,blow hole and other related defects. More over pressurized system has been commonly designed for ferrous metal castings particularly for steel, which turbulence flow is its peculiar character. A cylindrical shape riser was used for its convenience of design and heat saving capacity. The shrinkage of the plate was insufficient feeding of liquid metal due to the improperly designed raiser and uncontrolled parameters. External metallic chill was also constructed and placed at one end of the mold cavity to allow directional solidification resulted in obtaining of compacted casting.The clear and selected 46MnSi4 steel scrap was melted in coreless induction
furnace, where the furnace wall was built from neutral refractory material (Al2O3) and then de-slagging agent
and pure aluminium for deoxidation purpose were added to the molten metal in the furnace and to the ladle before pouring. The chemical composition of the 46MnSi4 alloying elements was inspected using
mobile spectrometer and showed that the compassion was at the required standard designed by the case industry. Pouring was performed using teapot ladle. From there it was understood that the ladle is also one of the source of defects ,especially inclusions as this type of ladle basically ha a deficiency of in filtering the slags and dross and may be is the source of air entrapment.
Pouring to the mold was done by top gating system and was observed that the type of gating system and its parameters were no properly designed and the consequence is void formation and porosity related defects.
IV.
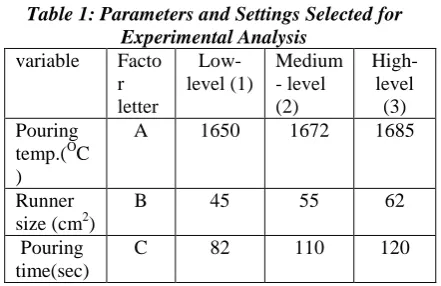
EXPERIMENTAL DATA ANALYSISThe experiment was performed by selecting three principal sand casting process parameters of trash plate castings namely pouring temperature, runner size and pouring time each with three settings, i.e., low – level, medium -level and high level values. The settings (levels of each parameter) were selected based on physical observations on defects of casting products, experiences of the foundry experts and the availability of tools and equipment in the foundry industry (Table 1).
Table 1: Parameters and Settings Selected for Experimental Analysis
variable Facto r letter
Low- level (1)
Medium - level (2)
High- level (3) Pouring
temp.(OC )
A 1650 1672 1685
Runner size (cm2)
B 45 55 62
Pouring time(sec)
ISSN: 2231-5381 http://www.ijettjournal.org
Page 403The experiment was initially designed using Taguchi L9 Orthogonal array approach and hence positions of the levels for each parameter were established using Minitab software as shown in Appendix 1 of Table 1.
Two replicates (pairs) of trash plates with same dimensions were proposed for each experiment to predict the effect or causes of the input parameters on the output castings defects and on the response variable that was length of the trash plates. The plates were cast and lengths of each plate from each experiment were measured and recorded as trials (trial1 and trial2) for each replication of the nine experiments Appendix 1 of Table 2.
The mean and standard deviation of the trials of each experiment, the performance characteristic factors of the casting process, were determined to predict the effects using equations (5) and (6) respectively [14].
Mean =∑xi /n
(5)
(6)
Where, n- number of trials of each experiment, Xi
-individual trials of each experiment and
-mean of the trials of each experiment and S- the standard deviation of each experiment. The mean and standard deviation results of each experiment estimated using the provided equations above are given in Table 2.
Table 2: Mean and standard deviations of the experimental trials
# A B C Mean St. Dev
1 1650 45 82
2308.4 4.3841
2 1650 55 110 2306.7 21.355
3 1650 62 120 2304.5 23.617
4 1672 45 110 2301.25 15.99
5 1672 55 120 2307.05 18.879
6 1672 62 82 2320.86 1.3576
7 1685 45 120 2304.45 25.668
8 1685 55 82 2326.8 8.2024
9 1685 62 110 2323.45 5.8689
On conducting the research analysis of Signal-to – Noise (SN) ratio was also considered.
The effect of each input parameter on the length variations of trash plates (under dimension- misrun) were determined using Signal –to-Noise ratio method. The SN number for the experiment was determined from the mean (
i) and the variance (Si) values of
each experiment. Since the purpose of the experiment was to cast the trash plate at optimum condition (nominal level), SN ratio of “nominal- the- better characteristic” function was chosen. Hence, SN for each trial and for each experiment was determined using Equation (7), [5, 13].
(7)
Where, and Si- mean and standard deviation of
each experiment calculated using Equations (5) and (6) respectively, SNi- Signal-to- Noise ratio of each
experiment results are shown in Table 3.
Table 3: SN ratio results of each experiment
# Exp
A B C Trial1 Trial2 SNi
1 1 1 1 2311.5 2305.3 54.4286
2 1 2 2 2321.8 2291.6 40.6699
3 1 3 3 2321.2 2287.8 39.7869
4 2 1 2 2290 2312.5 43.2059
5 2 2 3 2320.4 2293.7 41.7412
6 2 3 1 2319.9 2321.82 64.6572
7 3 1 3 2286.3 2322.6 39.0635
8 3 2 1 2332.6 2321 49.0563
9 3 3 2 2327.6 2319.3 51.951
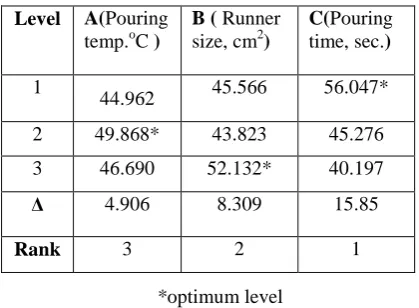
The average SN value of each factor and level was calculated from the SN ratio of each experiment (Table 3) using the following formula [5, 13]:
(8)
The range of each factor was determined in which the larger the change (Δ) value for a factor, the larger the effect the variable has on the lengths variation. Then, rank of each factor was determined using Minitab software, where the results aredisplayed in Table 4.
Table 42: Effect of each factor on response variable (trash plate length)
Level A(Pouring temp.oC )
B ( Runner size, cm2)
C(Pouring time, sec.)
1
44.962 45.566 56.047*
2 49.868* 43.823 45.276
3 46.690 52.132* 40.197
Δ 4.906 8.309 15.85
Rank 3 2 1
*optimum level
ISSN: 2231-5381 http://www.ijettjournal.org
Page 404Figure 3: Main effects plot for pouring temperature SN ratio values on trash plate length
Figure 4: Main effects plot for runner size SN ratio values on trash plate length
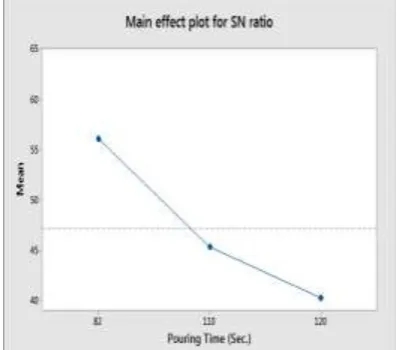
Figure 5: Main effects plot for pouring time SN ratio values on trash plate length
The main effect plots shown in Figures 3, 4 and 5 discuses that effect of the selected factors’ levels from the overall mean of SN ratio of the experiment conducted. The overall mean of the SN ratio is lying at a line of 47.1735 in the horizontal direction. Hence, pouring temperature deviated from 44.962 SN below to 49.868 SN above the mean line, pouring time deviated from 56.047 SN above to 40.197 SN below mean line and runner size deviated from 43.823 SN below to 52.132 SN above the mean line. Therefore, pouring temperature deviated by 4.906, pouring time deviated by 15.85 and runner size deviated 8.309. The deviation results of each factor predicted the effect of factor levels on response variables. As result, pouring temperature with the given levels of 1650 Oc to 1685
Oc has less effect on length variation, whereas runner
size with the given level can affect the response variable and pouring time with the given levels of 82 to 120 seconds could significantly affect the variations and needed to narrow the gap of the levels. The variations need to be minimized and produced plates under normal dimensions should satisfy the clients’ lower and upper specification limit. This can be done by identifying the critical conditions that caused the length variations. This can be achieved by selecting nominal function method that normalize the feedback (SN) and produced quality castings. Using this method the optimum level or setting of a factor which take part in the casting process and so the level that gives the highest value of SN in the experimental region was predicted. Therefore, based on the design of experiment used for the given metal weight of trash plates the optimum settings of pouring temperature, runner size and pouring time were A2, B3 and C1
corresponding to values of 1672 OC, 62cm2 and 82 seconds respectively (Table 4 and Figures 3, 4 and 5).
The Analysis of Variance (ANOVA) method was used to predict the relative effects or magnitudes of the selected input parameters on the output casting process response and expressed in a percentage. The SN ratio response of each selected parameter was determined using the following [5, 15].
SST=
(9) M =
(10)
SS due to mean = (N)x
(11)
(SST of mean) =
(12)
The effect of pouring temperature at level A
i(at
experiments i and j) was calculated as the difference of the average SN ratio for these experiments (m
Ai)
ISSN: 2231-5381 http://www.ijettjournal.org
Page 405SSA= {[(N at level A1)x (SNA1-M)2] +[(N at level
A2) x (SNA2-M) 2
] + [(N at level A3) x (SNA3-M) 2
]}
(13) DOF = number of levels -1 (14)
(MS) =
(15)
SSE=SST-(SSA+SSB+SSC)
(16)
F -ratio =
(17)
P-value = FDIST (F-ratio, DOF, DOF error) (18)
Where, SST- Sum of all the squared effects for each factor, M- Over all mean of responses (SN), N number of experiments, SSA -Sum of squares due to factor A, SNA1, SNA2 and SNA3 - average effect of factor A,
MSE- Mean Squared Error and DOF- Degrees of freedom of each factor
Thus, the ANOVA values that wasestimated using the above equations are listed in Table 5 below.
Table 5: ANOVA results of process variables table
Varia tion
d of
SS MS
F-ratio P-value
(%)
A 2 37.1
57 18.58 0.78 0.559 6.27
B 2 115.
19 57.59 2.44 0.291 19.44
C 2 393.
04
196.5
2 8.33 0.107 66.33 Error
2 47.1
72
23.58
6 7.96
Total 8
592. 57
296.2
8 0.957 100
ANOVA results of Table 5, discuss the DOF of the total sum of squares, the DOF of each factor and DOF of error of the experiment performed. Results also indicate the SST, MS MSE, F- ratio, P and Percentage contribution results of each factor selected for the experiment. The percentage contribution results of each factor of the response values factors was ranked from largest to smallest and predicted their effect. Hence, pouring time can get the larger contribution (effect) of length variation on the trash plate castings (66.33%) corresponding to the total sum of squares and has the higher influence on SN. Then runner size hadthe next largest contribution (19.44%)to the total sum of squares and pouring temperature contributed for less(6.27%) . The optimum value of SN under the optimum conditions was found to be 63.7% and trash plates produced using these settings attainedbetter quality.
Finally the optimum parameter results were analysed as per the design of experiment method used.The
optimum setting of the runner size (area) was 62.4 cm2 (factor B at high- level). Therefore, the other optimum sizes of the gating system elements were calculated from the optimum value using the provided gating ratio of Equation (4) for steel castings of that particular foundry section and given in Table 6.
Table 6: Optimum sizes of gating system elements of trash plate castings
Gating system element
Sprue Runner Ingate
Size(cm2) 83.2 62 52
Consideration of optimum results of metal flow in trash plate casting was taken place. For the measured pouring head of 50cm for the trash plate casting process, the optimum velocities, volumetric flow rate and Reynold’s number (fluid flow condition) occurred in the gating system channels were estimated and given in Table 7 below. From the analysis, it is possible to conclude that the optimum gating system elements which took part in trash plate castings were ingate size (with rectangular shape), runner size (with rectangular shape) and sprue size (with circular shape) of 52cm2, 62cm2 and 83.2 cm2 respectively.
Table7: Optimum flow results of channels used for trash plate casting
Param eter
Locations
1 2 3 4 5 6
DH (m) 0.118 0.103 0.06
79 0.06 79 0.06 12 0.06 12 Area ( 0.010 94 0.008 3 0.00 621 0.00 621 0.00 52 0.00 52 V(m/se c)
0.368 0.485 0.64 9 0.64 9 0.77 5 0.77 5 Q( ) 0.004 0 0.004 0 0.00 403 0.00 403 0.00 403 0.00 403
Re 51,38
5 59,11 3 52,1 46 52,1 46 56,1 26 56,1 26
Whereas, optimum pouring temperature of the 46MnSi4 alloy steel to reduce misrun should be 1672OC and optimum pouring time to fill the mold and gating system elements and mold cavitywas 82seconds for the trash plate castings.
V.
RESULTANDDISCUSSIONIt was observed that the trash plate cast from 46MnSi4
ISSN: 2231-5381 http://www.ijettjournal.org
Page 406casting process of the trash plate castings. As mentioned in analysis part above interview and brain storming were also carried out with the foundry experts and workers employed in the foundry shop to assess the critical casting defects occurred during the casting process of the plate. From the interview it was understood that the use of old sand with its undetermined moisture content werethe possible causes for porosity formation, the reclaimed sand proportion, which may also be the cause for sand sintering, the low controlling mechanisms of melting and solidification temperatures to gather with unskilled labour while making mold and pouring of the molten metal were also the main sources of the defects. In general lack of close control of the process and non-optimized parameter utilizations were considered main factors for trash plate defect formation. Thus avoiding these problems may result in achieving the required quality standard and obtain quality casting.
As mentioned in the analysis part gross effect was considered on the quality of casting.
The required gross weight of metal that wasobtained using the maximum yield, which wasused to completely fill the trash plate mold cavity as well as cavitiesof the gating system elementsthat wastaken part in trash plate castingwas only 1308.1Kg. As per the standard design considerations this metal weight isless to the required standard due to the fact that the plate after the cast is exposed to secondary work or finishing including machining. Grinding and polishing. Shrinkage of the mentioned steel casting is estimated to 2-2.5%. As a rule the metal weight should be 60% of the gross weight of the mold and the steel. In this case the weight of the trash plate become below the standard (about 10% less) and its consequence may be low quality product which may not be accepted by the customer and the trash plate is inferior in service. This is because weight required by client. The trash plate material was 46MnSi4 alloy
steel with the chemical composition of C: 0.459, Mn: 1.15, Si: 0.72, S: 0.030, P: 0.045 and other elements with the balance of iron. the trash plate is used in sugar industries that is applicable for roller stand and for squeezing the baggass of sugar cane in order to separate juice. Composition analysis was made using mobile spectrometer. the mold materials and additives used were mixed sand (new and reclaimed silica sand), parting sand, resin (binders) and catalyst (chemical), zirconium, dolomite powder(facing sand),alcohol, metallic paint. The de-slagging agent, pure aluminum and asbestos were also used
While analyzing the pouring time it was found that the actual filling time for the given mold and gating system cavitiescould depend on the skill of the ladle operator, surface roughness and the shape complexity of the channels used.Hence, for the given metal weight of trash plates and gating cavities, filling time
less than 82 seconds resultsin fast filling and turbulence in the gating channels and causes sand erosion of ingate section that cause misshaping of trash plate casting. On the other hand, longer filling time (above 82 sec.) caused temperature reduction of molten metal in the gating system , which led to low fluidity ,high viscosity and low velocity of filling. This is due to solidification of the melt associated with longer pouring time. Therefore, the optimum pouring time for the trash plate castingswith the given sizes wastaken as 82.As stated in the analysis part when carried out the research it was essential to design the gating system for the particular steel.
ISSN: 2231-5381 http://www.ijettjournal.org
Page 407In general the obtained optimum parameter values are recommendable to achieve sound casting of trash plate that satisfies the required quality by the customer.
CONCLUSION
The results showed that the applied methods for determination of the casting defects and the optimum settings of factors were achieved successfully and the following conclusions can be summarized as follows:
1. The numerical calculated results have been shown that themisrun, and volumetric solidification shrinkage defects occurred in the trash plate castings were due to the improper utilization of patterns of the gating system elements that resulted from less (2%) shrinkage allowance used for the alloy steel.
2. The experimental results have been shown that the most significant factors that affected on the length variations were respectively the pouring time which accounted 66.33% of the total effect, the runner size accounted 19.44% and pouring temperature was the less which accounted only 6.27%. The optimum settings of the factors have shown that the pouring time as 82 seconds, runner size as 62 cm2 and pouring temperature as 1672Oc.
REFERENCES
[1]. Roy, Basic Design of Experiments (Taguchi Approach), Nutek, Inc. Bloomfield Hills, MI, USA 2001, p 24. [2]. Stephanie Fraley, Mike Oom, Ben Terrien and John
Zalewski, Orthogonal arrays and Design of experiments via Taguchi methods, 2006, p 68.
[3]. Achamyeleh A. Kassie, and Samuel B. Assfaw, minimization of casting defects, Bahir Dar University, Bahir Dar, Ethiopia, 2278-8719 , Volume 1, 2013, PP 31-38. [4]. C. M. Choudhari, B. E. Narkhede and S. K. Mahajan,
Optimum Design and Analysis of Riser for Sand Casting, IEEE IEEM, Mumbai, India, 2013, pp 1-5.
[5]. John O. OJI, Pamtoks H. Sunday, Omolayo and M. Petinrin,Taguchi Optimization of Process Parameters on the Hardness and Impact Energy of Aluminium Alloy Sand Castings, Leonardo Journal of Sciences, 2013, PP1-12 [6]. Bhushan Shankar Kamble, Analysis of Different Sand
Casting Defects in a Medium Scale Foundry I ndustry - A
Review , IJIRSET, Vol. 5, India, 2016, PP1281-1288.
[7]. A.K.Gajbhiye, C.M.Choudhari, D.N.Raut, and
B.E.Narkhede, et al., Minimization of Shrinkage Porosity in a Sand Casting Process by Simulation in AUTOCAST-X Software with Experimental Validation by Destructive testing, IJMER, Vol. 4 Iss. 5 , Mumbai, India , 2014, pp 1-10
[8]. Ishwar P Keswani and Rasik A Upadhye Optimization of Sand Casting Process Parameter Using Taguchi Method in Foundry Vol. 1, IJERT, India, 2012, pp1-11.
[9]. Dharmendra Kumer and S.K. Jain, Foundry Technology, CBS Publishers and distributors, 1st ed., New-Delhi, 1994,
p66. [10]. Murat Tiryakioglu, D.R.Askeland and C.W.Ramsay The
Relationship Between Metal Fluidity and Optimum Pouring Times, Missouri-Rolla university, Rolla, Missouri 1993, pp 685.-691
[11]. PL Jain, Principles of Foundry Technology, 3rd ed.,
MCGRAW, Delhi, 1997, p50.
[12]. Asmamaw B, Training manual on foundry, ABMI- Ethiopia, P68. [13]. Douglas C. Montgomery, Design and analysis of
experiments, 5th edition, John Wiley and Sons, Inc. Arizona
state university, Toronto -Singapore, 2001, p183.
[14]. Thomas Pyzdek, Quality Engineering Handbook, 2nd
edition, Marcel Dekker Inc., New York • Basel, 2003, p652.
[15]. Design for Reliability and Quality, IIT Bombay, P5.
APPENDIX-1
Table 1: Field in Orthogonal array of three variables and three states using Minitab software
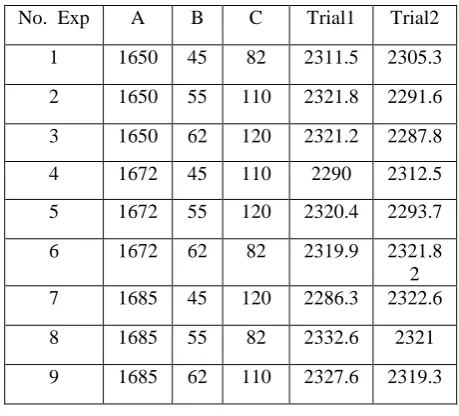
Table 2: Trials conducted in nine experiments with two replicate of each factor levels
No. Exp A B C Trial1 Trial2
1 1650 45 82 2311.5 2305.3
2 1650 55 110 2321.8 2291.6
3 1650 62 120 2321.2 2287.8
4 1672 45 110 2290 2312.5
5 1672 55 120 2320.4 2293.7
6 1672 62 82 2319.9 2321.8
2
7 1685 45 120 2286.3 2322.6
8 1685 55 82 2332.6 2321
ISSN: 2231-5381 http://www.ijettjournal.org
Page 408 Figure 1: Interaction plots of main effectsAppendix-2
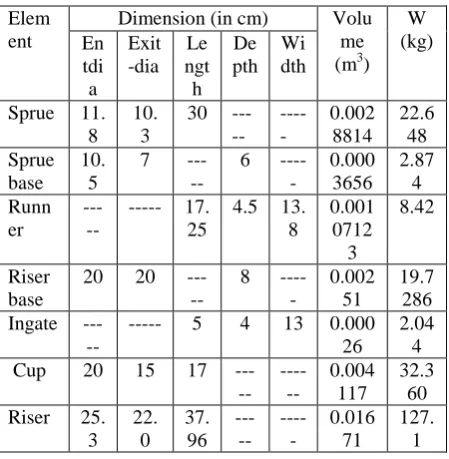
Table 1: Optimum gating system dimensions of trash plate castings
Elem ent
Dimension (in cm) Volu
me (m3)
W (kg) En
tdi a
Exit -dia
Le ngt h
De pth
Wi dth
Sprue 11. 8
10. 3
30 ---
---
0.002 8814
22.6 48 Sprue
base 10.
5
7 ---
6 ---
0.000 3656
2.87 4 Runn
er
---
--- 17. 25
4.5 13. 8
0.001 0712 3
8.42
Riser base
20 20
---
8 ---
0.002 51
19.7 286 Ingate
---
--- 5 4 13 0.000
26 2.04
4
Cup 20 15 17
---
---
0.004 117
32.3 60 Riser 25.
3 22.
0 37.
96
---
---
0.016 71