© Global Society of Scientific Research and Researchers
http://ijcjournal.org/
Development of a Myers-Briggs Type Indicator Based
Personalised E-Learning System
Olumide Sunday Adewale
a, Oluwatoyin Catherine Agbonifo
b*, Ojoma Lauretta
Osajiuba
ca,cDepartment of Computer Science, Federal University of Technology, Akure, Nigeria
bDepartment of Information Systems, Federal University of Technology, Akure, Nigeria
aEmail: [email protected] , bEmail: [email protected]
c
Email: [email protected]
Abstract
The major challenge of the traditional learning system is space-time restriction and it is teacher-centred. The emergence of Information Technology gave rise for e-learning systems which are characterized with the components of teacher-centred and one-size-fits-all strategy. Subsequently, the concept of personalisation with learning technology was introduced that provides adaptation of learning contents to learning requirements of the learners. Hence, this research paper develops a personalised e-learning system that matches teaching strategy with learners‟ learning style using Myers-Briggs Type Indicator (MBTI). The emphasis is laid on adaptive teaching strategy and revising the teaching strategy for the purpose of increasing learners‟ learning performance. The mathematical model is developed for profiling learners to determine their learning style based on the MBTI questionnaire and Dynamic Bayesian Network is applied to revise the teaching strategy. The system is implemented using PHP and Wamp server and the database is designed using Structured Query Language (SQL). The developed system is tested using Undergraduate students studying Information Technology at Federal University of Technology, Minna. The percentage analysis of the students‟ scores shows that 78% of students passed and the remaining 22% passed when the strategy was revised. The performance evaluation of the system is carried out and from the analysis it can be concluded that the Myers-Briggs Type Indicator Based Personalised E-learning System developed is appealing to students and the performance of students improved significantly.
Keywords: Myers-Briggs Type Indicator (MBTI); Personalised e-learning system; learning style; performance; assessment; teaching strategy.
---
1.Introduction
Learning is an important feature of any society. Tertiary institutions in Nigeria which is made up of universities, polytechnics and colleges of education are increasing in number at an alarming rate. Hence, the use of technology has become a necessity as the traditional educational system cannot be used to effectively implement educational policies. Educational activities in our institutions are in traditional, face-to-face lecture format which does not take into consideration individual learning preference and personality. However, a new model of instruction follows the learner-centred approach. Collaborative, Active and Personalised learning are fundamental principles to this instructional paradigm. E-learning involves the use of Internet tools to deliver and enrich students‟ learning at all times and in anyplace. The usage of technology in education released innovative opportunities for providing personalised learning to learners and meaningfully improved the potential of personalised learning. Internet offers the impeccable technology and atmosphere for individualised learning as learners can be individually identified, learning content can be personalised specifically, and learners‟ improvement can be examined, supported and assessed [1]. The main challenge of the traditional learning system is space-time constraint. Most of the learning system usually used in educational institution such as learning management systems, offer the same courses, similar in structure, composition, and content, for all learner [2]. Every individual learner has a unique learning style that forms the basis for better learning and if that is not considered it can lead to unbalanced or ineffective learning solutions. For true learning to take place, it has to be personalised and adapted to the individual learner, as personalised content is more easily assimilated by learners. Personalised learning or personalisation is a diverse variety of educational programs, instructional approaches, learning experiences, and approaches that support academics, projected to address the unique learning wants, aspirations, interests or cultural backgrounds of individual students [3]. E-learning allows the learners with the capability to adjust learning to their personality, successfully letting even a very busy person to advance in a career. The technologies to learning more exciting are always fluctuating in the world of e-learning, and course content can and should be restructured quickly to give students the very latest learning content [4]. Traditional learning is very costly, and takes longer time, e-learning offers a cheaper, faster and alternative that is potentially better. Individuals do not respond to one teaching method in similar way; while some are visual learners, and others understand better with repetitive method; some would prefer to learn on their own, while others need somebody to as a guide; some are extroverts that feel at ease talking in public, whilst others are introverts that are anxious to talk openly. E-learning reacts to those diverse needs using different tools and a variety of materials [5].
2.Literature Review
2.1 Electronic learning (E-learning)
[1] defines e-learning as the use of Internet technologies to improve students‟ learning anytime and anywhere and is part of the principal change in the way we conducts training ever since the discovery of the chalkboard or maybe the alphabet. The development of computers and electronic communications has removed the restriction of space and time. Knowledge can be acquired and delivered anytime anywhere. The development of E-learning presents new opportunities for learning and results in radical changes in education practice. The Internet and the World Wide Web specifically provide a unique platform to link learners with educational resources. Educational material that is in hypermedia format in a Web-based educational system ensures a learning that is task-driven process [6]. Folorunso and his colleagues [5] described e-learning as a form of learning that is transferred or enabled by means of electronic technology. E-learning continues to be widespread because of its ability to deliver greater convenience, self-paced learning and time flexibility to students while avoiding travel time and cost.
2.2 Personalisation and Personalised Learning
According to U.S. Department of Education [7], personalised learning refers to learning process where the learning speed and the method of instruction are optimized for individual learners needs. Instructional approaches, learning intentions, and learning content may possibly differ with regards to each learner needs. Personalised learning is commonly seen as a substitute to the “one-size-fits-all” approaches to education in which instructors make available to all students in a given course with the same instruction type, similar assignments, and the same assessments with little or no difference or adaptation from student to student. Personalised learning may also be called student-centered learning, since the overall goal is to make individual learning needs the main consideration in important educational and instructional decisions, rather than what might be more convenient, preferred, or easier for teachers and schools logistically [1].Personalised learning is all about the learner and begins with the learner. Personalised learning can also be seen as a method to learning and instruction that is designed around individual learner readiness, strengths, needs and interests. Learners are active contributors in setting goals, planning learning pathways, tracking progress and determining how learning will be achieved. At any particular time, learning content, objectives, methods and pacing are likely to differ from learner to learner as they pursue proficiency in line with established standards [8]. Personalised learning show a discrepancy in the time, place, and pace of learning for every student, enlists the student in the design of learning pathways, and uses technology to manage and record the learning process and access rich sources of information.
2.3 Learning Styles Models
learning styles.
2.3.1 Myers -Briggs type indicator learning style model
Myers Briggs type indicator (MBTI) is based on Bloom‟s Taxonomy. Several teaching methods specifically appeal to specific learner‟s assessment. There are sixteen (16) learning styles categorized in the Myers Briggs Type Indicator, which are a combination of the following four preferences: extraversion versus introversion, sensing versus intuition, thinking versus feeling, and judging versus perceptive. The Myers-Briggs Type Indicator (MBTI) was developed by Katharine Briggs and Isabel Myers and it is based on the work of C.G. Jung, a psychiatrist who studied human behaviour for many years [10]. The MBTI functions as a tool to help people understand themselves and their behaviour. It describes personality preferences rather than measuring skills or abilities and reasons that all preferences are equally important.
2.3.2 Kolb learning style inventory
Four stages of experiential learning theory form the basis of the Kolb Learning Style Inventory. According to Amah [9], Kolb and Fry identified four capabilities that lead to effective learning: concrete experience, reflective observation, abstract conceptualization and active experimentation. In stage one, concrete experience, the learner becomes involved in a new experience. In stage two, reflective observation, the learner watches others as they do something or carry out observations about an experience. In stage three, abstract conceptualization, the learner builds theories to explain the observations made earlier. Stage four, active experimentation, gives the learner opportunity to use the theories to resolve problems or make decisions.
2.3.3 Honey and Mumford's learning styles
In the late 1970s, Alan Mumford and Peter Honey studied the then relatively neglected topic of how managers learn. They started by administering Kolb's Learning Style Inventory (LSI) which was the first and for some time the only, available investigative tool for exploring how individuals learn. Because the LSI was found to have low face cogency with managers, Honey and Mumford spent four years experimenting with different methodologies to assessing individual differences in learning preferences before producing the Learning Style Questionnaire (LSQ) in 1982 [3]. Honey and Mumford defines a learning style as „a description of the attitudes and behaviour which determine an individual's preferred way of learning'. The four learning styles are described as those of reflectors, activists, pragmatists and theorists [11].
2.3.3 Herrmann Brain Dominance Instrument (HBDI)
characterized as {10]:
i. Quadrants A are Logical, analytical, quantitative, factual, and critical thinkers. They are achievement oriented and driven by performance. Engineers, Lawyers and computer scientists tend to be strong quadrant A thinkers.
ii. Quadrant B thinkers are organised, detailed and like things sequential and planned. Planners, administrators and many engineers are strong quadrant B thinkers.
iii. Quadrant C thinkers are Emotional, interpersonal, sensory, kinesthetic, and symbolic. These thinkers are the innovators who prefer brainstorming, metaphors, synthesizing, and holistic approaches to problem solving. Teachers, trainer, nurses and social workers often exhibit strong preferences in quadrant C.
iv. Quadrant D thinkers are Visual, holistic, innovative. They are often humanitarians who prefer cooperative learning and group discussion. Quadrant D thinkers often deal with possibilities, innovations and strategic planning. Entrepreneurs, playwrights, artists and scientists that carry out research and development in physics, medicine and engineering often display strong quadrant D preferences.
2.4 Emerging Learning Trends
As computer ownership increases across the globe e-learning becomes progressively more viable and accessible. Internet connection speeds are increasing, and with that, chances for more multimedia training methods arise. E-learning is developing as a popular E-learning approach exploited by many organizations. In spite of the ever increasing practices of E-learning in the workplace, most E-learning applications fail to meet learners‟ needs or serve organization‟s quests for success world [6]. With the enormous improvement of mobile networks in the past few years and the increase in telecommuting, taking all the overwhelming features of e-learning on the road is a reality with smartphones and other portable devices. Several learning trends give us a view to how e-learning and e-learning tools will be designed in the future. The eLearning industry is continuously in flux. Some trends emanate and they stay with us while others are just passing through. While it is difficult to say which trends will stay and for how long, it is always interesting to take a look at what is presently in the field [13].
2.4.1 Micro-Learning
To move away from cognitive excess in learning, and to align with trends in information processing, a period of micro learning came into existence [14]. Micro-learning emphasizes on the design of micro-learning activities through micro-steps in digital media environments, which already is a daily reality for today's knowledge workers. These activities can be incorporated into a learner's everyday routines. Micro-learning is a significant paradigm shift that eludes the need to have separate learning sessions since the learning process is deep-rooted in the daily routine of the end-user. It is also perfectly appropriate for mobile devices where long courses can be too much [13].
This encompasses the use of game thinking and game mechanics in a non-game context to involve users and solve problems. [13]Gamification for corporate learning has finally come to stay. It will continue to be a strong approach to create high impact, immersive learning. Not so much a “new” trend by any means but an often sought after part of any online training program. Gamification is predicted to be a $10 billion industry by 2020. A concept that is intrinsically connected with fun in many tech users‟ minds, games are the impeccable way to introduce learning modules to employees, helping to circumvent the threat of overpowering them or putting them off. It is almost as if learning is just a beneficial bi-product when it comes to educational games, leaving the user with a pleasant feeling of having achieved something productive while having fun [16].
2.4.3 Mobile Learning
Over the last 5 years, adoption of mobile learning has been on an increase. Flexibility to offer the courses that are multi device (they run seamlessly on desktops, laptops, tablets, and smartphones) is the single major gain. The subsequent years will see growing maturity of delivery that is completely responsive that is, the online course will adapt to the device it is being viewed on. There will be a wider acceptance of m-Learning across all training needs. Seeing as users consider mobile technology the most important, it only makes sense for digital learning to adapt it accordingly [15].
2.4.5 Mobile Apps for Learning
Mobile apps offer learning solutions that appeal to learners and involve them; usage of mobile apps for learning will escalate. They offer further flexibility to take the online course when learners do not have access to internet and can be used for both formal and informal learning. Mobile apps are increasingly being seen as the future of learning [17].
2.4.6 Social Learning
When learning is distributed or when sharing happens amongst peers, education progresses. Forums, chat boxes, note sharing help people share thoughts in a collaborative environment. Organizations will be willing to use social learning environments for experiment that are strictly meant for a collaborative workspace. Social learning is not the same as social media sharing; still people tend to consider them the same thing. Tools like Facebook or Twitter don't seem to be for skilled environments. Professional environments need more effective tools that aid in learning and not for personal information sharing. With popular LMSs providing social learning features, it is becoming practicable for organizations to use social learning for experiment. Social learning implementation will continue to increase [18].
2.4.7 Augmented Reality (AR) and Virtual Reality (VR)
ready to experiment with them. More of this will be seen in the subsequent years. Many Organizations will discover and invest in more of these technologies in 2018 and beyond [18].
3.Related works
internally by Summit‟s developers. The projects and content knowledge standards are laid out for students, this allows students to work at their own pace and make decisions about how to spend their time in the short and long term. The research work did not implement individual learners learning style to fully personalise learning the learning process [22]. Glushkova [23] developed Personalisation and user modeling in adaptive E-Learning system for schools. He researched on the need to develop a learning environment that offer a variety of teaching materials and services for different user groups such as students, parents, learners, employers, etc. motivated the researcher to carry out this work. The researcher objective is to present a model for personalizing learning system for electronic and distant learning in secondary school by application of didactic methodology, setting of educational goals and objectives, motivation of the students and his or her personal goals, plans and ambition. The implementation at the elementary level of the model is provided by Auto rules which depend on stereotypes groups and persons with the access right to portal resources. Test result is calculated and used to assign learners level. Error might occur and lead to inaccurate assignment of preference to learners. The developed system has no provision to determine if the learning style recommended for the learner is right for them in other to fully adapt learning materials to the learners in incase of inaccurate categorisation. The objective of the research by Alhawti and Abdelhamid [24] was to propose a personalised e-learning framework where learning objects are classified according to suitability for the different learning types and styles of learning. The research project addressed the requirement of personalizing learning and introduced ontology and web semantic for classifying learning objects, acquiring preference of individual learners and using the information to determine the most suitable learning objects for individual learner. The developed system has no provision to determine if the learning style recommended for the learner is right for them in other to fully adapt learning materials to the learners in incase of inaccurate categorization.
4.Methodology
4.1 System architecture
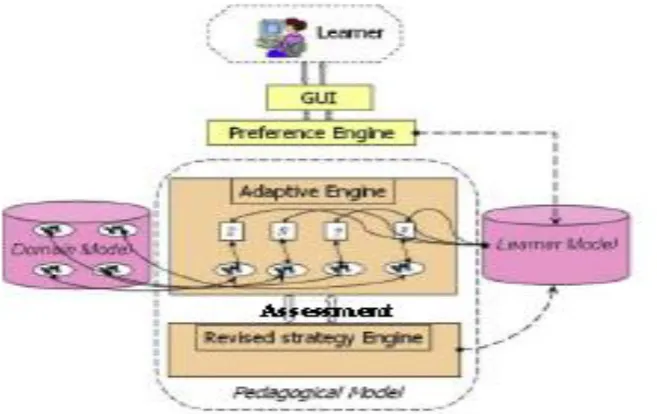
The system architecture is based on two-tier architecture as shown in Fig. 1 which consists of client layer and data layer. The client layer is the presentation model that allows users interact directly with the system while the data layer contains the domain and pedagogical models.
The system consists of four models:
i. Domain Model: The domain Model consists of learning concepts and how they with one another. It also gives an expert‟s view of content to be learnt.
ii. Learner Model: is made up of pertinent information about the learners that is important in the learning personalisation.
iii. Pedagogical Model: contains three sub-sections:
a. Adaptive Engine Model: is made up of rules that describe how the system behaves during runtime and also the way domain model interacts with the learner model to ensure personalisation.
appropriate for the learning style or not.
c. Assessment Model: consists of methods for testing learners both for categorization and performance evaluation.
iv. Presentation Model (GUI): Consists of system access model and learning Centre where the learner actually interacts with the system.
Figure
1: System Architecture4.1.1 Domain Model
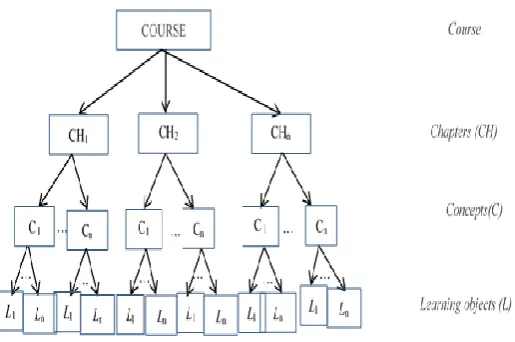
This model comprises of the information about the curriculum and its structure and it consist of networked concepts. The model is also made up of learning materials and multimedia learning materials. A chapter is represented as a tree of concepts or learning unit as shown in Fig. 2. Course (CU) is made up of chapters (CH), a chapter comprises of concepts (C) and concepts are broken down into learning objects (L). The set notation is represented as:
C ⊂ CH && CH ⊂ CU
CU= {CH1, CH2 … CHn}, CH1, CH2 … CHn ∈ CU
CH= {C1, C2…Cn}, C1, C2 … Cn∈ CH
Figure 2: Structure of the domain model
4.1.2 Learner model
This model consists of learner unique attributes that are used to adapt learning materials and the teaching styles to individual learners. Learner profile is made up of two aspects. The first consist of learner‟s bio data. The second describes his learning style according the Myers-Briggs Type Indicator (MBTI) learning style model Questionnaire (LSQ). The learner‟s profile is initialised based on the results from the student in the learning styles questionnaire. To determine which of the four learning styles a learner may prefer, questionnaire with thirty two (32) questions is presented to learners: Sensory Types (S), Intuitive Types (N), Feeling Types (F) and Thinking Types (T).A Learner‟s learning style Ls is identified based on the responses to the questionnaire xj. The learners‟ preferred learning style is determined by the highest score a learner obtained and it is analyzed from the questionnaire. The questionnaire is structured such that the learner select either yes, no or not sure to each questions. The questionnaire is grouped into four (4) categories with each category representing one of the four (4) learning styles(S, N, F, and T) represented in the equations (1)-(4).
For Sensing Types (S):
For Intuitive Types (N):
For Thinking Types (T):
4.1.3 Adaptive strategy model
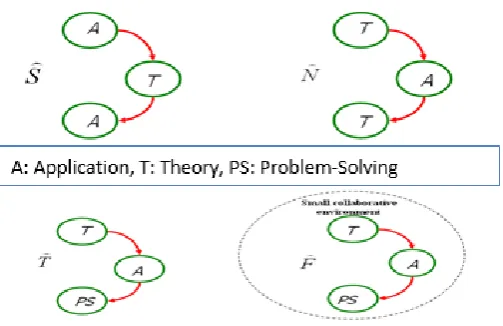
This section executes the rules for adaptation and provides a learning path to the learner. An adaptive teaching strategy will be carefully chosen based on the learner‟s style using bijective function or one-to-one mapping of the learning styles (S, N, T, and F) to their corresponding Teaching Strategy (T1, T2, T3, T4) as shown in Fig. 3:
T1: Sensing Learners prefers Application-Theory-Application (ATA). T2: Intuitive Learners prefers Theory-Application-Theory (TAT)
T3: Thinking Learners prefers Theory-Application - Problem-solving (T-A-PS).
T4: Feeling Learners also prefer Theory-Application - Problem-solving (T-A-PS) in a Collaborative Learning environment.
Figure 3: Teaching styles suggestions
4.1.4 Assessment Model
Learners‟ answers is semantically analysed and compared with pre-stored expected answers for different question structures (multiple choice questions, short answers, fill in the gap). a and b are the learners‟ answer and pre-stored expected response respectively. The words are represented in vector using vector space model and the outcome is neatly bounded in [0, 1] as in equation (5).
The cosine similarity measure is defined as in equation (6):
(6)
For k number of questions, the score would be calculated as in equation (7):
Score = (7)
Algorithm to calculate score is as below:
Start
step1: initialize Score to 0, Score=0
step2: For j=1 to k,
step3: Find θ; 0≤θ≤1
step4: Score = θ + Score
step5: j=j+1, Goto step2
step6: return Score;
end.In the assessment module, the learner is presented set of questions based on their learning style. The learner‟s performance (p) will be evaluated and grade (g) will be accorded based on assessing the learners on the learning materials recommended and the corresponding teaching strategy. Given N number of questions, the learners‟ grade g is measured as in equation (8):
g= (8)
Therefore, the performance of the learner would be evaluated as in equation (9):
(9)
Based on learner‟s performance, recommendation will be made to the learner using the rule below:
If P =„A‟: Passed, Excellently performance
If P= „B ‟: Passed, very good performance
If P= „C‟: Passed, Good performance
If P= „D‟, Relearn, study the course again and take test.
If P= „F ‟, Revise strategy, take learning style questionnaire again and Relearn
4.2 System Algorithm and Flowchart
System algorithm and flowchart are designed to show the flow of system. The design is followed to code the software for the MBTI Personalised E-Learning system using PHP as the programming language.
4.2.1 Algorithm to categorise Learners using MBTI Learning Style Model Questionnaire
Step 1: start
Step 2: Leaner create profile by signing up
Step 3: Leaners take LSQ
Step 4: Analyse response to questionnaire using Equation (1) to (4)
If highest no of yes in number 1-8, learner‟s category is Sensing type (S).
If highest no of yes in number 9-16, learner‟s category is Intuitive type (N).
If highest no of yes in number 17-24, learner‟s category is Feeling type (F).
If highest no of yes in number 25-32, learner‟s category is Thinking type (T).
Step 5: Store learners learning style in the preference engine
STEP 6: Select teaching strategy for learners based on their Learning style.
Step 7: end.
4.2.2 Algorithm to revise Teaching Strategy
Step 1: Start
Step3: Learner takes test based on the learned course
Step 4: Performance is graded using Equation (5) to (9)
STEP 5: If performance is good, Teaching Strategy is appropriate
Step 6: If performance is poor, Teaching Strategy is inappropriate.
Revise Strategy using Dynamic Bayesian Network, Change learning style
Learners teaching strategy is change according to the new learning style and new materials are recommended.
Step 7: End
4.2.3 System Flowchart
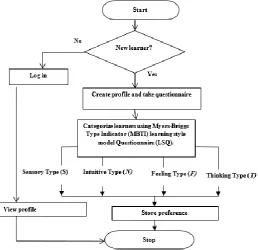
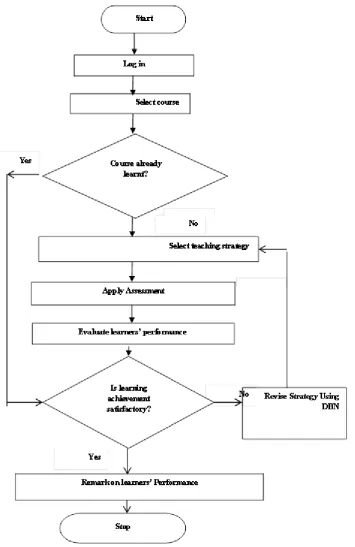
Fig. 4 and Fig. 5 give a detailed flowchart of the personalised e-learning system. Fig. 4 is the flowchart for profile creation, when a new learner approaches the system; the learner will sign up and will be required to take the MBTI questionnaire to be categorised into one of the four learning style type (Sensing, Intuitive, Feeling and Thinking). The learning style of the learner will be stored in the preference engine. For learners that have signed up before, they can view their profile. In the flowchart for learning as shown in Fig. 5, learners can log in, based on the learning style stored from the flowchart for profile creation, learning activities will be recommended to the learner. The learner will be assessed, depending on the learner‟s performance; Dynamic Bayesian network is applied to revise the teaching strategy depending on whether learning is appropriate or inappropriate.
Figure 5: Learning process flowchart
5.Results and Discussion
learning style questionnaire to determine their learning style. Based on their learning style, a corresponding teaching strategy with learning materials structured in the form of Pdf, PowerPoint, video was recommended to the learners.
The students studied the learning materials and multiple choice questions tests were used to assess the level of their knowledge on the subject matter. The student score was graded using the scale shown in Table 1 and recommendation was made based on the learning performance.
Table 1: Grading system
Score Grade Remark Recommendation
70-100 A Excellent Passed
60-69 B Very Good Passed
50-59 C Good Passed
40-49 D Fair Relearn
0-39 F Fail Revise Strategy, Change Learning Style
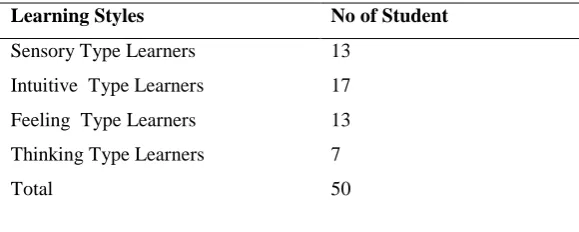
Based on the analysis of the MBTI learning style questionnaire presented to the learner, the result obtained is represented in Table 2. From the fifty (50) students that responded to the questionnaire, thirteen (13) were sensory types, seventeen (17) were intuitive types, thirteen (13) were feeling types and seven (7) were thinking types.
Table 2: Learning style categorization of respondents
Learning Styles No of Student
Sensory Type Learners 13
Intuitive Type Learners 17
Feeling Type Learners 13
Thinking Type Learners 7
Total 50
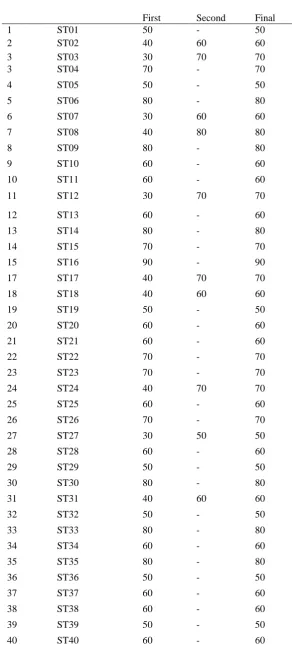
Table 3: Result of Students‟ Performance from Test
S/No Student ID Scores
First Second Final
1 ST01 50 - 50
2 ST02 40 60 60
3 ST03 30 70 70
3 ST04 70 - 70
4 ST05 50 - 50
5 ST06 80 - 80
6 ST07 30 60 60
7 ST08 40 80 80
8 ST09 80 - 80
9 ST10 60 - 60
10 ST11 60 - 60
11 ST12 30 70 70
12 ST13 60 - 60
13 ST14 80 - 80
14 ST15 70 - 70
15 ST16 90 - 90
17 ST17 40 70 70
18 ST18 40 60 60
19 ST19 50 - 50
20 ST20 60 - 60
21 ST21 60 - 60
22 ST22 70 - 70
23 ST23 70 - 70
24 ST24 40 70 70
25 ST25 60 - 60
26 ST26 70 - 70
27 ST27 30 50 50
28 ST28 60 - 60
29 ST29 50 - 50
30 ST30 80 - 80
31 ST31 40 60 60
32 ST32 50 - 50
33 ST33 80 - 80
34 ST34 60 - 60
35 ST35 80 - 80
36 ST36 50 - 50
37 ST37 60 - 60
38 ST38 60 - 60
39 ST39 50 - 50
41 ST41 60 - 60
42 ST42 60 - 60
43 ST43 50 - 50
44 ST44 30 60 60
45 ST45 70 - 70
46 ST46 60 - 60
47 ST47 70 - 70
48 ST48 60 - 60
49 ST49 60 - 60
50 ST50 80 - 80
TOTAL 2890 710 3210
5.1 Analysis based on Learning Styles
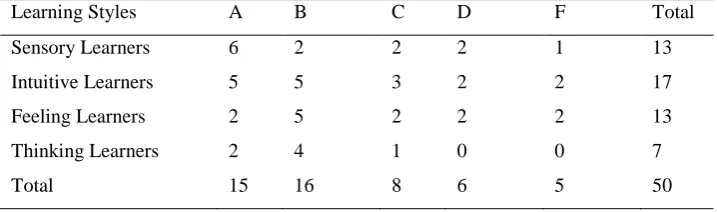
Table 4 shows learners‟ grades based on their learning style. As shown in Fig. 6, Ten (10) out of thirteen (13) sensory type learners passed, thirteen (13) out of seventeen (17) intuitive type learners passed nine (9) out of thirteen (13) feeling type learners passed and seven (7) out of the seven (7) thinking type learners passed. Fig. 6 shows that 77% of sensory type learners passed, 76% intuitive type learners passed, feeling type learners passed at first attempt with a percentage of 69% while 100% of the thinking type learners passed.
Table 4: Student‟s performance by learning styles
Learning Styles A B C D F Total
Sensory Learners 6 2 2 2 1 13
Intuitive Learners 5 5 3 2 2 17
Feeling Learners 2 5 2 2 2 13
Thinking Learners 2 4 1 0 0 7
Total 15 16 8 6 5 50
Figure 7: Percentage of Learners that passed for each Learning Style
5.2 Percentage Analysis of Students’ Performance in the First and the Second test
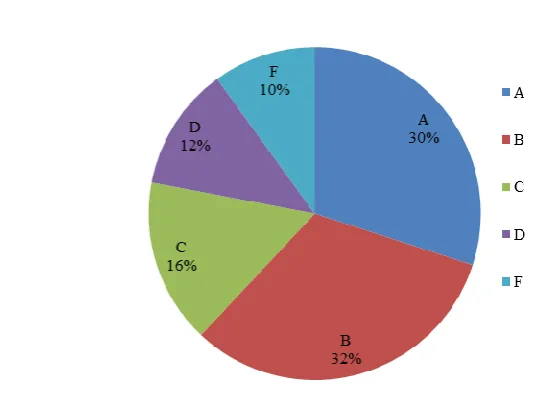
The chart in Fig. 8 shows percentage analysis of performance by grade. 30% of students passed with A, 32% passed with B and 16% passed with C. Therefore, 78% of student passed the course at first attempt which is an excellent performance, while 22% had to relearn the course. Fig. 9 shows that all the students that had to relearn the test passed. 55% of students passed with A, 36% passed with B and 9% passed with C.
Figure 9: Percentage of student‟s performance by grade in first score
5.3 System Performance Evaluation using Questionnaire
In other to evaluate the performance of the developed system, subjective evaluation was carried out. A questionnaire link was sent to the email address of the students that used the personalised e-learning system. Out of the Fifty (50) students that that used the system, Twenty seven (27) responded to the questionnaire. Table 5 shows the summary of the responses of respondents to the questionnaire.
Table 5: Summary of the response to the performance evaluation survey
Response
Questions Yes No Not
sure
Very good
Good Fair Bad Very bad 1 How would you rate the user-friendliness
of the system?
* * * 18 8 1 0 0
2 Were you able to navigate the system easily
26 1 0 * * * * *
3 Do you think the system determined the right learning style for you based on the learning style questionnaire?
18 1 8 * * * * *
4 Do you think the system recommended the right learning materials for you?
22 1 4 * * * * *
5 Did the system meet up to your expectations?
22 1 4 * * * * *
6 Would you recommend this personalised e-learning system to your friends?
24 0 3 * * * * *
7 How would you rate this personalised e-learning system?
* * * 14 12 1 0 0
system was user friendly.30% said that it is not user friendly while 4% are not sure if the system is user friendly or not. When asked to rate the system, 52% rated the system very good, 44% rated the system as good. As represented in Fig. 11, 96% of the students said that they navigated the system easily, 66% believed that the system determined the right learning style for them, while 30% are not sure. 81% of the student said they okay with the materials recommended for them and the system met up to their expectation. 86% of the students said they would recommend the learning system to their friends. From the opinion of the students that responded to the survey, it can be concluded that the MBTI based personalised e-learning system is appealing to the students. In a learning system that is learner centred, this performance is good and acceptable.
Figure 10: Summary of performance evaluation survey for question 1 and question 7
5.4 Evaluation by comparing MBTI based Personalised E-Learning System (MBTI-PELS), E-Learning
Management System (ELMS) and Adaptive E-learning Hypermedia System (AEHS-L5)
The performance evaluation of the developed system is carried out by comparing the developed system with two (2) existing system. Fifty (50) students who are currently studying Information technology in Federal University of Technology Minna were used to test the developed Myer-Briggs Type Indicator based Personalised E-Learning System (MBTI- PELS). Secondly, twenty eight (28) students system used E-E-Learning Management System (ELMS) without personalisation. And thirdly, the result of Twenty one (21) students that used an Adaptive E-Learning Hypermedia System (AEHS-LS) developed by Yasir and Sami [25].
5.4.1 Comparing MBTI-PELS with ELMS
An independent t-test assuming unequal variances is used to compare students‟ performance in MBTI-based personalised e- learning system and the e-learning management system. From the statistics results as shown in Table 6, there was a statistically significant difference between the two learning system in students‟ performance for MBTI-PELS (Mean=64.20, SD=10.32) and ELMS (Mean=46.43, SD=11.29). These results suggest that there is a highly significant impact on student performance by using the MBTI-PELS. Specifically, the results suggest that when learning process is personalised, the learning process is more effective and students perform better.
Table 6: Statistical results of T-Test on MBTI-PELS and ELMS
5.4.2 Comparing MBTI-PELS with AEHS-LS
In other to validate the performance of developed MBTI-PELS, the system is compared with AEHS-LS as shown in Table 7. The parameters obtained from the AEHS-LS result are the mean score and standard deviation of the scores of Twenty one (21) students that study introduction to programming. The T value is calculated using equation (10), where X1 and X2 are means score and S1 and S2 are the standard deviation of students‟ scores in MBTI-PELS and AEHS-LS respectively.
MBTI-PELS ELMS
Observations(N) 50 28
Mean(X) 64.2 46.43
Standard Deviation(S) 10.32 11.29
T 6.874216906
P Value 0.000000001514
Critical Value 1.99167261
Table 7: Statistical results of MBTI-PELS and AEHS-LS
From the statistics results in Table 7, there is no statistically significant difference between the two learning system in students‟ performance for MBTI-PELS (Mean=64.2, SD=10.32) and AEHS-LS (Mean=62.38, SD=10.07) but the students performed better in MBTI-PELS. Fig.12 shows the mean score of students in MBTI-PELS, ELMS and AEHS-LS.
Figure 12: Comparing mean of scores in MBTI-PELS, ELMS AND AEHS-LS
As represented in Fig. 12, Performance of students MBTI-PELS is a little bit more than AEHS-LS. The performance of students is poor in ELMS compared to MBTI-PELS and AEHS-LS which are adaptive learning system. The developed MBTI personalized e-learning better than AEHS-LS.
5.Conclusion and Future Work
In this research work, development of a personalised e-learning system is based on Myers Briggs Type Indicator with emphasis on the learners learning style. The learning style questionnaire was used to determine individual Learners learning style. The learner was categorized into four (4) learning style categories: Sensory type, Intuitive type, Feeling type and Thinking type. Fifty (50) students studying information technology in Federal University of Technology, Minna were used for test cases in this research. From percentage analysis of the students‟ scores, 78% of students passed at first attempt and when the strategy was revised, all the students passed the second time. Using T-test to compare the Myers-Briggs Type Indicator Based Personalised E-learning system with existing systems such as E-Learning Management System and adaptive E-E-learning System, it could be inferred that the system developed in this research work improved the performance of students. Further research could be done in improving this research work by providing a more intelligent system that can
MBTI-PELS AEHS-LS
Observations(N) 50 21
Mean(X) 64.2 62.38
Standard Deviation(S) 10.32 10.07
T 0.689926
P Value 0.492555
monitor the learners to determine if the learners truly studied the recommended course materials before taking the test.
6.Recommendation
The system could be used to personalise learning for learners in secondary and tertiary institutions. . In Nigeria, the existing tertiary institutions are unable to absorb the numerous prospective students through Joint Admission and Matriculation board (JAMB) admission. Just about 10% of the applicants are admitted every year form the numerous applications submitted. The developed system could be recommended as a distance learning tool to accommodate the qualified applicants that the Nigerian institutions could not absorb due to inadequate facilities and personnel. Further research could be done in improving this research work by providing a more intelligent system that can monitor the learners to determine if the learners truly studied the recommended course materials before taking the test.
Acknowledgement
The research is partly sponsored by Tertiary Education Trust Fund (TETFUND) under the National Research and Innovation Grant.
References
[1]. E. B. Essaid, A, El Hassan, and E. A. Mohamed. “E-Learning Personalisation Based On Dynamic Learners‟ Preference”. International Journal of Computer Science & Information Technology (IJCSIT), vol.3 (3), pp. 200-216, 2011.
[2]. S. Graf. (2007). “Adaptivity in learning management systems focusing on learning styles”, Ph.D. Thesis, Vienna University of technology, Austria, 2007.
[3]. O.S. Adewale. University Digital Libraries: Adaptive, personalised E-Learning System. Akure, Nigeria: Yerimah Prints, 2007.
[4]. Epignosis LLC (2014, Jan.). E-learning: concepts, trends, application. Vol 1.1. Available: www.talentlms.com /elearning. [4 Sept, 2018].
[5]. O. Folorunso, H.O.D. Longe and U. L. Ijere. “E-Learning ecosystem: prospects for distance learners in Nigeria” Proceedings of the 14th Annual Conference of Nigerian Computer Society, NCS, Vol.14, pp. 257-\261, 2003.
[6]. S.N. Shekapure and V.M. Thakare. “Review on intelligent and personalized e-learning system,” International Journal of Computer Science information and Engineering, Technologies. Vol. 3(3). Pp.1-7, 2014.
[7]. U. S. Department of Education, Office of Educational Technology, “Reimagining the Role of Technology in Education: 2017 National Education Technology Plan Update”, Washington, D.C. Jan 2017 [Jul 20, 2017].
[9]. M.N. Amah. “Modelling, design and implementation of a Web-based personalised e-learning system”. M Sc. Thesis, ABU, Zaria, Nigeria. 2011
[10]. R. M. Felder (1996, Dec.). “Matters of Style”. ASEE Prism, North Carolina [On-line]. Vol.6 (4), pp. 18-23. Available: www.ncsu.edu/felder-public/papers/LS-prism.htm. [Jul 30, 2017].
[11]. P. Honey and Mumford A. The learning styles helper‟s guide. Maidenhead: Peter Honey Publications, 2000.
[12]. M. Lumsdaine, and E. Lumsdaine “Thinking Preferences of Engineering Students: Implications for Curriculum Restructuring,” Journal of Engineering Education. Vol 84(2), pp. 193-204. 1995.
[13]. J Ferriman “ELearning: 6 Popular Trends in ELearning”. Internet: www.learndash.com/6-Popular-Trends-in-Elearning, April 25, 2016 [Jul. 21, 2018].
[14]. I. Sood. “What is microlearning? What you need know about the future of training,” Internet: https://elearningindustry.com. Oct. 7, 2018 [Dec. 10, 2018].
[15]. J Ferriman. “Mobile learning: Mobile Learning‟s upward trend”. Internet: www.learndash.com/mobile-learnings-upward-trends, April 21, 2015 [Oct. 21, 2018].
[16]. C. Jaja-Sackey. “What‟s the Future of e-Learning” London, https://www.todaytranslations.com. Aug. 11, 2017 [Oct. 8, 2018].
[17]. A. Pandey, “GAMIFICATION: An Introduction to the Usage of Gamification in Corporate Training” https://elearningindustry.com. Aug. 3, 2018[Oct. 11, 2018].
[18]. K. DN Suresh. “9 Popular Trends in Elearning Trends for 2018” Elearning trends. www.elearningelearning.com/2020/trends. Dec. 7, 2017[Oct. 4, 2018].
[19]. R. Hammad. “APMoodle: Adaptive and personalised e-Learning system,” In: IEEE Conference on Communication, Science & Information Engineering, and Proceedings of CCSIE 2011, London, and UK. 25-27 July 2011, pp. 145-150. Available: http://eprints.uwe.ac.uk /27067/ApMoodle.pdf. [May 02, 2017].
[20]. B. Diana. “Personalised e-learning software systems, extending the solution to assist visually impaired users,” Database Systems Journal, Academy of economics studies. Bucharest: Romania. Vol. 4, No.3, pp. 41-49, 2011.
[21]. A.S. Mehmet, O. Muzaffer, and Y. Cumali. “Concept Based Approach for Adaptive personalised Course Learning System, International Education Studies,” Canadian Center of Science and Education. Vol. 6, No. 5, pp. 92-103, 2013.
[22]. H. Alex. “Personalised Learning Plan (PLP),” Internet: https://www.edsurge.com/news/ apeekinsidesummitspersonalizedlearnings. Jun. 1, 2014 [Jan. 19, 2016].
[23]. T. Glushkova. “Personalisation and user modelling in adaptive Learning systems for schools,” in E-Learning instructional design, Organization strategy and management. Bulgaria: IntechOpen. pp. 127-147, 2015. Available: http://dx.doi.org/10.5772/61084.
[24]. M. Alhawti and Y. Abdelhamid. “A personalised Learning framework. Journal of Education and e-Learning Research”. Asian Online Journal Publishing Group. Vol. 4, No. 1, pp.15-21, 2017.