© Global Society of Scientific Research and Researchers
http://ijcjournal.org/
Performance Analysis of BAU Android Application using
Firebase Analytics, ADT and Dalvik Tools
Md. Rakib Hassan*
Department of Computer Science & Mathematics, Bangladesh Agricultural University, Mymensingh 2202,
Bangladesh
Email: [email protected]
Abstract
Smartphones have now become an integral part of our life. We carry our smartphone with us almost every time and use it to browse the internet, use social network, educational and other apps for different purposes. The apps in these smartphones are also getting smarter and useful in different aspects. These apps have made our life simpler by providing information at our fingertips. According to various statistics, the number of smartphone users in 2013 was 1.31 billion around the world. In 2016, it has exceeded 2 billion. Besides, 80% of the time spent on mobile devices is spent using apps, 20% in browser. This demonstrates the importance of mobile apps compared to traditional websites. In this paper, the performance analysis of an educational institute’s android application has been conducted to gain useful insights and understand the advantages of android application for any organization. The results clearly demonstrate the usefulness of mobile apps in terms of speed, reliability, security, portability and user engagement.
Keywords: Performance analysis; Android studio; Firebase analytics; DDMS; ADT.
1.Introduction
Over the last few years, mobile phones have evolved drastically and now it has become an integral part of our life due to its almost equal capabilities of a computer. Smart phones have now become an area of massive business opportunities. Because the hardware technologies of smart phones have advanced a lot with high speed internet access. The differences between computers and smartphones are also becoming less. As a result, users are engaging more time with their smartphones. The operating systems of the smartphones have also become smarter and more user-friendly.
The mobile apps of these smartphones are more productive and faster than their websites and desktop computer software versions. Thus, every organization now need an android application along with their existing software and traditional websites to increase productivity and visibility.
Besides, according to various statistics, the number of smartphone users in 2013 was 1.31 billion around the world. In 2016, it has exceeded 2 billion [1]. Besides, 80% of the time spent on mobile devices is spent using apps, 20% in browser. This demonstrates that consumers indeed want the simplicity and focus that apps provide, rather than the variety and diffusion inherent in websites. Therefore, if organizations and industries are not investing in mobile applications to increase productivity among their workforce (or making their own software products mobile-friendly), they are going to fall behind.
Therefore, in order to gain useful insights, an educational institution’s android application named BAU [2] has been analyzed in this paper using Firebase analytics, android development tools (ADT), Dalvik debug monitor server (DDMS) and allocation tracker. This analysis will provide different useful information about using an android application for an organization along with its existing websites. In the performance analysis section, it is observed that an android application can increase an organization’s user engagement, productivity, performance, speed and reliability.
2.Related Works
There is no android application for BAU other than this android application [2] at the moment. Therefore, the performance analysis of this app will reveal many insights about user engagement, performance improvements and advantages over websites and necessity of android applications compared to websites.
3.Materials and Methods
3.1. Tools Used
The software tools that were used to test and analyze the performance of BAU app are Android Studio [3,4], DDMS (Dalvik Debug Monitor Server) and Android monitor [5]. The database was created using SQLite. The hardware device used to test in real time are Samsung galaxy S7 and a laptop with Intel core i7 processor and 8 GB RAM running Windows 8.1 operating system.
3.2. Methodology
Figure 1: Different user interfaces of the app
Play Store Share Search Search results Chancellor
VC
Others News & events
Option Home Administration
Email Contacts About BAU
Faculties
Holidays Privacy policy
4.Results and Discussion
The performance of the proposed BAU android application [2] has been analyzed using different tools, such as, Firebase analytics, android development tools (ADT), Dalvik debug monitor server (DDMS) and allocation tracker. These results are presented in the following sub-sections.
4.1 Analysis of User Engagement using Firebase Analytics
Figure 2: Unique active users of BAU android app
Figure 2 shows the active users plotted over time in firebase console [6] which include daily, weekly and monthly active users from July-2016 to June-2017. The values on the right show the number of active users of the last day of the date range [7]. For example, the monthly value implies the number of unique users in June 2017, the weekly value indicate the number of unique users in the last week of June 2017 and the daily value is the number of users on the last day of June 2017. The number of daily unique users was highest on 26-June-2017. This figure clearly shows that the number of unique users is steadily increasing every month.
Figure 3 shows the app versions and the number of unique users using it from July 2016 to June 2017. The figure in the right shows the value of the unique users in the last day of June 2016. On 26-June-2017, the number of unique users using app version 1.2.9 was 161. This figure indicates that the users are gradually upgrading their apps to the latest version.
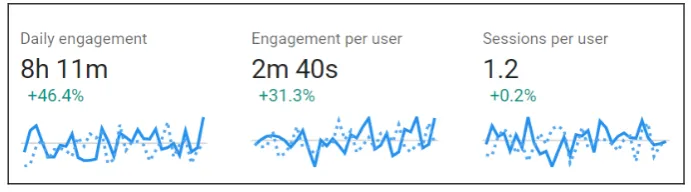
Figure 4: User engagement
The time spent in the BAU app by the users is shown in Figure 4. The daily engagement with the app is around 8 hours daily and each user spends more than 2 minutes in the app on average. Sessions per user indicates the average number of times the app was used daily by the users. The percentage value indicates that the time spent in the app is increasing significantly.
Figure 5: Cohort retention of users
Cohort retention of users using the app is shown in Figure 5 where cohort means a group of people with a common element and retention means how many of them use it again [8]. It is used to identify the interest of the customers in using the app again after installing in for the first time [9].
Figure 6: Country-wise app distribution
Country-wise distribution of BAU app is shown in Figure 6. It shows that 98% users of the app are from Bangladesh. The remaining 2% of the users are from USA, South Korea, India, Japan, Singapore, Netherlands, China, Germany and other countries.
Figure 7: Percentage of users based on gender
Figure 8: Percentage of users based on age
Among the users of the app, around 80% are male and 20% are female, which is shown in Figure 7. The percentage of users based on age in shown in Figure 8.
Figure 9: Memory usage graph
Memory usage of the app is shown in Figure 9 using Android Studio’s android monitor tool [10]. The figure shows that the app is highly memory efficient because it takes only around 40 MB of the RAM to run its views and database contents compared to 1GB of RAM usage of other popular apps like Facebook [11].
Figure 10: CPU usage analysis
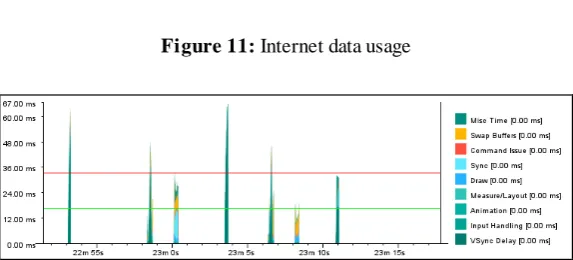
CPU usage of BAU app is shown in Figure 10. The user of the app uses only around 1% of the CPU resource whereas the app itself is using close to 0% of CPU. This shows the efficiency of this app in terms of CPU usage. The app does not use any internet unless it visits the websites (e.g., BAU, TTO, BAURES, etc.) which is shown in Figure 11. Because 95% of the contents of BAU app works offline. As a result, it does not consume any internet data to view the contacts and their details along with other information.
Figure 11: Internet data usage
In case of frequent screen changes, the GPU (Graphics Processing Unit) is used in terms of few milliseconds as shown in Figure 12. This is also very efficient in terms of various apps which are more than 500 milliseconds.
4.3 Comparison with BAU website
BAU android application [2] has been compared with the BAU website [12]. Few limitations were found in the existing BAU website. First, this website is not mobile friendly which means that this website cannot be browsed properly from smartphones. It requires laptop or desktop computer to browse this website fully. Second, any website requires internet. Third, websites can be hacked if they are not properly developed. Fourth, web-servers can be down anytime hosting the websites. On the other hand, android applications in general have few advantages compared to websites. First, they are already mobile friendly. Second, the BAU app does not require internet for most of its contents. Third, apps downloaded from Google play store cannot be easily hacked. Fourth, the app runs in the user’s smartphone. As a result, the app is independent of the server down issue of websites. The speed of the app is also faster than the website. Because, website requires internet and the speed depends on the internet bandwidth. On the other hand, BAU android application has its contents in the user’s device. As a result, the speed does not depend on the internet and thus it is faster than websites. Therefore, an organization not only requires a website but also an android application to increase impact and visibility.
4.4 Constraints and Limitations
As mentioned in Section 3.1, the application was tested on Samsung Galaxy S7 and emulator of the android studio IDE (Integrated Development Environment). It would be more realistic if more physical devices with different configurations could be used.
4.5 Recommendations
It can be observed from Figure 3 that most of the users are using the older version of the app. To get the latest features and information, the users should regularly update the app. As a result, the apps will have current information with latest features and improved performance.
5.Conclusion
References
[1] “Smartphone users worldwide 2014-2020.” [Online]. Available: https://www.statista.com/statistics/330695/number-of-smartphone-users-worldwide/. [Accessed: 14-Jul-2017].
[2] “BAU Android Application.” [Online]. Available: https://play.google.com/store/apps/details?id=com.rayyanapps.android.bauapp. [Accessed:
14-Jul-2017].
[3] M. Van Drongelen, Android studio cookbook : design, debug, and test your apps using Android Studio. [4] “Android Studio.” [Online]. Available: https://developer.android.com/studio/index.html. [Accessed:
10-Jul-2017].
[5] M. Wolfson, Android Developer Tools Essentials: Working with Layout Tools, DDMS, AVD, and ADT. O’Reilly Media, Inc, USA, 2013.
[6] “Firebase console.” [Online]. Available: https://console.firebase.google.com/u/0/. [Accessed: 08-Jul-2017].
[7] “Firebase Metrics.” [Online]. Available: https://support.google.com/firebase/answer/6317517?authuser=0#active-users. [Accessed:
08-Jul-2017].
[8] “What is A Cohort Report and Why Is It Valuable?” [Online]. Available: http://www.evergage.com/blog/what-cohort-reporting/. [Accessed: 09-Jul-2017].
[9] F. R. Dwyer, “Customer Lifetime Valuation to Support Decision Making,” Journal of Direct Marketing, vol. 11, no. 4. pp. 6–13, 1989.
[10] B. Zapata and A. Niñirola, Testing and Securing Android Studio Applications. 2014.
[11] “Why does Facebook use so much RAM?” [Online]. Available: https://www.quora.com/Why-does-Facebook-use-so-much-RAM. [Accessed: 10-Jul-2017].

![Figure 2 shows the active users plotted over time in firebase console [6] which include daily, weekly and monthly active users from July-2016 to June-2017](https://thumb-us.123doks.com/thumbv2/123dok_us/8398728.1685692/4.595.146.452.555.726/figure-active-plotted-firebase-console-include-weekly-monthly.webp)