360 | P a g e
A STUDY OF CLUSTERING AND CLASSIFICATION
TECHNIQUES INVOLVED IN DATA MINING
Gagandeep Kaur
1, Dr.Gagandeep Jagdev
21
Research Scholar, M.Tech. (CE), Yadavindra College of Engineering, Talwandi Sabo (PB).
2Faculty, Dept. of Comp. Science, Punjabi University Guru Kashi College, Damdama Sahib
ABSTRACT
Information Industry is generating enormous amount of data. This data needs to be converted into useful
information to obtain fruitful results. Data mining is not restricted to extraction of information. It also
comprises of Data Cleaning, Data Integration, Data Transformation, Data Mining, Pattern Evaluation and
Data Presentation. After completion of all these processes, information obtained can be used for Fraud
Detection, Market Analysis, Production Control, Science Exploration, etc. The central theme of this research
paper is to elaborate different clustering and classification techniques involved in data mining.
Index Terms – Classification, Clustering, Data mining, DBSCAN, k-means.
I. INTRODUCTION
Data mining refers to patterns that can be mined. Based on kind of data to be mined, data mining is classified
into two different categories of Descriptive function and Classification and Prediction [1, 2].
A.
Descriptive Function
Descriptive function primarily deals with general properties of data in the database and are mentioned as under.
Class/Concept Description - Class/Concept refers to data related with classes and concepts. These descriptions can
be derived by the following two ways:
Data Characterization refers to summarizing data of class under study. This class is referred as Target Class. Data Discrimination refers to the mapping of a class with some predefined group or class.
Mining concerned with Frequent Patterns– Patterns those occur frequently in transactional data are referred as frequent
patterns. Different frequent patterns are mentioned as under.
Frequent Item Set refers to a set of items that frequently appear together, for instance, milk and bread. Frequent Subsequence refers to sequence of patterns that occur frequently such as purchasing a camera is
followed by memory card.
Frequent Sub Structure refers to different structural forms, such as graphs, trees, or lattices, which may be
361 | P a g e Mining in relevance with Association - Associations finds it use in retail sales to identify patterns that are frequently
purchased together. This process refers to the process of uncovering the relationship among data and
determining association rules.For example, a retailer generates an association rule that points out that 70% of
time milk is sold with bread as compared to 30% of times biscuits are sold with bread.
Mining in relevance with Correlation - It is a kind of supplementary analysis performed to expose interesting
statistical correlations between associated attribute-value pairs or between two item sets to reach a conclusion
that if they have positive, negative or no effect on each other.
Mining of Clusters - Cluster refers to a group of similar kind of objects. Cluster analysis refers to forming group of
objects that are very similar to each other but are highly different from the objects in other clusters.
B.
Classification and Prediction
Classification is the process of finding a model that describes the data classes or concepts. The purpose is to be
able to use this model to predict the class of objects whose class label is unknown. This derived model is based
on the analysis of sets of training data. The derived model can be presented in different forms mentioned as
under [7].
Classification − It predicts the class of objects whose class label is unknown. Its objective is to find a derived
model that describes and distinguishes data classes or concepts. The Derived Model is based on the analysis set
of training data i.e. the data object whose class label is well known.
Prediction − It is used to predict missing or unavailable numerical data values rather than class labels.
Regression Analysis is generally used for prediction. Prediction can also be used for identification of
distribution trends based on available data.
Outlier Analysis − Outliers may be defined as the data objects that do not comply with the general behavior or
model of the data available.
Evolution Analysis − Evolution analysis refers to the description and model regularities or trends for objects
whose behavior changes over time.
II. COMPONENTS OF DATA MINING
With an enormous amount of data stored in databases and data warehouses, it is increasingly important to
develop powerful tools for analysis of such data and mining interesting knowledge from it. Data mining is a
process of inferring knowledge from such huge data. Data Mining has three major components
Clustering or Classification
Association Rules
Sequence Analysis.
By simple definition, in classification/clustering one analyzes a set of data and generate a set of grouping rules
which can be used to classify future data. For example, one may classify diseases and provide the symptoms
which describe each class or subclass. This has much in common with traditional work in statistics and machine
learning. However, there are important new issues which arise because of the sheer size of the data. One of the
362 | P a g e given data into predefined classes. In the data mining domain where millions of records and a large number of
attributes are involved, the execution time of existing algorithms can become prohibitive, particularly in
interactive applications [3, 6].
An association rule is a rule which implies certain association relationships among a set of objects in a database.
In thisprocess, one discovers a set of association rules at multiple levels of abstraction from the relevant set(s)
of data in a database. For example, one may discover a set of symptoms often occurring together with certain
kinds of diseases and further study the reasons behind them. Since finding interesting association rules in
databases may disclose some useful patterns for decision support, selective marketing, financial forecast,
medical diagnosis, and many other applications, it has attracted a lot of attention in recent data mining research.
Mining association rules may require iterative scanning of large transaction or relational databases which is
quite costly in processing. Therefore, efficient mining of association rules in transaction and/or relational
databases has been studied substantially.
In sequential Analysis, one seeks to discover patterns that occur in sequence. This deals with data that appear in
separate transactions (as opposed to data that appear in the same transaction in the case of association). For e.g.:
If a shopper buys item A in the first week of the month, then he buys item B in the second week etc.
III. CLUSTERING IN DATA MINING
Cluster is a group of objects that belongs to the same class. In other words, similar objects are grouped in one
cluster and dissimilar objects are grouped in another cluster.Clustering is the process of making a group of
abstract objects into classes of similar objects.A cluster of data objects can be treated as one group.While doing
cluster analysis, we first partition the set of data into groups based on data similarity and then assign the labels
to the groups.The main advantage of clustering over classification is that, it is adaptable to changes and helps
single out useful features that distinguish different groups.
A.
Applications of Cluster Analysis
Clustering analysis is utilized in many applications such as market research, pattern recognition, data
analysis, and image processing.
Clustering can also help marketers discover distinct groups in their customer base. And they can characterize
their customer groups based on the purchasing patterns.
In the field of biology, it can be used to derive plant and animal taxonomies, categorize genes with similar
functionalities and gain insight into structures inherent to populations.
Clustering also helps in identification of areas of similar land use in an earth observation database. It also
helps in the identification of groups of houses in a city according to house type, value, and geographic
location.
Clustering also helps in classifying documents on the web for information discovery. Clustering is also used in outlier detection applications such as detection of credit card fraud.
As a data mining function, cluster analysis serves as a tool to gain insight into the distribution of data to
363 | P a g e
B.
Requirements of Clustering in Data Mining
The following points throw light on why clustering is required in data mining −
Scalability − We need highly scalable clustering algorithms to deal with large databases.
Ability to deal with different kinds of attributes − Algorithms should be capable to be applied on any kind of
data such as interval-based (numerical) data, categorical, and binary data.
Discovery of clusters with attribute shape − The clustering algorithm should be capable of detecting clusters
of arbitrary shape. They should not be bounded to only distance measures that tend to find spherical cluster of
small sizes.
High dimensionality − The clustering algorithm should not only be able to handle low-dimensional data but
also the high dimensional space.
Ability to deal with noisy data − Databases contain noisy, missing or erroneous data. Some algorithms are
sensitive to such data and may lead to poor quality clusters.
Interpretability − The clustering results should be interpretable, comprehensible, and usable.
IV. CLUSTERING METHODS
Different Clustering methods can be classified as under.
A.
Partitioning Method
Suppose we are given a database of ‘n’ objects and the partitioning method constructs ‘k’ partition of data. Each partition will represent a cluster and k ≤ n. It means that it will classify the data into k groups. Each group
contains at least one object.Each object must belong to exactly one group.For a given number of partitions (say
k), the partitioning method will create an initial partitioning.Then it uses the iterative relocation technique to
improve the partitioning by moving objects from one group to other.
B.
Hierarchical Method
This method creates a hierarchical decomposition of the given set of data objects. We can classify hierarchical
methods on the basis of how the hierarchical decomposition is formed. The two approaches involved are as
under.
Agglomerative Approach - This approach is also known as the bottom-up approach. In this, we start with each
object forming a separate group. It keeps on merging the objects or groups that are close to one another. It
keeps on doing so until all of the groups are merged into one or until the termination condition holds.
Divisive Approach - This approach is also known as the top-down approach. In this, we start with all of the
objects in the same cluster. In the continuous iteration, a cluster is split up into smaller clusters. It is down until
each object in one cluster or the termination condition holds. This method is rigid, i.e., once a merging or
364 | P a g e
Density-based Method
This method is based on the notion of density. The basic idea is to continue growing the given cluster as long
as the density in the neighborhood exceeds some threshold, i.e., for each data point within a given cluster, the
radius of a given cluster has to contain at least a minimum number of points.
C.
Grid-based Method
In this, the objects together form a grid. The object space is quantized into finite number of cells that form a
grid structure.The major advantage of this method is fast processing time.It is dependent only on the number of
cells in each dimension in the quantized space.
D.
Model-based methods
In this method, a model is hypothesized for each cluster to find the best fit of data for a given model. This
method locates the clusters by clustering the density function. It reflects spatial distribution of the data points.
This method also provides a way to automatically determine the number of clusters based on standard
statistics, taking outlier or noise into account. It therefore yields robust clustering methods.
E.
Constraint-based Method
In this method, the clustering is performed by the incorporation of user or application-oriented constraints. A
constraint refers to the user expectation or the properties of desired clustering results. Constraints provide us
with an interactive way of communication with the clustering process. Constraints can be specified by the user
or the application requirement.
V. CLUSTERING ALGORITHMS
DBSCAN
DBSCAN (for density-based spatial clustering of applications with noise) is a data clustering algorithm
proposed by Martin Ester, Hans-Peter Kriegel, Jorge Sander and Xiaowei Xu in 1996 It is a density-based
clustering algorithm because it finds a number of clusters starting from the estimated density distribution of
corresponding nodes. DBSCAN [3] is one of the most common clustering algorithms and also most cited in
scientific literature[3, 4].
The DBSCAN algorithm can identify clusters in large spatial data sets by looking at the local density of
database elements, using only one input parameter. Furthermore, the user gets a suggestion on which parameter
value that would be suitable. Therefore, minimal knowledge of the domain is required. The DBSCAN can also
determine what information should be classified as noise or outliers. In spite of this, it’s working process is
quick and scales very well with the size of the database – almost linearly.By using the density distribution of
nodes in the database, DBSCAN can categorize these nodes intoseparate clusters that define the different
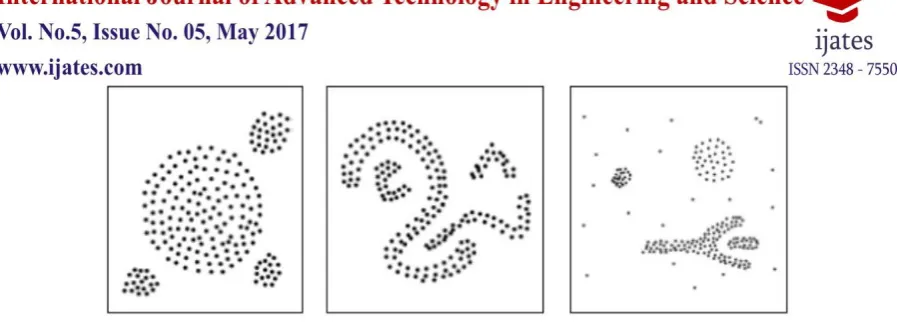
classes. DBSCAN can find clusters of arbitrary shape, as can be seen in Fig. 1. However, clusters that lie close
365 | P a g e Fig. 1 Figure depicts clusters of arbitrary shape
Applications
Satellites images
A lot of data is received from satellites all around the world and this data have to be translated
intocomprehensible information, for instance, classifying areas of the satellite-taken images according toforest,
water and mountains. Before the DBSCAN algorithm can classify these three elements in thedatabase, some
work has to be done with image processing. Once the image processing is done, the data appears as spatial data
where the DBSCAN can classify the clusters as desired [5].
X-ray crystallography
X-ray crystallography is another practical application that locates all atoms within a crystal, which resultsin a
large amount of data. The DBSCAN algorithm can be used to find and classify the atoms in the data.
Anomaly Detection in Temperature Data
This kind of application focuses on pattern anomalies in data, which is important in several cases, e.g.credit
fraud, health condition etc. This application measures anomalies in temperatures, which isrelevant due to the
environmental changes (global warming). It can also discover equipment errors and soforth. These unusual
patterns need to be detected and examined to get control over the situation. TheDBSCAN algorithm has the
capability to discover such patterns in the data [5].
k-Means Algorithm
K-means clustering [4, 5] is a type of unsupervised learning, which is used when you have unlabeled
data (i.e., data without defined categories or groups). The goal of this algorithm is to find groups in the
data, with the number of groups represented by the variable K. The algorithm works iteratively to assign
each data point to one of K groups based on the features that are provided. Data points are clustered
based on feature similarity. The results of the K-means clustering algorithm are:
1. The centroids of the K clusters, which can be used to label new data.
2. Labels for the training data (each data point is assigned to a single cluster)
Rather than defining groups before looking at the data, clustering allows you to find and analyze the
groups that have formed organically. Each centroid of a cluster is a collection of feature values which
define the resulting groups. Examining the centroid feature weights can be used to qualitatively interpret
what kind of group each cluster represents.
366 | P a g e 1. Place K points into the space represented by the objects that are being clustered. These points represent
initial group centroids.
2. Assign each object to the group that has the closest centroid.
3. When all objects have been assigned, recalculate the positions of the K centroids.
4. Repeat Steps 2 and 3 until the centroids no longer move. This produces a separation of the objects into
groups from which the metric to be minimized can be calculated.
The K-means clustering algorithm is used to find groups which have not been explicit ly labeled in the
data. This can be used to confirm business assumptions about what types of groups exist or to identify
unknown groups in complex data sets. Once the algorithm has been run and the groups are defined, any
new data can be easily assigned to the correct group [4, 8].
This is a versatile algorithm that can be used for any type of grouping. Some examples of use cases are:
Behavioral segmentation:
Segment by purchase history
Segment by activities on application, website, or platform
Define personas based on interests
Create profiles based on activity monitoring
Inventory categorization:
Group inventory by sales activity
Group inventory by manufacturing metrics
Sorting sensor measurements:
Detect activity types in motion sensors
Group images
Separate audio
Identify groups in health monitoring
Detecting bots or anomalies:
Separate valid activity groups from bots
Group valid activity to clean up outlier detection
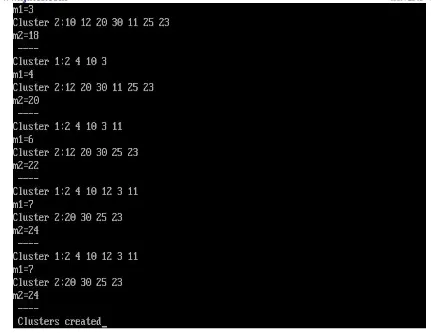
The K-Means algorithm has been implemented in C++. The snapshots in Fig. 2 show an example in which 10
369 | P a g e Fig. 2 Snapshots depicting working of K-Means algorithm
Advantages
Fast, robust and easier to understand.
Relatively efficient: O(tknd), where n is # objects, k is # clusters, d is # dimension of each object,
and t is # iterations. Normally, k, t, d << n.
Gives best result when data set are distinct or well separated from each other.
370 | P a g e Disadvantages
The learning algorithm requires apriori specification of the number of cluster centers.
The use of Exclusive Assignment - If there are two highly overlapping data then k-means will not be able to
resolve that there are two clusters.
The learning algorithm is not invariant to non-linear transformations i.e. with different representation of data
we get different results (data represented in form of cartesian co-ordinates and polar co-ordinates will give
different results).
Euclidean distance measures can unequally weight underlying factors.
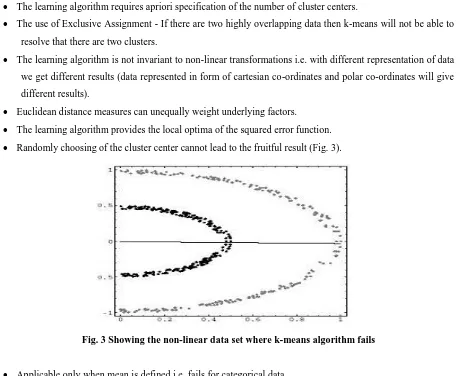
The learning algorithm provides the local optima of the squared error function. Randomly choosing of the cluster center cannot lead to the fruitful result (Fig. 3).
Fig. 3 Showing the non-linear data set where k-means algorithm fails
Applicable only when mean is defined i.e. fails for categorical data. Unable to handle noisy data and outliers.
Algorithm fails for non-linear data set.
VI. CONCLUSION
Data mining is not all about the tools or database software that you are using. One can perform data mining with
comparatively modest database systems and simple tools, including creating and writing your own, or using off
the shelf software packages. Complex data mining benefits from the past experience and algorithms defined
with existing software and packages, with certain tools gaining a greater affinity or reputation with different
techniques. A well-planned data classification system makes essential data easy to find and retrieve. This can be
of particular importance for risk management, legal discovery, and compliance. Written procedures and
guidelines for data classification should define what categories and criteria the organization will use to classify
data and specify the roles and responsibilities of employees within the organization regarding data stewardship.
371 | P a g e practices for each category and storage standards that define the data's lifecycle requirements should be
addressed. To be effective, a classification scheme should be simple enough that all employees can execute it
properly.The research paper was focused on analyzing classification and clustering involved in data mining. The
paper elaborately explained the working of two clustering algorithms DBSCAN and k-Means.
REFERENCES
[1] Singh Vijendra. Efficient Clustering For High Dimensional Data:Subspace Based Clustering and Density
Based Clustering, Information Technology Journal; 2011, 10(6), pp. 1092-1105.
[2] Anomaly Detection in Temperature Data Using DBSCAN Algorithm:Erciyes
Univeristy,http://ieeexplore.ieee.org/xpls/abs_all.jsp?arnumber=5946052&tag=1Mete Celic,
FilizDadaser-Celic, Ahmet Sakir DOKUZ.
[3] https://home.deib.polimi.it/matteucc/Clustering/tutorial_html/kmeans.html
[4]
https://www.datascience.com/blog/introduction-to-k-means-clustering-algorithm-learn-data-science-tutorials
[5] https://sites.google.com/site/dataclusteringalgorithms/k-means-clustering-algorithm
[6] Narendra Sharma, AmanBajpai, Mr. RatneshLitoriya ―Comparison the various clustering algorithms of
weka tools‖, International Journal of Emerging Technology and Advanced Engineering, Volume 2, Issue 5,
May 2012.
[7] SlavaKisilevich, Florian Mansmann, Daniel Keim ―P-DBSCAN: A density based clustering algorithm for
exploration and analysis of attractive areas using collections of geo-tagged photos, University of Konstanz.
[8] Fei Shao, Yanjiao Cao ―A New Real-time Clustering Algorithm‖,Department of Computer Science and
Technology, Chongqing University of Technology Chongqing 400050, China.
ABOUT THE AUTHOR
Dr. Gagandeep Jagdev is working in the capacity of faculty member in Dept. of Computer Science, Punjabi
University Campus, Damdama Sahib (PB). His total teaching experience is above 10 years and has above 105
international and national publications in reputed journals and conferences to his credit. He is also a member of
editorial board and advisory board of several reputed international peer reviewed journals and Technical
Committee Member of many reputed universities. His areas of interest are Big Data, Data Mining, RFID,