www.atmos-meas-tech.net/10/1465/2017/ doi:10.5194/amt-10-1465-2017
© Author(s) 2017. CC Attribution 3.0 License.
Development of a portable cavity-enhanced absorption
spectrometer for the measurement of ambient NO
3
and
N
2
O
5
: experimental setup, lab characterizations, and
field applications in a polluted urban environment
Haichao Wang1, Jun Chen2, and Keding Lu1
1State Key Joint Laboratory of Environmental Simulation and Pollution Control, College of Environmental Sciences and Engineering, Peking University, Beijing, China
2College of Energy and Power Engineering, University of Shanghai for Science and Technology, Shanghai, China
Correspondence to:Keding Lu ([email protected])
Received: 27 September 2016 – Discussion started: 10 October 2016
Revised: 26 March 2017 – Accepted: 28 March 2017 – Published: 19 April 2017
Abstract.A small and portable incoherent broadband cavity-enhanced absorption spectrometer (IBBCEAS) for NO3and N2O5measurement has been developed. The instrument fea-tures a mechanically aligned non-adjustable optical mount-ing system, and the novel design of the optical mountmount-ing system enables a fast setup and stable operation in field ap-plications. To remove the influence of the strong nonlinear absorption by water vapour, a dynamic reference spectrum through NO titration is used for the spectrum analysis. The wall loss effects of the sample system were extensively stud-ied, and the total transmission efficiencies were determined to be 85 and 55 % for N2O5and NO3, respectively, for our experimental setup. The limit of detection (LOD) was esti-mated to be 2.4 pptv (1σ ) and 2.7 pptv (1σ ) at 1 s intervals for NO3and N2O5, respectively. The associated uncertainty of the field measurement was estimated to be 19 % for NO3 and 22–36 % for N2O5measurements from the uncertainties of transmission efficiency, absorption cross section, effec-tive cavity length, and mirror reflectivity. The instrument was successfully deployed in two comprehensive field campaigns conducted in the winter and summer of 2016 in Beijing. Up to 1.0 ppb NO3+N2O5 was observed with the presence of high aerosol loadings, which indicates an active night-time chemistry in Beijing.
1 Introduction
The nitrate radical (NO3) and dinitrogen pentoxide (N2O5)
NO2+O3→NO3, (R1)
NO3+VOCs→ products, (R2)
NO3+NO→2NO2, (R3)
NO2+NO3+M→N2O5+M, (R4a)
N2O5+M→NO2+NO3+M, (R4b)
N2O5+(H2O or Cl−)→(2−φ)NO−3 +φClNO2. (R5) NO3 is a radical with a short lifetime, high reactivity, and an extremely low mixing ratio in ambient air (Wayne et al., 1991), which means that field-deployable NO3measurement techniques should feature high sensitivity, high selectivity, and high temporal and spatial resolutions. The requests are less rigorous for detection of N2O5, since, in general, it has higher concentrations and less reactivity than NO3.
There are several existing methods based on optical spec-troscopy and mass spectrometry for the in situ detection of NO3and N2O5. With respect to the optical approaches, NO3 detection is based on its strong absorption around 662 nm (Yokelson et al., 1994), and N2O5can be measured follow-ing thermal dissociation to NO3. Since the 2000s, cavity ring-down spectroscopy (CRDS) has been used in the field mea-surement of both NO3and N2O5(Simpson, 2003; Brown et al., 2002; Dubé et al., 2006; Nakayama et al., 2008; Schuster et al., 2009). CRDS has high temporal and spatial resolu-tion with high sensitivity and accuracy. Cavity-enhanced ab-sorption spectroscopy (CEAS) was proposed later by Fiedler et al. (2003) and has been successfully deployed to measure a number of atmospheric trace gas compounds like HONO, H2O, IO, O3, O4, I2, IO, OIO, SO2, NO3, N2O5, glyoxal (CHOCHO), and methylgloxal (CH3COCHO; Washenfelder et al., 2008, 2013, 2016; Thalman and Volkamer, 2010; Gher-man et al., 2008; Axson et al., 2011; Kahan et al., 2012; Min et al., 2016). The measurement of NO3was shown to be suc-cessful in simulation chamber conditions with an open-path incoherent broadband CEAS setup (Venables et al., 2006; Varma et al., 2009), and shortly afterwards, the closed cavity type of IBBCEAS was successfully deployed on the ground (Langridge et al., 2008; Benton et al., 2010) and airborne (Kennedy et al., 2011) for measurements of both NO3and N2O5. According to comparison experiments at the SAPHIR chamber (Fuchs et al., 2012; Dorn et al., 2013), the CEAS technique shows a similar detection capability for N2O5and NO3to that of CRDS (e.g. Brown et al., 2003b, 2006; Ben-ton et al., 2010; Kennedy et al., 2011; Crowley et al., 2010; Sobanski et al., 2016). For the laser-induced fluorescence (LIF), its detection sensitivity is, in general, smaller than that of the cavity-assisted absorption techniques due to the low fluorescence quantum yield of NO3(Matsumoto et al., 2005). In addition to optical approaches, different chemical ioniza-tion mass spectrometry (CIMS) methods have been used for the detection of ambient N2O5(Slusher et al., 2004; Fortner et al., 2004; Kercher et al., 2009; Chang et al., 2011). Slusher
et al. (2004) utilized ion reaction (I−+N2O5→NO−3) to detect N2O5 at 62 amu (NO−3). Nevertheless, this approach showed cross sensitivity towards NO3 (I−+NO3→NO−3)
and additional interference from species like ClONO2 and BrONO2. A strong unknown interference at 62 amu was found for the detection of N2O5under a high-NOxregime in Hong Kong (Wang et al., 2014). Kercher et al. (2009) intro-duced an ion-molecule region (IMR) module wherein the ion reaction, I−+N2O5→I(N2O5)−, is enhanced so that N2O5 can be detected specifically at 235 amu. With this method, a direct measurement of N2O5is achieved, showing a good comparison with the well-established CRDS system in Hong Kong (Wang et al., 2016).
Until now, field measurements of NO3 and N2O5 have been extensively conducted in both the United States of America (USA) and Europe but have been sparse in China (i.e. Brown et al., 2006; Crowley et al., 2010; Benton et al., 2010), with only a few conducted in Hong Kong, Shanghai, and the North China Plain (Wang et al., 2016, 2013; Brown et al., 2016; Tham et al., 2016). From satellite observations, it was found that the USA, Europe, and China are the three ma-jor high-NOx regions worldwide (e.g. Richter et al., 2005). Moreover, in the North China Plain areas, the high-NOxair masses often overlap with high aerosol loadings from both secondary aerosol particle formation as well as nearby nat-ural sources (e.g. dust from the Gobi Desert in the spring) and serve as ideal locations for the study of NO3and N2O5 chemistry. To probe such potentially interesting chemistry in China, we developed a new light-emitting diode (LED)-based IBBCEAS (incoherent broadband cavity-enhanced ab-sorption spectrometer) instrument for the detection of NO3 and N2O5. In this study, the detailed setup of our instrument, lab characterizations, and its first field applications in Beijing are presented.
2 The instrument
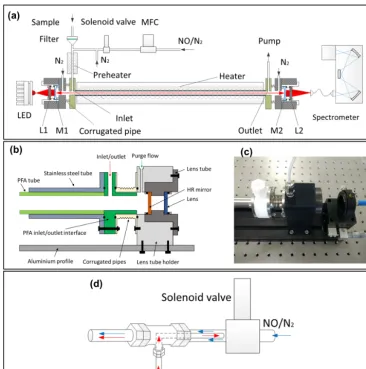
Figure 1.A schematic of the newly developed IBBCEAS instrument for the detection of NO3and N2O5.(a)Overview of the optical layout
(LEDs, collimating optics, high-finesse cavity, and spectrometer) and the flow system (aerosol filter, inlet, NO titration module, preheating tube, and detection cell).(b)The schematic layout of the mirror mounts, which enables a mechanical alignment of the high-reflectivity (HR) mirrors.(c)A photograph of the mirror mounts.(d)The schematic layout of the NO titration module; the red arrow denotes the N2gas flow,
and the blue arrow denotes the NO gas flow.
2.1 Optical layout
The schematic layout of the instrument is shown in Fig. 1a. The optical layout consists of a temperature stabilized light source, collimating optics, and a commercial spectrograph with a charge-coupled device (CCD) detector. The light source and collimating optics were concentrically integrated on an aluminium profile (75×8×5 cm).
A single-colour LED (LZ1-10R200, LED Engin, Mar-blehead, MA, USA) is used as the light source and is mounted on a three-dimensional (3-D) adjustable bracket. The manufacturer-specified full luminosity output is about 800 mW, centred at the deep red light region (660 nm), and the full width at half maximum (FWHM) is 25 nm. To min-imize the wavelength shift and intensity drift caused by the LED temperature drift, the LED plate is mounted on an
alu-minium block and uses a thermoelectric cooler control mod-ule to stabilize the temperature of the aluminium block at 17.5±0.1◦C. The aluminium block is thermally insulated to reduce heat exchange with the ambient surroundings.
dis-tance between the two mirrors at 50.0 cm. Due to the high-precision machining and assembly, the two lens tubes (shown as the scheme in Fig. 1b and the corresponding photograph in Fig. 1c) and the HR mirrors are mechanically aligned to have concentricity (< 0.01◦). Each HR mirror is continuously purged by 100 mL min−1 high-purity nitrogen flow to pre-vent particle contamination by the sample gas flow.
The optical cavity is enclosed by a sample gas detection cell with a sample inlet, outlet, and two welded corrugated pipes connected at two ends. The light exiting the cavity is further imaged by a plano-convex lens (f =50 mm) installed on the lens tube (shown in Fig. 1a as L2) that couples the output light onto the lead of a 100 µm diameter, 0.22 numer-ical aperture optnumer-ical fibre (QP100-2-UV-VIS, Ocean Optics, Dunedin, FL, USA). The lead of the fibre is mounted on a 3-D adjustable bracket and integrated on the aluminium pro-file. The other lead of the fibre directs the cavity output light into the spectrometer (QE65PRO, Ocean Optics, Dunedin, FL, USA). The CCD in the QE65000 spectrograph is ther-mally regulated at −20.0◦C to minimize the dark current. The line density of the diffraction grating of the spectrom-eter is 1200 mm−1, the entrance slit width is 100 µm, and the spectral resolution FWHM is 0.85 nm with the wave-length coverage of 580–710 nm. The instrument works under a signal-to-noise ratio estimated to be larger than 500 : 1.
2.2 Flow system
The instrument sample flow system includes the aerosol fil-ter, the inlet tube, the preheating tube and heated detec-tion cell, and sensors for temperature, pressure, and relative humidity. During the field measurements, we operate with a sample flow rate of 2.0 L min−1. A Teflon polytetrafluo-roethylene (PTFE) filter (25 µm thickness, 4.6 cm diameter, 2.5 µm pore size, Typris, China) is used in the front of the sample module to remove ambient aerosols. After the filtra-tion of the aerosols, the sample gas flow is delivered into the preheating tube through a 1.5 m perfluoroalkoxy alka-nes (PFA) inlet tube (Entegris, I.D.=4.35 mm). A 35 cm long PFA tube (Entegris, I.D.=4.35 mm) is installed in the front of the inlet interface as a preheating tube to dissociate N2O5to NO3. This preheating tube is heated and stabilized at 120◦C. With this setup of temperature and residence time, N2O5 is completely decomposed to NO3 in the preheating tube.
In Fig. 1b, the central part of the detection cell is con-structed using a 35.6 cm long PFA tube (marked in light green; Entegris, I.D.=10.0 mm), enclosed by a stainless steel tube (marked in grey). Each end of the stainless steel tube is connected with a PFA interface (marked in green) which set up the inlet and outlet and further connected with the corrugated pipes. With this combination, the loss of NO3 during detection is minimized. The total PFA cell length is 44.0 cm, but the length from the inlet to the outlet is only 39.2 cm. The sample gas flow cell is heated and stabilized at
80◦C to prohibit the reverse reaction of NO3and NO2 pro-ducing N2O5.
2.3 Dynamic reference spectrum
The effect of non-Beer–Lambert behaviour of water vapour absorption lines near 660 nm has to be well accounted for to achieve accurate and precise NO3detection (Langridge et al., 2008; Dorn et al., 2013). A few groups reported that the water vapour absorption can be determined with an “effec-tive” water vapour absorption cross section from a look-up table approach or a real-time iterative calculation approach under atmospheric conditions (Varma et al., 2009; Langridge et al., 2008; Kennedy et al., 2011). In this work, we solve this problem by using a dynamic reference spectrum through frequent addition of NO into the inlet. This method has pre-viously been used to acquire the chemical zero in the CRDS method (Brown et al., 2002; Crowley et al., 2010). Through the frequent addition of NO, the reference spectrum contain optical extinction from other absorbers in this spectral region, for example water vapour, NO2, O3, and any aerosols not re-moved by the filter. For the CRDS method, the NO addition is carefully designed so that the resulting extinction of in-creased NO2in the reference measurement compared to that of NO3is negligible. For the CEAS method, the NO addi-tion is a little less precise since this method allows for ob-servation of NO3separately from NO2due to their different spectral shapes. In both cases, the effect of water vapour is removed, and the fitting precision increases significantly in our applications.
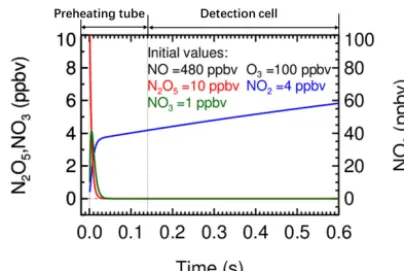
The NO titration module is connected to the inlet tube by a PFA tee-piece. Using a computer-controlled solenoid valve, the instrument measures reference and sample spec-trum sequentially by switching the NO injection on and off (NO=98.0 ppmv, flow rate=10.0 mL min−1). A high-purity N2 line (I.D.=1.50 mm) is added at the exit of the solenoid valve by a PFA tee-piece to flush the residual NO after the NO injection is switched off (Fig. 1d). The resulting NO mixing ratio is about 480 ppbv in the sample flow when NO injection is performed. Since 8.0 ppbv N2O5 was once observed and reported in Hong Kong (Wang et al., 2016) as an extreme case, the ambient NO3, N2O5, and O3were set at about 1, 10, and 100 ppbv, respectively, for the simulation, proving that the ambient NO3 and N2O5 can be removed within a time scale of 0.05 s when NO is injected (Fig. 2).
ref-Figure 2.Simulation of the change of the mixing ratios of NO3, N2O5, and NO2during the NO titration mode in the preheating tube
and detection cell for an extremely high NO3and N2O5case. The
initial ambient NO3, N2O5, and O3were set at 1, 10, and 100 ppbv,
respectively. The initial NO2was set at 4 ppbv from the impurity of
the used NO standard.
erence spectrum, we normally fit both NO3and NO2to cover the limiting cases when the generated NO2is high. Neverthe-less, the fitted NO2concentration will be negative since the NO2concentrations are higher in the reference spectrum.
3 Characterizations
The principle of the IBBCEAS system was systematically in-troduced by Fiedler et al. (2003) and will only be inin-troduced briefly here. The extinction coefficient (α(λ))in the cavity intrinsically consists of the absorption, the Rayleigh, and the Mie scattering, caused by the gas samples (Eq. 1). Theα(λ)
can be determined through measurements of the intensity of the sample spectrum, the reference spectrum, the mirror re-flectivity, and the effective cavity length
α (λ)=
I0(λ)
I (λ) −1
1−R (λ) deff
=X
i
ni×σi(λ)+αMie(λ)+αRayl(λ) . (1)
In Eq. (1),λis the wavelength of light;ni andσi(λ)are the number density and absorption cross section of the ith gas compound, respectively, which causes absorption of the in-cident light; deff is the effective cavity length; R(λ) is the mirror reflectivity;αRayl(λ)is the extinction due to Rayleigh scattering; αMie(λ) is the extinction due to Mie scattering;
I0(λ)is the reference spectrum; andI (λ)is the sample spec-trum. According to Eq. (1), the parameters include the cross section of the strong light absorbing gases in the target wave-length range, the effective cavity wave-length, and the mirror re-flectivity that has to be quantified.
3.1 The absorption cross section (σi(λ))
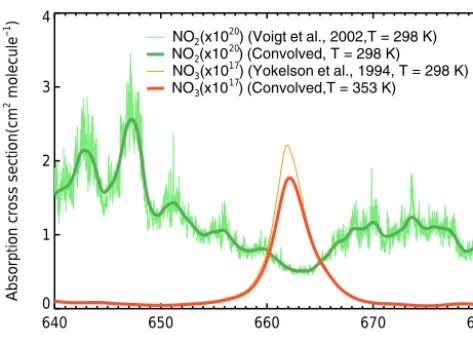
The effective absorption cross section of the abundant ambi-ent absorbers, NO3and NO2, in the wavelength window of 640–680 nm needs to be determined to retrieve the molecule number density of NO3. Since we used a dynamic reference spectrum, which contains the same amount of water vapour as that of the measured sample spectrum (Sect. 2.3), the calculation of the strong nonlinear absorption lines of H2O in this wavelength window is avoided. The NO3absorption cross section is known to be temperature dependent (Wang-berg et al., 1997; Sander, 1986; Ravishankara and Mauldin, 1986; Yokelson et al., 1994; Orphal et al., 2003; Osthoff et al., 2007). Under the heated cavity conditions (353 K), the effective absorption cross section of NO3 is calculated by two steps: (1) the reported cross section of NO3 (Yokelson et al., 1994) is scaled to the ratio of the band’s peak in-tensity at 662 nm between 298 and 353 K according to Os-thoff et al. (2007) and (2) the scaled absorption cross sec-tion is further convoluted with an instrument funcsec-tion de-termined with the neon emission line at 659.48 nm. Con-sequently, the calculated effective cross section at 353K is about 1.77×10⁻¹⁷cm2molecule−1 at 662 nm, and the un-certainty of the temperature correction and convolution is es-timated to be 13 %. Under cold cavity conditions (298 K), the NO3cross section is convoluted directly to our spectral res-olution with a peak value of 2.02×10⁻¹⁷cm2molecule−1at 662 nm, and the uncertainty of the convolution is estimated to be 10 % (Kennedy et al., 2011). The NO2cross section is reported to be not sensitive to the temperature change (Voigt et al., 2002), so that only convolution is performed to derive its effective absorption cross section for our instrument setup. Figure 3 shows the temperature-scaled and instrumental res-olution convolved NO3absorption cross section at 353 K and the convolved NO2 absorption cross section, respectively. The cross section of NO3near 662 nm is three orders of mag-nitude larger than that of NO2.
3.2 The mirror reflectivity (R(λ))
The mirror reflectivity (R(λ))is an important parameter to be determined for the CEAS type of instrument. In previ-ous work,R(λ)had been determined through four different methods, including the detection of a stable trace gas com-pound with known concentrations (Venables et al., 2006), the differentiation of pure gases with distinct Rayleigh scatter-ing cross sections (Chen and Venables, 2011; Washenfelder et al., 2016; Min et al., 2016), the usage of low-loss op-tics (Varma et al., 2009), and the determination of the phase shift or ring down time (Langridge et al., 2008; Schuster et al., 2009; Kennedy et al., 2011). In this study,R(λ) is de-termined through the differentiation of pure gases (N2 and He) in the cavity (Eq. 2) during the field campaigns. The Rayleigh scattering cross sections for N2 (σRayl,N2(λ)) and
640 650 660 670 680 Wavelength (nm)
0 1 2 3 4
Absorption cross section(cm
2 molecule
−1
)
NO (x10 ) (Voigt et al., 2002,T = 298 K) 2
20
NO (x10 ) (Convolved, T = 298 K) 2
20
NO (x10 ) (Yokelson et al., 1994, T = 298 K) 3
17
NO (x10 ) (Convolved,T = 353 K) 3
17
Figure 3.Absorption cross section of NO3and NO2from 640 to
680 nm. The green thin line is the original cross section of NO2at 298 K determined by Voigt et al. (2002), the green thick line is the convolved result, the orange thin line is the original cross section of NO3at 298 K determined by Yokelson et al. (1994), and the red
thick line is the temperature-scaled and convolved cross section at 353 K.
Shardanand and Rao (1977), respectively.
R (λ)=1−d
×
I
N2(λ)×nN2×σRayl,N2(λ)−IHe(λ)×nHe×σRayl,He(λ) IHe(λ)−IN2(λ)
. (2) In Eq. (2),dis the distance between the two high-reflectivity mirrors (50.0 cm);IN2(λ)andIHe(λ)represent the light out
spectrum determined when the cavity is filled by N2or He through the purge flow injection lines, respectively; andnN2
and nHe are the calculated number density of N2 and He, respectively, at the measured temperature and pressure in the cavity. Figure 4 shows the mirror reflectivity calibra-tion results during the field measurements performed at the campus of the University of Chinese Academy of Science (UCAS) in Beijing during winter 2016. The bold black line is the average reflectivity of the five measurements ofR(λ). It is noted that the peak of R(λ)is 0.999936±0.000002 at 662 nm. Under the protection of the purge flow and due to the mechanically aligned setup of the cavity system, the de-termined R(λ) is remarkably stable during this field cam-paign. The bold red line is the average cavity loss, which is equal to (1−R(λ))/d, with the maximized point near 662 nm of (1.28±0.01)×10−6 (1σ ). The total uncertainty of the reflectivity is about 5 %, which is dominated by the scattering cross sections of N2, according to Sneep and Ubachs (2005). The uncertainty for He makes a negligible contribution (Washenfelder et al., 2008).
620 640 660 680 700
Wavelength (nm) 0.9996
0.9997 0.9998 0.9999 1.0000
0 2 x 10⁻⁶
4 x 10⁻⁶
6 x 10⁻⁶
8 x 10⁻⁶
αcavity
(cm
−1
)
Reflectivity
Figure 4.Mirror reflectivity and cavity losses calibrated with high-purity He and N2in the current experimental setup during the field
measurements. The original calibration results were depicted by varying coloured lines: the smoothed black bold line is the aver-ageR(λ), and the smoothed bold red line is the average cavity loss ((1−R(λ))/d) from five measurements. The mean (±1σ )value at 662 nm of reflectivity and the cavity loss are 0.999936±0.000002 and (1.28±0.01)×10−6, respectively. The effective path length at 662 nm reached 6.13 km.
3.3 The effective cavity length (deff)
The effective cavity length (deff)represents the cavity length occupied by the absorbing gas when the sample flow is sta-ble. Since the continuous purge flow occupies the two ends of the cavity to protect the mirrors, thedeffis usually shorter than the distance between the two high-reflectivity mirrors (defined asd, which is 50.0 cm in our setup) and longer than the distance between the sample inlet and outlet (defined as
−20 −10 0 10 20 30
640 650 660 670 680
Wavelength (nm) −5
0 5
640 650 660 670 680
Wavelength (nm)
α
(x10
−9 )(cm −1 )
Fit result NO3=64 pptv
NO2=−33 ppbv
Polynomial Residual
_
Observed_
Fitted_
Fitted NO2
_
Fitted NO3_
Observed, iFigure 5.An example of the spectral fit for an extinction spectrum measured (5 s average) during field measurements. The fitted results of NO3and NO2are shown as well as the third-order polynomial,
the total fit result, and the residual.
4 Results and discussion
4.1 Spectral fitting
A least-squares spectral fitting software package was devel-oped for retrieving the molecule number densities of NO3 and NO2. The optimized spectral fitting window was found to be from 640 to 680 nm, and a third-order polynomial was applied to fit the background drift and unaccounted scatter-ing effect. Figure 5 shows an example of the spectral fittscatter-ing of a measurement spectrum of NO3 at 5 s integration time with ambient measurement. By using the dynamic reference spectrum, the spectral fitting is targeted at NO3and NO2as explained above. The retrieved mixing ratio of NO3(that ac-tually represents the NO3+N2O5 concentration in the gas samples) is 64 pptv and that of NO2is−33 ppbv, which was mainly caused by the conversion of ambient O3 (80 ppbv) with the added NO in the measurement of the reference spec-trum. The corresponding fitting residual is in the range of
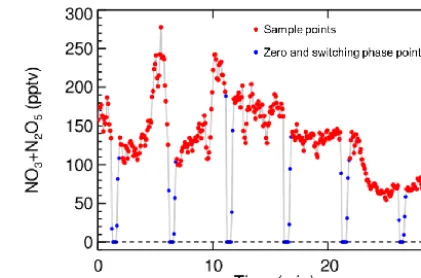
±4.0×10⁻⁹cm−1, and the H2O absorption is found to be cancelled out in the residual spectrum. Moreover, an exam-ple time series of NO3+N2O5 measurement results during ambient measurements is shown in Fig. 6. During ambient measurement, the NO titration is performed periodically to acquire the dynamic reference spectrum. In Fig. 6, the red points mark the effective ambient measurement result, which covered 4 min 20 s of every 5 min, and the blue points include 20 s for the zero points and a 20 s switching phase between the two modes, which is discarded from the data analysis.
4.2 Transmission efficiency of NO3and N2O5
For the accurate measurement of NO3 and N2O5, the wall loss reactivity of the sample manifold and the detection cell
Figure 6.An example time series of NO3+N2O5detection per-formed at a rural site in Beijing with 5 s spectrum integral time. The red points denote the ambient measurement mode without NO addition, and the blue points denote the 20 s zero points (determina-tion of the dynamic reference spectrum) with NO addi(determina-tion and 20 s switching time between the titration mode and the sample mode.
need to be determined. This includes (1) the wall loss on the filter, (2) the wall loss on the inner surface of the inlet tube, and (3) the wall loss in the preheating tube and the detection cell. To determine the wall loss reactivity, an NO3/N2O5 source module with stable mixing ratio (±2 %) is set up in the lab. In this module, high-purity synthetic air and NO2 is supplied to a gas mixer (TE-146i), and O3 is generated in this gas mixer through the irradiation of a mercury lamp. The supplied NO2and the produced O3is further delivered into a 160 L smog chamber to generate stable concentrations of NO3and N2O5. Commercial NOx(TE-42i) and O3 mon-itors (TE-49i) are operated to quantify the mixing ratio of NO2and O3in the chamber. According to the detected con-centration of NO2 and O3, we can modulate the delivered concentration levels of NO3and N2O5with the help of a box model.
4.2.1 Filter loss
The filter transmission efficiency of NO3and N2O5is deter-mined through the differentiation of an inlet without a filter, with a clean filter (25 µm thickness, 4.6 cm diameter, 2.5 µm pore size, Typris, China), and with used filters saved during typical pollution episodes during field measurements. Ac-cording to previous field measurements of NO3 and N2O5 (e.g. Brown et al., 2001; Schuster et al., 2009), frequent fil-ter change is suggested, and the frequency is proposed to be 0.5–3 h, depending on the aerosol loadings to reduce the im-pact of the filter aging caused by aerosol accumulation. For this reason, we changed the filter with a regular time interval (once every hour) during pollution episodes. For clean con-ditions, the filter exchange frequency was reduced to be once every 2 h.
detection system to convert all the generated N2O5delivered by the calibration source to NO3. The determined clean filter transmission efficiency is 75 % for NO3and is slightly lower than the previous results of NO3 transmission efficiency on Teflon filters (Aldener et al., 2006; Schuster et al., 2009). The filter transmission efficiency of NO3on used filters is deter-mined to be 5 % less than on the clean filter. For the field calculation of the NO3concentrations, the filter transmission efficiency is then estimated to be 72±3 %. For the determi-nation of the N2O5filter transmission efficiency, the mixing ratio of NO2 and O3 is modulated to achieve a high ratio of N2O5/NO3(> 100) before being fed into the instrument. The transmission efficiency of the N2O5 on the clean filter is determined to be 96 %, which is consistent with the pre-vious studies on the filter loss of N2O5(Fuchs et al., 2008; Aldener et al., 2006; Schuster et al., 2009). The filter trans-mission efficiency of N2O5on a used filter is determined to be 6 % smaller than on the clean filter. Therefore, the filter transmission factor for N2O5is estimated to be 93±3 %.
4.2.2 Wall loss of the inlet tube, the preheating tube, and the detection cell
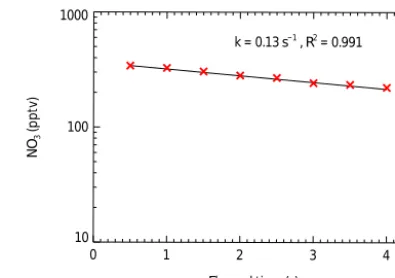
To determine the wall loss reactivity of NO3, the heated de-tection cell is used as a flow tube. Gas samples with a stable amount of N2O5are delivered by the NO3/N2O5source de-scribed above. By stopping the sample gas flow, the observed NO3versus the elapsed time determines the first-order loss rate of NO3in the heated detection cell. In this experiment, the fitted first-order uptake coefficient of NO3 reflects the contribution from three processes: (1) the wall loss of NO3in the detection cell, (2) the change of the effective cavity length due to the adding of the purge flows, and (3) the production of NO3from the reaction of NO2and O3. The NO2 concentra-tion determined in the running sample gas flow is used to de-termine the change ofdeffcorresponding to the elapsed time after stopping the sample flow (in the way it is used to quan-tify thedeffin Sect. 3.3). A time series ofdeffis determined with high time resolution data acquisition (0.5 s) that is then used to quantify the mixing ratio of NO3in the correspond-ing time intervals. Figure 7 shows the decay of the observed NO3concentrations on a logarithmic scale versus the elapsed time. The fitted first-order decay rate is 0.13±0.02 s−1, with a good correlation coefficient (R2=0.991). Finally, the fit-ted first-order decay rate is correcfit-ted by the chemistry of re-actions R1 and R4 with a box model constrained to observed NO2and O3. The NO3wall reactivity of the heated detection cell surface is determined to 0.16±0.02 s−1, which is sim-ilar to previous results of 0.1–0.3 s−1 (Brown et al., 2002; Crowley et al., 2010; Kennedy et al., 2011; H. C. Wang et al., 2015).
The surface materials are the same as that of the inlet tube, the preheating tube, and the detection cell. Therefore, the wall loss reactivity of NO3in the detection cell will be ap-plicable for the inlet and the preheating tubes. As shown in
0 1 2 3 4
Elapsed time (s) 10
100 1000
NO
3
(pptv)
k = 0.13 s−1 , R2 = 0.991
Figure 7.The determined concentration decay of the NO3radical in the heated detection cell caused by the wall loss. The red crosses denote the observation results, and the black line depicts the cor-responding exponential fit. The net wall loss reactivity of NO3is
corrected to be 0.16±0.02 s−1with a box model simulation of the chemical reactions occurring in the detection cell.
Fig. 1a, our instrument has only one mixing point at the setup of the NO titration module. In addition, there is no blockage of the main sample gas flow of the PFA tee-piece. Therefore, we think the influence of the mixing point can be neglected. As reported by Kennedy et al. (2011), the NO3wall loss re-activity in the cold PFA piping (inlet) is the same as in the heated ones with a value of 0.27 s−1. Nevertheless, we no-ticed that Crowley et al. (2010) reported that the NO3 wall loss reactivity of the cold PFA tube could be a factor of 2 larger than that of the heated tube. We assume our NO3wall loss reactivity for the cold PFA tube to be between 0.16 and 0.32 s−1, and the average NO3 wall loss reactivity for the cold PFA tube is estimated to be 0.24 s−1with an uncertainty of 0.08 s−1.
Table 1.The transmission efficiency of NO3and N2O5for the sample module setup for the developed instrument.
Gases Filter Inlet tube (0.7 s) Preheating tube (0.14 s) Cavity (0.46 s) Total
NO3 72±3 %a 84±4 % (k=0.24 s−1)b 98 % (k=0.16 s−1) 93 % (k=0.16 s−1) 55±6 %
N2O5 93±3 %a 99 % (k=0.019 s−1) 99±1 %c 93 % (k=0.16 s−1) 85±3 %
aFilter aging contributed an uncertainty of 3 %;bthe uncertainty of the NO
3wall loss reactivity in the cold inlet tube caused an uncertainty of 4 %; cthe location of the N
2O5dissociation in the preheating tube had an uncertainty of 1 %.
0 1 2 3 4
Residence time (s) 1000
N2 O5
(pptv)
k = 0.015 s−1 , R2 = 0.953
1400
1300
1200
1100
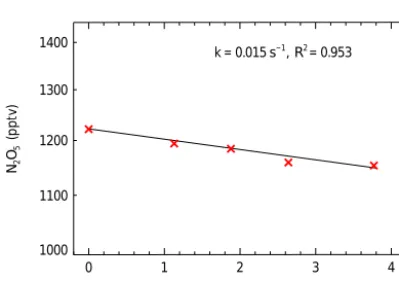
Figure 8.The determined concentrations of N2O5versus the
res-idence time of the sample gas flows in the inlet tube. The change of the residence time is achieved by changing the inlet tubes hav-ing different lengths. The red crosses denote the observation results, and the black line depicts the corresponding exponential fit. The net wall loss reactivity of N2O5is corrected to be 0.019±0.002 s−1
with a box model simulation of the chemical reactions occurring in the inlet tubes.
determine the transmission efficiency of N2O5in the preheat-ing tube to be 99±1 %.
The total transmission efficiencies as well as the detailed contributions due to the corresponding filter and wall loss for NO3and N2O5are summarized in Table 1 for the exper-imental setup during field applications. The total estimated transmission efficiency of NO3(TNO3)and N2O5(TN2O5)is
determined to be 55±6 and 85±3 %, respectively.TNO3 is
dominated by the loss on the filter and the inlet tube, and the difference ofTNO3 between cold cavity and heated cavity is
negligible, while the TN2O5 is dominated by the loss on the
filter and the detection cell.
4.3 Uncertainty and the limit of detection
As outlined above, the uncertainty of the NO3absorption is estimated to be 10 % (298 K) and 13 % (353 K), respectively; the uncertainty of the effective cavity length calculation is about 13 %, mainly due to the fast NO3wall loss; the uncer-tainty of the mirror reflectivity determination is about 5 %, controlled by the error of the scattering cross section of N2; and the uncertainty of theTNO3is about 6 %, according to the
Gaussian error propagation, and the associated uncertainty is estimated to be 19 % for the ambient NO3measurement. The
uncertainty of the transmission efficiency in the heated cavity is estimated at about 4 and 11 % when N2O5or NO3 domi-nate the concentrations of NO3+N2O5, respectively, accord-ing to the Gaussian error propagation, and the associated un-certainty for the ambient NO3+N2O5measurement is esti-mated to be 19–22 %. The uncertainties of the observed mix-ing ratios of NO3 and NO3+N2O5 are summarized in Ta-ble 2.
For the ambient N2O5measurement, two parallel cavities are required with one cold cavity measures NO3and another heated cavity measured NO3+N2O5 like previous studies (Brown et al., 2003b; Langridge et al., 2008; Crowley et al., 2010). Here we estimated the uncertainty of N2O5by follow-ing the expression proposed by Dubé et al. (2006).
δ (N2O5)= s
[δ(SUM)SUM]2+ [δ TNO3
TNO3NO3]
2
[SUM−TNO3NO3]2
+δ TN2O5 2
. (3)
In Eq. (3), theδ(N2O5)represents the uncertainty of N2O5 measurements, SUM is the measured NO3+N2O5 in the heated cavity, NO3 is the ambient mixing ratio of NO3 de-rived by the cold cavity,δ(TNO3)andδ(TN2O5)denote the
un-certainty ofTNO3andTN2O5, andδ(SUM)denotes the
uncer-tainty of NO3+N2O5measurement in the heated cavity. As reported by Osthoff et al. (2007) and Kennedy et al. (2011), the uncertainty of N2O5increases with the decreasing of the ratio of N2O5/NO3; when N2O5/NO3is larger than 1 in the field measurement, the uncertainty of N2O5is in the range of 22–36 %.
1 10 100 Acquisition time (s) 0.1
1.0
Allan deviation(1
σ
,pptv)
. .
0.3 pptv in 30−100 s
(a)
−15 −10 −5 0 5 10 15
NO3 (pptv)
0 200 400 600 800 1000 1200 1400
Frequency (a.u.)
12 000 points (1 s) 1σ=2.4 pptv
μ= −0.1 pptv
(b)
−15 −10 −5 0 5 10 15
NO3 (pptv)
0 20 40 60 80
Frequency (a.u.)
400 points (30 s) 1σ= 1.6 pptv
μ= −0.1 pptv
(c)
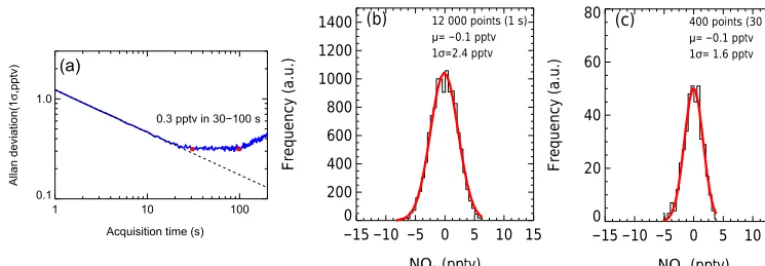
Figure 9.The instrument performance with different integration times.(a)Allan deviation plots for measurements of NO3with 1 s integration
time. Panels(b)and(c)show the histogram analyses of the measurements of NO3with 1 and 30 s integration time, respectively.
Table 2.Details of the uncertainties of the measurement of ambient NO3and NO3+N2O5.
Parameters Uncertainty Uncertainty
(NO3) (NO3+N2O5)
Cross section of NO3 13 % 10 %
Mirror reflectivity 5 % 5 %
Transmission efficiency 6 % 4–11 %
Effective cavity length 13 % 13 %
Total 19 % 19–22 %
analysis of 12 000 zero measurement results for a 1 and 30 s average, respectively. The limit of detection is 2.4 pptv (1σ )
for the 1 s data and improved to be 1.6 pptv (1σ )for the 30 s data. Due to the smaller cross section of NO3that was ap-plied in the measurement of N2O5at 353K, the LOD is es-timated 2.7 pptv (1σ )with 1 s integral time. Referring to the observed mixing ratios of NO3and N2O5in the typical re-gions (H. C. Wang et al., 2015), the developed instrument has the ability to measure NO3 and N2O5in the field. The LOD and uncertainty of our instrument is further compared with the existing field measurement techniques for NO3and N2O5 (Table 3). For the NO3measurement, CRDS, CEAS, and LIF are available with LOD values of 0.2-10 pptv and uncertainties lower than 25 %. For the N2O5measurement, the three methods mentioned above and CIMS are available with LOD values of 0.5–12 pptv and uncertainties lower than 40 %. Our instrument compares well with the available field instruments for the detection of NO3 and N2O5. Neverthe-less, we have so far only probed the field sites with the pres-ence of high concentrations of NO3+N2O5, and, therefore, the NO3measurement mode is not used in the field studies.
5 Performance in field campaigns
The instrument has been deployed in two comprehensive field campaigns in Beijing in 2016. The first campaign took
place at the campus of the University of Chinese Academy of Sciences, and the data shown in Fig. 10b are from 27 Febru-ary to 4 March, while the second campaign took place at the Peking University Changping, PKU(CP), campus and the data shown in Fig. 10c are from 23 to 29 May. As shown in Fig. 10a, both sites are located in the northern rural areas in Beijing, about 60 and 40 km from the centre of Beijing, respectively. According to our current understanding of the NO3–N2O5chemistry, rural areas lack fresh NO emissions, and the air masses transported from urban areas are well aged and featured with high NO2and O3and low NO, so that the influence of the NO3–N2O5 chemistry can be maximized. We therefore expected these two sites to be ideal locations to probe the NO3–N2O5chemistry in Beijing.
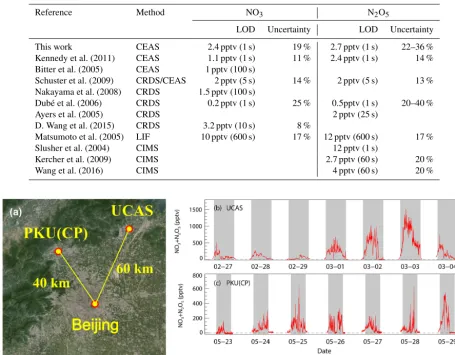
Table 3.Limits of detection (LODs) and uncertainty of the existing field-deployable instruments of NO3and N2O5.
Reference Method NO3 N2O5
LOD Uncertainty LOD Uncertainty
This work CEAS 2.4 pptv (1 s) 19 % 2.7 pptv (1 s) 22–36 %
Kennedy et al. (2011) CEAS 1.1 pptv (1 s) 11 % 2.4 pptv (1 s) 14 %
Bitter et al. (2005) CEAS 1 pptv (100 s)
Schuster et al. (2009) CRDS/CEAS 2 pptv (5 s) 14 % 2 pptv (5 s) 13 %
Nakayama et al. (2008) CRDS 1.5 pptv (100 s)
Dubé et al. (2006) CRDS 0.2 pptv (1 s) 25 % 0.5pptv (1 s) 20–40 %
Ayers et al. (2005) CRDS 2 pptv (25 s)
D. Wang et al. (2015) CRDS 3.2 pptv (10 s) 8 %
Matsumoto et al. (2005) LIF 10 pptv (600 s) 17 % 12 pptv (600 s) 17 %
Slusher et al. (2004) CIMS 12 pptv (1 s)
Kercher et al. (2009) CIMS 2.7 pptv (60 s) 20 %
Wang et al. (2016) CIMS 4 pptv (60 s) 20 %
Figure 10.Two example time series of the observed mixing ratios of NO3+N2O5measured during the UCAS winter campaign 2016 and
the PKU(CP) summer campaign. The grey box indicates the time span for night-time. Panel(a)depicts the map of the two sites, indicating the UCAS site and the PKU(CP) site, that are about 60 and 40 km away from the centre of Beijing, respectively. Panel(b)shows a typical development of the observed mixing ratio of NO3+N2O5from clean to polluted air masses at UCAS. Panel(c)shows the observed mixing ratio of NO3+N2O5during a typical pollution episode at PKU(CP).
and then gradually decreased to zero before sunrise. The de-crease of NO3+N2O5 at night in this location may be re-lated to the typical running style of the heavy-duty vehicles (HDVs). It is known that HDVs would emit large amounts of fresh NO. The emitted NO is titrated with the O3 and NO3 and then reduces the accumulation of N2O5or enhances the loss of N2O5 during the time scale of thermal dissociation (0.1–20 min from summer to winter time). Typically, more heavy-duty cars appear on the nearby street after 22:00 CST (China Standard Time, UTC+8 h), since the ban of HDVs entering downtown Beijing is lifted after 22:00 CST. The NO3+N2O5measurement results of the PKU(CP) summer campaign are presented in Fig. 10c. During the summer cam-paign, the instrument was set up on the fifth floor of the main building at the PKU(CP) campus. The inlet was also about 15 m above ground. The average night-time
tempera-ture and NO2 mixing ratio were 10.0◦C and 17.5 ppbv, re-spectively. High-O3events frequently occurred in this sea-son compared to that of winter. Together with the atmo-spheric processes with high-NO2conditions, the calculated ratio of N2O5/NO3 based on the thermodynamic equilib-rium was estimated to be larger than 20, and the amount of NO3+N2O5also represented that of N2O5mostly at the PKU(CP) site.
6 Conclusions
1. Novel non-adjustable mechanically aligned mirror mounts were designed and tested successfully. The new design offered a fast setup of the instrument in the field and proved to be stably operable by checking the mirror reflectivity.
2. An additional chemical titration module was tested by adding NO into the sample flow and proved to be very helpful for the ambient spectral analysis, which en-hanced the fitting precision by avoiding the complicated fitting of the water vapour absorption.
The total transmission efficiencies of NO3 and N2O5 were determined to be 55±6 and 85±3 %, respectively. The to-tal uncertainty of the measurement of NO3and N2O5was de-termined to be 19 and 22–36 %, respectively. The best limit of detection was quantified to be 2.4 pptv (1σ )and 2.7 pptv (1σ ), with a 1 s integration time for NO3and N2O5, respec-tively. Compared to the other field instruments used world-wide, the new instrument was capable of measuring both NO3 and N2O5, since only one channel was established at the moment. The instrument was deployed successfully in the NO3+N2O5 measurement in two comprehensive field campaigns conducted in the northern rural areas of Beijing in 2016, where high ratios of N2O5/NO3were present due to the presence of high NO2. In these two campaigns, high mixing ratios of near-surface NO3+N2O5 (mostly N2O5) up to 1 ppbv were detected. The observed high NO3+N2O5 concentrations in the summer campaign indicated that high concentrations of NO3, up to 50 pptv, could be present at night. Since significant night-time OH concentrations (up to 1×106cm−3)were also found for these environments (e.g. Lu et al., 2014; Tan et al., 2017), the contribution of NO3– N2O5 and HOx chemistry toward the night-time oxidation capacity in Beijing is worthy of future exploration.
Data availability. The datasets used in this study are available from the corresponding author upon request ([email protected]).
Competing interests. The authors declare that they have no conflict of interest.
Acknowledgements. The work was supported by the National Nat-ural Science Foundation of China (grants no. 41375124, 21522701, 91544225, and 41421064) and Strategic Priority Research Program of the Chinese Academy of Sciences (grant no. XDB05010500). The authors gratefully acknowledge the discussions and sug-gestions from Steven Brown, Kyung-Eun Min, Bin Ouyang, Ravi Varma, Hendrik Fuchs, and Zhiguo Wu. We thank the teams of the UCAS (organized by Yuanhang Zhang) and Changping campaigns (organized by Min Hu and Mattias Hallquist).
Edited by: G. Phillips
Reviewed by: two anonymous referees
References
Aldener, M., Brown, S. S., Stark, H., Williams, E. J., Lerner, B. M., Kuster, W. C., Goldan, P. D., Quinn, P. K., Bates, T. S., Fehsenfeld, F. C., and Ravishankara, A. R.: Reactivity and loss mechanisms of NO3 and N2O5 in a polluted marine
environ-ment: Results from in situ measurements during New England Air Quality Study 2002, J. Geophys. Res.-Atmos., 111, D23S73, doi:10.1029/2006jd007252, 2006.
Allan, D. W.: Statistics of Atomic Frequency Standards, Pr. Inst. Electr. Elect., 54, 221–230, 1966.
Axson, J. L., Washenfelder, R. A., Kahan, T. F., Young, C. J., Vaida, V., and Brown, S. S.: Absolute ozone absorption cross section in the Huggins Chappuis minimum (350–470 nm) at 296 K, Atmos. Chem. Phys., 11, 11581–11590, doi:10.5194/acp-11-11581-2011, 2011.
Ayers, J. D., Apodaca, R. L., Simpson, W. R., and Baer, D. S.: Off-axis cavity ring down spectroscopy: application to atmospheric nitrate radical detection, Appl. Optics, 44, 7239–7242, 2005. Benton, A. K., Langridge, J. M., Ball, S. M., Bloss, W. J.,
Dall’Osto, M., Nemitz, E., Harrison, R. M., and Jones, R. L.: Night-time chemistry above London: measurements of NO3and
N2O5from the BT Tower, Atmos. Chem. Phys., 10, 9781–9795,
doi:10.5194/acp-10-9781-2010, 2010.
Bitter, M., Ball, S. M., Povey, I. M., and Jones, R. L.: A broad-band cavity ringdown spectrometer for in situ measurements of atmospheric trace gases, Atmos. Chem. Phys., 5, 2547–2560, doi:10.5194/acp-5-2547-2005, 2005.
Brown, S. S. and Stutz, J.: Nighttime radical observations and chemistry, Chem. Soc. Rev., 41, 6405–6447, 2012.
Brown, S. S., Stark, H., Ciciora, S. J., and Ravishankara, A. R.: In-situ measurement of atmospheric NO3and N2O5via cavity
ring-down spectroscopy, Geophys. Res. Lett., 28, 3227–3230, 2001. Brown, S. S., Stark, H., Ciciora, S. J., McLaughlin, R. J., and
Rav-ishankara, A. R.: Simultaneous in situ detection of atmospheric NO3and N2O5via cavity ring-down spectroscopy, Rev. Sci.
In-strum., 73, 3291–3301, 2002.
Brown, S. S., Stark, H., and Ravishankara, A. R.: Applicability of the steady state approximation to the interpretation of at-mospheric observations of NO3 and N2O5, J. Geophys.
Res.-Atmos., 108, 4539, doi:10.1029/2003jd003407, 2003a. Brown, S. S., Stark, H., Ryerson, T. B., Williams, E. J., Nicks, D. K.,
Trainer, M., Fehsenfeld, F. C., and Ravishankara, A. R.: Nitro-gen oxides in the nocturnal boundary layer: Simultaneous in situ measurements of NO3, N2O5, NO2, NO, and O3, J. Geophys.
Res.-Atmos., 108, 4299, doi:10.1029/2002jd002917, 2003b. Brown, S. S., Ryerson, T. B., Wollny, A. G., Brock, C. A., Peltier,
R., Sullivan, A. P., Weber, R. J., Dubé, W. P., Trainer, M., Meagher, J. F., Fehsenfeld, F. C., and Ravishankara, A. R.: Vari-ability in nocturnal nitrogen oxide processing and its role in re-gional air quality, Science, 311, 67–70, 2006.
Brown, S. S., Dubé, W. P., Tham, Y. J., Zha, Q. Z., Xue, L. K., Poon, S., Wang, Z., Blake, D. R., Tsui, W., Parrish, D. D., and Wang, T.: Nighttime chemistry at a high altitude site above Hong Kong, J. Geophys. Res.-Atmos., 121, 2457–2475, 2016.
Chen, J. and Venables, D. S.: A broadband optical cavity spectrom-eter for measuring weak near-ultraviolet absorption spectra of gases, Atmos. Meas. Tech., 4, 425–436, doi:10.5194/amt-4-425-2011, 2011.
Crowley, J. N., Schuster, G., Pouvesle, N., Parchatka, U., Fischer, H., Bonn, B., Bingemer, H., and Lelieveld, J.: Nocturnal nitro-gen oxides at a rural mountain-site in south-western Germany, Atmos. Chem. Phys., 10, 2795–2812, doi:10.5194/acp-10-2795-2010, 2010.
Dorn, H.-P., Apodaca, R. L., Ball, S. M., Brauers, T., Brown, S. S., Crowley, J. N., Dubé, W. P., Fuchs, H., Häseler, R., Heitmann, U., Jones, R. L., Kiendler-Scharr, A., Labazan, I., Langridge, J. M., Meinen, J., Mentel, T. F., Platt, U., Pöhler, D., Rohrer, F., Ruth, A. A., Schlosser, E., Schuster, G., Shillings, A. J. L., Simp-son, W. R., Thieser, J., Tillmann, R., Varma, R., Venables, D. S., and Wahner, A.: Intercomparison of NO3radical detection
in-struments in the atmosphere simulation chamber SAPHIR, At-mos. Meas. Tech., 6, 1111–1140, doi:10.5194/amt-6-1111-2013, 2013.
Dubé, W. P., Brown, S. S., Osthoff, H. D., Nunley, M. R., Ciciora, S. J., Paris, M. W., McLaughlin, R. J., and Ravishankara, A. R.: Air-craft instrument for simultaneous, in situ measurement of NO3
and N2O5 via pulsed cavity ring-down spectroscopy, Rev. Sci.
Instrum., 77, 034101, doi:10.1063/1.2176058, 2006.
Fiedler, S. E., Hese, A., and Ruth, A. A.: Incoherent broad-band cavity-enhanced absorption spectroscopy, Chem. Phys. Lett., 371, 284–294, 2003.
Fortner, E. C., Zhao, J., and Zhang, R.: Development of Ion Drift-Chemical Ionization Mass Spectrometry, Anal. Chem., 76, 5436– 5440, 2004.
Fry, J. L., Kiendler-Scharr, A., Rollins, A. W., Wooldridge, P. J., Brown, S. S., Fuchs, H., Dubé, W., Mensah, A., dal Maso, M., Tillmann, R., Dorn, H.-P., Brauers, T., and Cohen, R. C.: Organic nitrate and secondary organic aerosol yield from NO3oxidation ofβ-pinene evaluated using a gas-phase kinet-ics/aerosol partitioning model, Atmos. Chem. Phys., 9, 1431– 1449, doi:10.5194/acp-9-1431-2009, 2009.
Fuchs, H., Dubé, W. P., Cicioira, S. J., and Brown, S. S.: Determi-nation of inlet transmission and conversion efficiencies for in situ measurements of the nocturnal nitrogen oxides, NO3, N2O5and
NO2, via pulsed cavity ring-down spectroscopy, Anal. Chem.,
80, 6010–6017, 2008.
Fuchs, H., Simpson, W. R., Apodaca, R. L., Brauers, T., Cohen, R. C., Crowley, J. N., Dorn, H.-P., Dubé, W. P., Fry, J. L., Häseler, R., Kajii, Y., Kiendler-Scharr, A., Labazan, I., Matsumoto, J., Mentel, T. F., Nakashima, Y., Rohrer, F., Rollins, A. W., Schuster, G., Tillmann, R., Wahner, A., Wooldridge, P. J., and Brown, S. S.: Comparison of N2O5mixing ratios during NO3Comp 2007 in
SAPHIR, Atmos. Meas. Tech., 5, 2763–2777, doi:10.5194/amt-5-2763-2012, 2012.
Gherman, T., Venables, D. S., Vaughan, S., Orphal, J., and Ruth, A. A.: Incoherent broadband cavity-enhanced absorption spec-troscopy in the near-ultraviolet: Application to HONO and NO2, Environ. Sci. Technol., 42, 890–895, 2008.
Kahan, T. F., Washenfelder, R. A., Vaida, V., and Brown, S. S.: Cavity-Enhanced Measurements of Hydrogen Peroxide Absorp-tion Cross SecAbsorp-tions from 353 to 410 nm, J. Phys. Chem. A, 116, 5941–5947, 2012.
Kennedy, O. J., Ouyang, B., Langridge, J. M., Daniels, M. J. S., Bauguitte, S., Freshwater, R., McLeod, M. W., Ironmonger, C., Sendall, J., Norris, O., Nightingale, R., Ball, S. M., and Jones, R. L.: An aircraft based three channel broadband cavity en-hanced absorption spectrometer for simultaneous measurements of NO3, N2O5 and NO2, Atmos. Meas. Tech., 4, 1759–1776,
doi:10.5194/amt-4-1759-2011, 2011.
Kercher, J. P., Riedel, T. P., and Thornton, J. A.: Chlorine activation by N2O5: simultaneous, in situ detection of ClNO2and N2O5
by chemical ionization mass spectrometry, Atmos. Meas. Tech., 2, 193–204, doi:10.5194/amt-2-193-2009, 2009.
Langridge, J. M., Laurila, T., Watt, R. S., Jones, R. L., Kaminski, C. F., and Hult, J.: Cavity enhanced absorption spectroscopy of mul-tiple trace gas species using a supercontinuum radiation source, Opt. Express, 16, 10178–10188, 2008.
Lu, K. D., Rohrer, F., Holland, F., Fuchs, H., Brauers, T., Oebel, A., Dlugi, R., Hu, M., Li, X., Lou, S. R., Shao, M., Zhu, T., Wahner, A., Zhang, Y. H., and Hofzumahaus, A.: Nighttime ob-servation and chemistry of HOx in the Pearl River Delta and
Beijing in summer 2006, Atmos. Chem. Phys., 14, 4979–4999, doi:10.5194/acp-14-4979-2014, 2014.
Matsumoto, J., Kosugi, N., Imai, H., and Kajii, Y.: Development of a measurement system for nitrate radical and dinitrogen pentoxide using a thermal conversion/laser-induced fluorescence technique, Rev. Sci. Instrum., 76, 064101, doi:10.1063/1.1927098, 2005. Min, K.-E., Washenfelder, R. A., Dubé, W. P., Langford, A. O.,
Ed-wards, P. M., Zarzana, K. J., Stutz, J., Lu, K., Rohrer, F., Zhang, Y., and Brown, S. S.: A broadband cavity enhanced absorption spectrometer for aircraft measurements of glyoxal, methylgly-oxal, nitrous acid, nitrogen dioxide, and water vapor, Atmos. Meas. Tech., 9, 423–440, doi:10.5194/amt-9-423-2016, 2016. Nakayama, T., Ide, T., Taketani, F., Kawai, M., Takahashi, K., and
Matsumi, Y.: Nighttime measurements of ambient N2O5, NO2,
NO and O3in a sub-urban area, Toyokawa, Japan, Atmos.
Envi-ron., 42, 1995–2006, 2008.
Orphal, J., Fellows, C. E., and Flaud, P. M.: The visible ab-sorption spectrum of NO3measured by high-resolution Fourier transform spectroscopy, J. Geophys. Res.-Atmos., 108, 4077, doi:10.1029/2002jd002489, 2003.
Osthoff, H. D., Pilling, M. J., Ravishankara, A. R., and Brown, S. S.: Temperature dependence of the NO3 absorption
cross-section above 298 K and determination of the equilibrium con-stant for NO3+NO2↔N2O5at atmospherically relevant
con-ditions, Phys. Chem. Chem. Phys., 9, 5785–5793, 2007. Osthoff, H. D., Roberts, J. M., Ravishankara, A. R., Williams, E. J.,
Lerner, B. M., Sommariva, R., Bates, T. S., Coffman, D., Quinn, P. K., Dibb, J. E., Stark, H., Burkholder, J. B., Talukdar, R. K., Meagher, J., Fehsenfeld, F. C., and Brown, S. S.: High levels of nitryl chloride in the polluted subtropical marine boundary layer, Nat. Geosci., 1, 324–328, 2008.
Phillips, G. J., Tang, M. J., Thieser, J., Brickwedde, B., Schus-ter, G., Bohn, B., Lelieveld, J., and Crowley, J. N.: Signifi-cant concentrations of nitryl chloride observed in rural conti-nental Europe associated with the influence of sea salt chloride and anthropogenic emissions, Geophys. Res. Lett., 39, L10811, doi:10.1029/2012GL051912, 2012.
Ravishankara, A. R. and Mauldin, R. L.: Temperature-Dependence of the NO3 Cross-Section in the 662-Nm Region, J. Geophys.
Richter, A., Burrows, J. P., Nuss, H., Granier, C., and Niemeier, U.: Increase in tropospheric nitrogen dioxide over China observed from space, Nature, 437, 129–132, 2005.
Riemer, N., Vogel, H., Vogel, B., Schell, B., Ackermann, I., Kessler, C., and Hass, H.: Impact of the heterogeneous hydrolysis of N2O5 on chemistry and nitrate aerosol formation in the lower
troposphere under photosmog conditions, J. Geophys. Res.-Atmos., 108, 4144, doi:10.1029/2002jd002436, 2003.
Sander, S. P.: Temperature-Dependence of the No3 Absorption-Spectrum, J. Phys. Chem.-US, 90, 4135–4142, 1986.
Schuster, G., Labazan, I., and Crowley, J. N.: A cavity ring down/cavity enhanced absorption device for measurement of ambient NO3 and N2O5, Atmos. Meas. Tech., 2, 1–13,
doi:10.5194/amt-2-1-2009, 2009.
Shardanand, S. and Rao, A. D. P.: Absolute Rayleigh scattering cross sections of gases and freons of stratospheric interest in the visible and ultraviolet regions, NASA Technical Note, Alabama, USA, 1977.
Simpson, W. R.: Continuous wave cavity ring-down spectroscopy applied to in situ detection of dinitrogen pentoxide (N2O5), Rev.
Sci. Instrum., 74, 3442–3452, 2003.
Slusher, D. L., Huey, L. G., Tanner, D. J., Flocke, F. M., and Roberts, J. M.: A thermal dissociatchemical ion-ization mass spectrometry (TD-CIMS) technique for the si-multaneous measurement of peroxyacyl nitrates and dini-trogen pentoxide, J. Geophys. Res.-Atmos., 109, D19315, doi:10.1029/2004jd004670, 2004.
Sneep, M. and Ubachs, W.: Direct measurement of the Rayleigh scattering cross section in various gases, J. Quant. Spectrosc. Ra., 92, 293–310, 2005.
Sobanski, N., Tang, M. J., Thieser, J., Schuster, G., Pöhler, D., Fischer, H., Song, W., Sauvage, C., Williams, J., Fachinger, J., Berkes, F., Hoor, P., Platt, U., Lelieveld, J., and Crowley, J. N.: Chemical and meteorological influences on the lifetime of NO3
at a semi-rural mountain site during PARADE, Atmos. Chem. Phys., 16, 4867–4883, doi:10.5194/acp-16-4867-2016, 2016. Tan, Z., Fuchs, H., Lu, K., Hofzumahaus, A., Bohn, B., Broch, S.,
Dong, H., Gomm, S., Häseler, R., He, L., Holland, F., Li, X., Liu, Y., Lu, S., Rohrer, F., Shao, M., Wang, B., Wang, M., Wu, Y., Zeng, L., Zhang, Y., Wahner, A., and Zhang, Y.: Radical chem-istry at a rural site (Wangdu) in the North China Plain: observa-tion and model calculaobserva-tions of OH, HO2and RO2radicals,
At-mos. Chem. Phys., 17, 663–690, doi:10.5194/acp-17-663-2017, 2017.
Thalman, R. and Volkamer, R.: Inherent calibration of a blue LED-CE-DOAS instrument to measure iodine oxide, glyoxal, methyl glyoxal, nitrogen dioxide, water vapour and aerosol ex-tinction in open cavity mode, Atmos. Meas. Tech., 3, 1797–1814, doi:10.5194/amt-3-1797-2010, 2010.
Tham, Y. J., Wang, Z., Li, Q., Yun, H., Wang, W., Wang, X., Xue, L., Lu, K., Ma, N., Bohn, B., Li, X., Kecorius, S., Größ, J., Shao, M., Wiedensohler, A., Zhang, Y., and Wang, T.: Significant concen-trations of nitryl chloride sustained in the morning: investigations of the causes and impacts on ozone production in a polluted re-gion of northern China, Atmos. Chem. Phys., 16, 14959–14977, doi:10.5194/acp-16-14959-2016, 2016.
Thornton, J. A., Kercher, J. P., Riedel, T. P., Wagner, N. L., Cozic, J., Holloway, J. S., Dubé, W. P., Wolfe, G. M., Quinn, P. K., Mid-dlebrook, A. M., Alexander, B., and Brown, S. S.: A large atomic
chlorine source inferred from mid-continental reactive nitrogen chemistry, Nature, 464, 271–274, 2010.
Varma, R. M., Venables, D. S., Ruth, A. A., Heitmann, U., Schlosser, E., and Dixneuf, S.: Long optical cavities for open-path monitoring of atmospheric trace gases and aerosol extinc-tion, Appl. Optics, 48, B159–B171, 2009.
Venables, D. S., Gherman, T., Orphal, J., Wenger, J. C., and Ruth, A. A.: High sensitivity in situ monitoring of NO3in an atmospheric
simulation chamber using incoherent broadband cavity-enhanced absorption spectroscopy, Environ. Sci. Technol., 40, 6758–6763, 2006.
Voigt, S., Orphal, J., and Burrows, J. P.: The temperature and pressure dependence of the absorption cross-sections of NO2
in the 250–800 nm region measured by Fourier-transform spec-troscopy, J. Photoch. Photobio. A, 149, 1–7, 2002.
Wang, D., Hu, R. Z., Xie, P. H., Liu, J. G., Liu, W. Q., Qin, M., Ling, L. Y., Zeng, Y., Chen, H., Xing, X. B., Zhu, G. L., Wu, J., Duan, J., Lu, X., and Shen, L. L.: Diode laser cavity ring-down spectroscopy for in situ measurement of NO3radical in ambient air, J. Quant. Spectrosc. Ra., 166, 23–29, 2015.
Wang, H. C., Chen, J., and Lu, K. D.: Measurement of NO3 and
N2O5in the Troposphere, Prog. Chem., 27, 963–976, 2015.
Wang, S. S., Shi, C. Z., Zhou, B., Zhao, H., Wang, Z. R., Yang, S. N., and Chen, L. M.: Observation of NO3radicals over Shanghai,
China, Atmos. Environ., 70, 401–409, 2013.
Wang, T., Tham, Y. J., Xue, L. K., Li, Q. Y., Zha, Q. Z., Wang, Z., Poon, S. C. N., Dubé, W. P., Blake, D. R., Louie, P. K. K., Luk, C. W. Y., Tsui, W., and Brown, S. S.: Observations of nitryl chlo-ride and modeling its source and effect on ozone in the planetary boundary layer of southern China, J. Geophys. Res.-Atmos., 121, 2476–2489, 2016.
Wang, X., Wang, T., Yan, C., Tham, Y. J., Xue, L., Xu, Z., and Zha, Q.: Large daytime signals of N2O5and NO3inferred at 62 amu
in a TD-CIMS: chemical interference or a real atmospheric phe-nomenon?, Atmos. Meas. Tech., 7, 1–12, doi:10.5194/amt-7-1-2014, 2014.
Wangberg, I., Etzkorn, T., Barnes, I., Platt, U., and Becker, K. H.: Absolute determination of the temperature behavior of the NO2+NO3+(M)↔N2O5+(M) equilibrium, J. Phys. Chem.
A, 101, 9694–9698, 1997.
Washenfelder, R. A., Langford, A. O., Fuchs, H., and Brown, S. S.: Measurement of glyoxal using an incoherent broadband cav-ity enhanced absorption spectrometer, Atmos. Chem. Phys., 8, 7779–7793, doi:10.5194/acp-8-7779-2008, 2008.
Washenfelder, R. A., Flores, J. M., Brock, C. A., Brown, S. S., and Rudich, Y.: Broadband measurements of aerosol extinction in the ultraviolet spectral region, Atmos. Meas. Tech., 6, 861–877, doi:10.5194/amt-6-861-2013, 2013.
Washenfelder, R. A., Attwood, A. R., Flores, J. M., Zarzana, K. J., Rudich, Y., and Brown, S. S.: Broadband cavity-enhanced ab-sorption spectroscopy in the ultraviolet spectral region for mea-surements of nitrogen dioxide and formaldehyde, Atmos. Meas. Tech., 9, 41–52, doi:10.5194/amt-9-41-2016, 2016.
Werle, P., Mucke, R., and Slemr, F.: The Limits of Signal Aver-aging in Atmospheric Trace-Gas Monitoring by Tunable Diode-Laser Absorption-Spectroscopy (Tdlas), Appl. Phys. B-Photo., 57, 131–139, 1993.
Yokelson, R. J., Burkholder, J. B., Fox, R. W., Talukdar, R. K., and Ravishankara, A. R.: Temperature-Dependence of the NO3