R E V I E W
Open Access
DNA Methylation Validation Methods: a
Coherent Review with Practical Comparison
Š
árka
Š
estáková
1,2, Cyril
Š
álek
1,2and Hana Reme
š
ová
2*Abstract
Here, we present a practical overview of four commonly used validation methods for DNA methylation assessment: methylation specific restriction endonucleases (MSRE) analysis, pyrosequencing, methylation specific high-resolution DNA melting (MS-HRM) and quantitative methylation specific polymerase chain reaction (qMSP). Using these methods, we measured DNA methylation levels of three loci in human genome among which one was highly methylated, one intermediately methylated and one unmethylated. We compared the methods in terms of primer design demands, methods’feasibility, accuracy, time and money consumption, and usability for clinical diagnostics.
Pyrosequencing and MS-HRM proved to be the most convenient methods. Using pyrosequencing, it is possible to analyze every CpG in a chosen region. The price of the instrument may represent the main limitation of this methodology. MS-HRM is a simple PCR-based method. The measurement was quick, cheap and very accurate. MSRE analysis is based on a methylation specific digestion of DNA. It does not require a bisulfite conversion of DNA as the other methods. MSRE analysis was very easy to perform, however, it was not suitable for intermediately methylated regions and it was also quite expensive. qMSP is a qPCR-based method that uses primers designed specifically for methylated and unmethylated alleles of a chosen region. This was the least accurate method and also the primer design and optimization of PCR conditions were highly demanding.
Keywords:DNA methylation, Validation methods, MSRE, Pyrosequencing, MS-HRM, qMSP
Background
DNA methylation plays a fundamental role in many crucial biological processes such as embryonic development, gene imprinting, and gene expression regulation. In mammals, the DNA methylation occurs almost exclusively in CpG di-nucleotides where a methyl group is attached to the fifth carbon of cytosine base, creating 5-methylcytosine. The biological effect of DNA methylation depends not only on its presence or absence but mainly on its exact location in the genome [1]. Aberrant DNA methylation has been proved as an inducing mechanism in many cancers and is connected to other complex disorders (e.g. diabetes and cardiovascular diseases, neurodegenerative and psychiatric disorders) [2]. Therefore, DNA methylation profiles are ex-amined as biomarkers for diagnosis, prognosis, treatment response and disease monitoring [3,4].
Nowadays, there is a rapid expansion of high-throughput methods for DNA methylation assessment with single-base resolution. Array techniques can examine as much as 850,000 CpGs at once [5] and all CpG sites, over 28 million in human genome [6], can be analyzed using whole-genome bisulfite sequencing. These methods provide not only an overview of the methylation status of a certain genome, but also a methylation level of each stud-ied CpG. Despite the advantages of these genome-wide ap-proaches, it is still essential to have a proper technique for validation of DNA methylation results for chosen loci. The ideal validation method should be sensitive, quick, cost ef-fective and suitable for screening of large sets of clinical samples to acquire statistically significant data.
In this review, we assessed the methylation status of cer-tain CpGs using four most common methods for DNA methylation validation. These methods were: quantitative PCR with prior digestion by methylation specific restric-tion endonucleases (MSRE), pyrosequencing, methylarestric-tion specific high-resolution DNA melting (MS-HRM) analysis, and quantitative methylation specific polymerase chain
© The Author(s). 2019Open AccessThis article is distributed under the terms of the Creative Commons Attribution 4.0 International License (http://creativecommons.org/licenses/by/4.0/), which permits unrestricted use, distribution, and reproduction in any medium, provided you give appropriate credit to the original author(s) and the source, provide a link to the Creative Commons license, and indicate if changes were made. The Creative Commons Public Domain Dedication waiver (http://creativecommons.org/publicdomain/zero/1.0/) applies to the data made available in this article, unless otherwise stated. * Correspondence:[email protected]
2Institute of Hematology and Blood Transfusion, Prague, Czech Republic
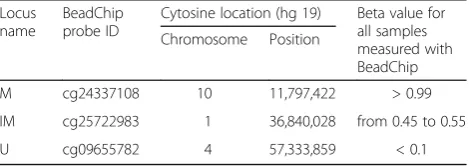
reaction (qMSP). For proper evaluation of each method, we selected 3 distinct CpG sites within the human genome that were > 99% methylated (methylated “M” locus), around 50% methylated (intermediately methylated “IM” locus), and < 1% methylated (unmethylated“U”locus).
Overview of Evaluated Validation Methods Methods Based on DNA Digestion by MSRE
Restriction methods for quantification of DNA methyla-tion are simple, rapid and do not require bisulfite conver-sion of DNA. Selective digestion of DNA by methylation specific restriction enzymes (HpaII, AatII, ClaI, etc.) was historically the first method used for assessing DNA methylation levels [7]. High specificity is characteristic for this method, however, only the specific restriction sites can be analyzed which is an important limitation.
The analysis is based on a selective DNA cleavage by MSRE which will not cut its restriction site when a methylated cytosine is present. The most frequently used enzyme is HpaII with recognition sequence CCGG. It is also possible to use a pair of isoschisomeric enzymes, where one is methylation sensitive and the other is not. Most common pair is HpaII/MspI where MspI also cleaves CCGG sequence but regardless of its methylation status. In older protocols, resulting fragments were ana-lyzed on a gel or by a southern blot and the location of methylated sites was estimated from the fragments’sizes [8, 9]. Newer approaches employ quantitative PCR (qPCR) [10]. In order to determine methylation of a spe-cific region, DNA is digested by MSRE and subsequently analyzed with qPCR using primers surrounding the se-quence of interest. Methylation percentage is counted from threshold cycles (Ct) measured for digested and
undigested control DNA. For this approach, it is possible to buy easy-to-use commercial kits with mixes of MSREs to target more sites, e.g. OneStep qMethyl kit from Zymo Research [11].
Primers can be easily designed with free online software such as Primer3Plus [12] (http://www.bioinformatics.nl/cgi-bin/primer3plus/primer3plus.cgi) or Primer-BLAST [13] (https://www.ncbi.nlm.nih.gov/tools/primer-blast/). How-ever, it is required that at least two restriction sites are in-side the amplicon to reliably measure the DNA methylation. Thus, it is not possible to investigate the methylation level of only one particular CpG site.
Methods Requiring Bisulfite Converted DNA
Bisulfite (BS) conversion of DNA is a crucial step in most DNA methylation analyses. Already in 1970, it was discovered that sodium bisulfite mediates the deamin-ation of cytosine into uracil while the methylated cyto-sine is left intact [14]. After PCR amplification, the converted residues are read as thymines and methylated cytosines will remain cytosines. It is important to note
that after BS conversion the DNA strands are no longer complementary. This must be kept in mind when choos-ing a method for quantification of BS converted DNA.
The reliability of methylation analysis is dependent on a complete BS conversion. Unconverted cytosines, if present, would be mistaken for methylated loci and the analysis will produce biased results. Formerly, the conversion method required a high DNA input and exposure to high bisulfite salt concentration under high temperatures and low pH. These harsh conditions resulted in significant DNA frag-mentation and loss [15]. Nowadays, there is a wide variety of commercial kits available that are able to convert as low as 100 pg of DNA in less than 2 h. These kits, nice compari-son is available here [16], use convenient column system and guarantee more than 99% conversion efficiency.
Pyrosequencing
Pyrosequencing is a sequencing method used for quanti-tative methylation analysis of bisulfite converted DNA. For its relative simplicity, speed and comparable results, pyrosequencing can be preferred to cloning [17], a method used as a gold standard for identification of al-lele specific methylation patterns [18]. Another advan-tage of pyrosequencing is that it is suitable for both CpG poor and CpG rich regions. Main drawback of this method is that only shorter regions (maximum 350 bp) can be analyzed. However, this disadvantage can be overcome by using more sequencing primers on one amplicon or by a serial pyrosequencing [19,20].
Pyrosequencing process can be divided into three steps: (i) PCR amplification and tagging using a biotinylated pri-mer, (ii) isolation of the PCR product with streptavidin beads and hybridization with a sequencing primer, and (iii) sequencing. During the sequencing step, nucleotides are added in a predefined order depending on the sequence of interest. The technology is based on a release of pyro-phosphate (PPi) during nucleotide incorporation when complementary to the template DNA strand (the purified PCR product). An ATP sulfurylase then uses PPi and ad-enosine phosphosulfate to produce ATP. ATP is utilized by luciferase which converts luciferin to oxyluciferin. The in-tensity of produced light is detected and translated as a peak on a pyrogram [21]. Methylation percentage is then calculated from the ratio of heights of a cytosine peak (methylated signal) and the sum of cytosine and thymine peaks (methylated and unmethylated signal) for each cyto-sine in a CpG dinucleotide.
thus a decrease of the signal. At the same time, the back-ground signal rises during the sequencing due to an in-complete degradation of previously added nucleotides [21]. Because of that, a signal measured after 90–100 cy-cles has low quality and the results are not credible [20].
Having a strong amplicon with no side product, and therefore a high-quality primer design, is crucial for this assay. One way is to order the primers from commercial companies. For example, Qiagen offers a full assay design for desired regions and it is also possible to buy a prede-signed primer set. The other option is to use a free soft-ware for bisulfite primer design such as MethPrimer [22] (http://www.ucsf.edu/urogene/methprimer/index1.html), Bisearch [23] (http://bisearch.enzim.hu/) or MethylPrimer Express by Applied biosystems (http://www.appliedbiosys tems.com/methylprimerexpress). Moreover, it is important to check for potential primer dimers formation or self-complementarity of the primers, e.g. with Multiple Pri-mer Analyzer (https://www.thermofisher.com/cz/en/home/ brands/thermo-scientific/molecular-biology/molecular-biol-ogy-learning-center/molecular-biology-resource-library/ thermo-scientific-web-tools/multiple-primer-analyzer.html). Primers should be 15–30 bp long (20 bp is optimal) with a melting temperature between 50 and 69 °C (optimally 60 °C) [24]. There should be at least four non-CpG cyto-sines in each primer to assure that only a properly BS con-verted DNA will be amplified. Presence of a CpG and therefore a use of a degenerated primer in not recom-mended because it may lead to a preferential amplification of a specific subset of molecules [21]. However, in some of our previous experiments we used degenerated primers without any difficulties. One of the PCR primers must be labeled on its 5’end by biotin and this primer should be purified by HPLC or an equivalent procedure to assure zero contamination by free biotin molecules. The orienta-tion of a sequencing assay depends on which primer is tagged. It is also essential to incorporate all biotinylated primers into amplicons during the PCR step. Otherwise, these primers might compete with the amplicons during the streptavidin binding. It is recommended to use 0.1μM biotinylated primer and 0.2μM unlabeled primer concen-trations and 45–50 PCR cycles. It is also possible to use a universal biotinylated primer and a tailed reverse primer in 5:(0.01–1) ratio [20,25]. The use of a universal biotinylated primer significantly reduces the costs when having more pyrosequencing assays for various regions. On the other hand, it sometimes requires deeper PCR optimization to gain a sufficient amount of the PCR product. The amount and size of the amplified PCR product as well as a negative PCR control should be always checked by an agarose gel electrophoresis to prevent further complications.
Sequencing primer should be 15–20 bp long with a melting temperature between 45 and 55 °C. The most relevant part of the primer are the last four or five bases
on the 3’end which should be unique in the amplicon. Also, it is not recommended to use the non-biotinylated PCR primer as a sequencing primer. The sequencing pri-mer should differ from the PCR pripri-mer in at least one additional nucleotide on the 3’end [21]. Nevertheless, we tried to use the non-biotinylated primer as a sequencing primer in some of our previous experiments and the py-rosequencing was successful.
A set of assay validation reactions, listed in appendix B of PyroMark Q24 User Manual 2016, should be always performed before using the assay to analyze samples. These controls are (i) PCR reaction without template DNA, (ii) PCR product without sequencing primer, (iii) sequencing primer without PCR product, (iv) biotinyl-ated primer without PCR product, and (v) sequencing primer and biotinylated primer together without PCR product. Moreover, in each assay, controls of BS conver-sion should be included in the dispensation order [21]. The BS conversion ratio can be evaluated when a dis-pensation of cytosine nucleotides is incorporated before or after thymines which are supposedly converted cyto-sines in the sequence. In case of an unsuccessful BS con-version, peaks would appear in the pyrogram for these additional dispensations.
Methylation Specific HRM Analysis
MS-HRM is a method based on different melting tem-peratures (Tm) of methylated and unmethylated DNA.
Tm is defined as a temperature at which the two DNA
strands dissociate and is characterized by a sudden drop of fluorescence signal due to a release of an intercalating dye, e.g. SYBR Green, EvaGreen or SYTO9. Tmdepends
on the DNA base composition because CG base pairs are connected by three hydrogen bonds and AT pairs only by two. This also enables to differentiate between methylated and unmethylated DNA after a BS conver-sion where the unmethylated cytosines are converted to uraciles and after PCR changed to thymines.
standards [28]. Another method estimates the methyla-tion level by using two sets of primers, methylated and unmethylated, for amplification. A differential melting profile is then calculated by normalizing the methylated HRM profile against the unmethylated. The differential fluorescence peak heights are then plotted against the dilution factor which generates a linear calibration curve [29]. Another approach uses peak heights and area under the curve (AUC) of normalized and temperature shifted first derivatives of HRM curves. There is a linear dependency between these values and the methylation percentage [27].
For MS-HRM analysis, the only requirement are primers surrounding the region with CpGs of interest. It is again crucial to obtain a pure PCR product. Primers should be between 15 and 30 bp long with similar melting tempera-tures around 65 °C. This will allow to run the PCR at ap-proximately 60 °C which is important for the method’s specificity [30]. Generally, for this type of primers that sur-round the region of interest, it is not advised to have a CpG inside the primer. However, Wojdacz et al. have shown that inclusion of a CpG in the primer sequence can compensate the PCR bias towards unmethylated alleles and thus signifi-cantly increase the method’s sensitivity [30, 31]. They also claim that MS-HRM is taken as a method to assess methy-lation levels and therefore a slight bias towards the methyl-ated sequences further increases the method’s sensitivity [32]. According to their recommendations, the primers should contain one or two CpG dinucleotides as close to their 5’end as possible [33]. It is necessary to have several thymines, corresponding to unmethylated cytosines, in-cluded in the primer sequence to amplify only properly converted DNA. It is also advisable to check for primer di-mers and loops formation. The amplicon should be kept small, around 100 bp, to reduce the complexity of its melt-ing profile [32]. Nevertheless, it should be considered that a shorter PCR product gives higher sensitivity but limited resolution between methylation levels because of only small difference between methylated and unmethylated DNA. Longer amplicons have more distinguishable methylation profiles [26].
Methylation Specific PCR
In this methodology, DNA methylation is examined by two sets of primers where one is specific for a methyl-ated state (Met) and the other pair for an unmethylmethyl-ated state (Unm) of a certain genomic locus. A set of two PCR reactions is performed and the products are ana-lyzed via a gel electrophoresis [34].
Despite the relative simplicity of this method, finding convenient methylated and unmethylated primers is sometimes challenging. The primers are designed to span the analyzed region and should contain from one to three CpGs ideally located at the 3’end of the primer. Therefore,
this method is more suitable for CpG rich regions, like CpG islands. There should be again at least five thymines, BS converted unmethylated cytosines, included in the se-quence to assure that only a properly BS converted DNA will be amplified [16]. Primers length should be at least 23 bp with melting temperature between 55 and 65 °C. It is recommended that Met and Unm primers have similar melting temperatures. To achieve that, it is often needed to prolong the Unm primer on the 5’end because the BS conversion decreases the Tmof unmethylated DNA [35].
The above-mentioned software for finding bisulfite primers for pyrosequencing or MS-HRM can be also used for designing MSP primer sets.
During the PCR, the number of amplification cycles should not exceed 35 because after that a false methyla-tion signal could appear. It is also crucial to use such an-nealing temperature (Tann) that the primers are specific
for the DNA methylation status they were designed for [35]. Thus, it is essential to perform proper control reac-tions in each new MSP experiment such as PCR with both methylated and unmethylated standards, no template con-trol and PCR with non-converted DNA [16].
For a long time, this method was only qualitative. As a result of the electrophoresis, it was possible to recognize that only methylated or unmethylated locus or both loci were amplified. Previous studies did not find any clear correlation between the size of the band on the gel and the amount of DNA examined. Nevertheless, this does not compromise the great sensitivity of this method [16]. Newer protocols employ quantitative PCR and make this method semiquantitative or quantitative. For example, for establishing unmethylated DNA, qPCR is performed with Unm primers together with bisulfite specific primers (BSP) that amplify chosen locus independently of its methylation status. The ratio of unmethylated alleles to total number of amplified molecules is then calculated by either classicalΔΔCtapproach with or without correction
for primers efficiency [36] or by a demethylation index, as proposed in another study [37]. Apart from using simple qPCR with an intercalating dye, a quantitative method called MethylLight was developed. It uses a pair of methy-lation specific TaqMan probes where each probe, designed for either methylated or unmethylated DNA, is tagged with different fluorophore [38]. When using quantitative MSP approaches, it is advisable to perform a melt analysis after the PCR to check for any side products [35].
Results and Discussion MSRE Analysis
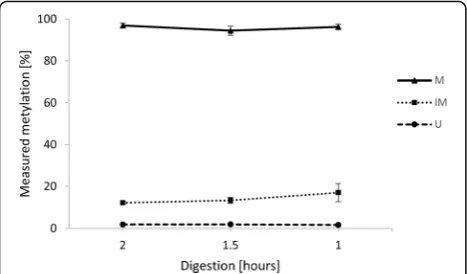
whether it will increase the methods accuracy for the IM locus. The recommended digestion time was 2 h, so we additionally tried 1.5-h and 1-h digestions. There was no statistically significant difference in DNA methylation levels measured after various digestion times. We achieved only a slight improvement for the IM locus, where the cal-culated methylation percentage rose from 12 to 17% when the digestion time was shortened to 1 h. The methylation levels for M and U loci remained the same. The results for all three loci are shown in Fig.1. Based on these results, we propose that a shorter digestion time may be used to make the MSRE method faster while retaining the original results.
Pyrosequencing
In the pyrosequencing procedure, the most important step for a successful analysis is gaining a strong amplicon. However, even when we detected a strong band on our agarose gel after the PCR, we did not achieve the desirable signal during pyrosequencing. Thus, we tried to enhance the binding of the amplified, biotin-labeled PCR product by adding more streptavidin beads into the process. We compared the results after adding 1, 2 and 3μl of strepta-vidin beads per sample. The 2μl proved to be ideal for gaining the strongest signal on the pyrogram. Additionally, we prolonged the agitation step to 20 min to increase the number of bound molecules. Also, we noticed that after the agitation, it is essential to proceed immediately to the next step to ensure that the beads are resuspended in the tube and will be taken up efficiently by the probes in the subsequent procedure. According to the manufacturer, for accurate results the peak height of a single base should be at least 40 units in the pyrogram. From our experience, ex-periments where single based peaks are at least 25 units high give reliable results. Nevertheless, when a strong amplicon was acquired, judging by the results of the
agarose gel electrophoresis, the peak height of a single base was always around 50–200 units.
In the resulting pyrograms, it was obvious that the sig-nal starts dropping significantly after 45th dispensation cycle which roughly corresponds to a 100 bp region. This is in accordance with the recommendations for this method to keep the studied region short [20].
In our experiments, we measured four CpGs in the M locus and all were highly methylated (95.4 ± 3.1%). In the U locus, we measured three CpGs and all were unmethylated (7.4 ± 3.1%). There were only two CpGs in the IM locus. The IM CpG chosen from the Infinium MethylationEPIC BeadChip data was indeed intermedi-ately methylated 58.5 ± 7.3%. However, the next CpG in-cluded in the sequenced amplicon was rather unmethylated 18.4 ± 3.8%. The final average methylation of the studied region was thus around 37%. This demon-strates the main advantage of the pyrosequencing method which is the base resolution. The other quite beneficial aspect of pyrosequencing is the bisulfite con-version control which allows us to see whether the BS conversion was done properly [21]. We always included at least three of these BS control dispensations in our pyrosequencing assays.
MS-HRM
Wojdacz et al. have shown that inclusion of a CpG to the primer sequence can compensate the PCR bias of unmethylated alleles by favoring amplification of methyl-ated alleles [32]. Thus, we designed two sets of HRM primers for the M and U loci. One primer set did not in-clude any CpGs in its sequence. The other set was de-signed according to Wojdacz et al. [30] and each primer had one or two CpGs on its 5’end. It was not possible to design Wojdacz HRM primers for the IM region because of its CpG shortage. Sequences of the primers are listed in Table1.
From acquired MS-HRM data, we constructed calibra-tion curves as proposed by Tse et al. [27] for every pri-mer set. The correlation coefficients (R2) for peak height-based calibration curves together with calculated methylation levels for each locus are summarized in Table 2. The AUC-based calibration curves had slightly lower correlation coefficients. This was probably caused by less exact AUC calculations performed in Excel which we used to keep the data analysis as simple as possible. Still, the AUC-based DNA methylation assessment gave similar results as the peak height approach (see Additional file1).
Interestingly, the results in Table 2 show that the Wojdacz’s improvement of primers’ sequence was quite beneficial for the U region. However, it caused a deviation in measurements of the M region result-ing in worse R2 of the calibration curve and lower
calculated methylation levels. It is thus not so straightforwardly beneficial to introduce the CpGs into primers’ sequence. Gaining the optimal results
apparently require additional thorough Ta
optimization to achieve equal amplification of meth-ylated and unmethmeth-ylated alleles with Wojdacz’s primers [26]. Nevertheless, with all primer sets, the methylation levels of all three loci were measured accurately enough.
qMSP
We designed both Met and Unm primer sets for each locus to perform the qMSP experiments. Reassuringly, in all investigated samples, the M locus was amplified only by Met primers, the U locus only by Unm primers and the IM locus was amplified by both Met and Unmet primer sets. Regarding the DNA methylated and unmethylated standards, all three loci were always amplified only by the corresponding Met or Unm primer set. The HRM primers were used as BSP, amplifying the region independently of its methylation status. Summary of Ct values and
mea-sured efficiencies for all primer sets is shown in Table3. We were not able to measure the efficiency for IM Unm primer set properly. The deviation between duplicates was higher probably because the efficiency of the primer set was low and the amplification of the first dilution began always after 34th cycle. The measurement was thus less reliable despite the fact that the resulting calibration curve hadR2> 0.99. Therefore, we tried to count the efficiency of MSP primers based on Ct values measured for
stan-dards and an assumption that BSP primers have 100% effi-ciency. We used the following equation Ec¼100∙C
BSP t CMSP
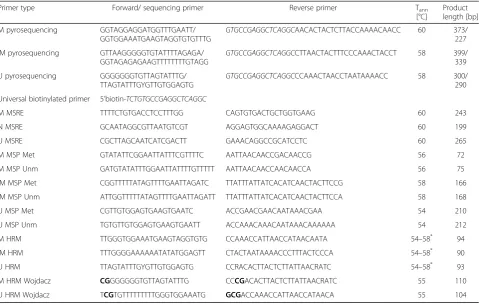
t . Table 1Primer sequences and characteristics
Primer type Forward/ sequencing primer Reverse primer Tann
[°C]
Product length [bp]
M pyrosequencing GGTAGGAGGATGGTTTGAATT/ GGTGGAAATGAAGTAGGTGTGTTTG
GTGCCGAGGCTCAGGCAACACTACTCTTACCAAAACAACC 60 373/
227
IM pyrosequencing GTTAAGGGGGTGTATTTTAGAGA/
GGTAGAGAGAAGTTTTTTTTGTAGG GTGCCGAGGCTCAGGC
CTTAACTACTTTCCCAAACTACCT 58 399/
339
U pyrosequencing GGGGGGGTGTTAGTATTTG/ TTAGTATTTGYGTTGTGGAGTG
GTGCCGAGGCTCAGGCCCAAACTAACCTAATAAAACC 58 300/
290
Universal biotinylated primer 5’biotin-TCTGTGCCGAGGCTCAGGC
M MSRE TTTTCTGTGACCTCCTTTGG CAGTGTGACTGCTGGTGAAG 60 243
N MSRE GCAATAGGCGTTAATGTCGT AGGAGTGGCAAAAGAGGACT 60 199
U MSRE CGCTTAGCAATCATCGACTT GAAACAGGCCGCATCCTC 60 265
M MSP Met GTATATTCGGAATTATTTCGTTTTC AATTAACAACCGACAACCG 56 72
M MSP Unm GATGTATATTTGGAATTATTTTGTTTTT AATTAACAACCAACAACCA 56 75
IM MSP Met CGGTTTTTATAGTTTTGAATTAGATC TTATTTATTATCACATCAACTACTTCCG 58 166
IM MSP Unm ATTGGTTTTTATAGTTTTGAATTAGATT TTATTTATTATCACATCAACTACTTCCA 58 168
U MSP Met CGTTGTGGAGTGAAGTGAATC ACCGAACGAACAATAAACGAA 54 210
U MSP Unm TGTGTTGTGGAGTGAAGTGAATT ACCAAACAAACAATAAACAAAAAA 54 212
M HRM TTGGGTGGAAATGAAGTAGGTGTG CCAAACCATTAACCATAACAATA 54–58* 94
IM HRM TTTGGGGAAAAAATATATGGAGTT CTACTAATAAAACCCTTTACTCCCA 54–58* 90
U HRM TTAGTATTTGYGTTGTGGAGTG CCRACACTTACTCTTATTAACRATC 54–58* 93
M HRM Wojdacz CGGGGGGGTGTTAGTATTTG CCCGACACTTACTCTTATTAACRATC 55 110
U HRM Wojdacz TCGTGTTTTTTTTTGGGTGGAAATG GCGACCAAACCATTAACCATAACA 55 104
*
For MS-HRM experiments Tannwas 55 °C, in qMSP experiments Tannof MSP primers was used
Mmethylated locus,IMintermediately methylated locus,Uunmethylated locus,MSPmethylation specific PCR,Metprimers for methylated DNA sequence,Unm
primers for unmethylated DNA sequence,HRMhigh resolution melting analysis,Tannannealing temperature
Table 2Correlation coefficients for peak height-based MS-HRM calibration curves and counted methylation levels
Locus name Primer set R2 Methylation [%] (n= 10)
± SD
M M HRM 0.952 93.61 5.28
M M HRM Wojdacz 0.798 85.49 5.13
IM IM HRM 0.973 29.20 4.71
U U HRM 0.868 2.69 1.04
U U HRM Wojdacz 0.938 0.57 0.81
This counted efficiency corresponded well with the mea-sured efficiency (Table3) and we used it in the subsequent analysis for the IM Unm primer set.
We analyzed our data using all three approaches reviewed by Housseiny et al. [36]. The relative expres-sion ratio method, developed originally by Pfaffl [39], gave very variable results with extremely high standard deviation and thus was not reliable (see Additional file2). The other approaches, demethylation index and ΔΔCt,
gave quite similar results, reviewed in Table 4. The M locus was highly amplified by the MSP Met primers. The seemingly double amplification of MSP primers compared to BSP primers indicated byΔΔCt≅2 is
prob-ably caused by the method’s inaccuracy because when we repeated the experiment with five samples, the ΔΔCt
results were 1.5 ± 0.3. TheΔΔCt results for U locus were close to 1, meaning that the number of molecules ampli-fied by MSP Unm and BSP primer set was comparable. Regarding the IM locus, the MSP Unm primers ampli-fied around half of the molecules in comparison with the BSP primers, which corresponds with the expected intermediate methylation level of this locus. However, the results of MSP Met primers were spoiled by the dis-proportionately high Ct measured for the methylated
DNA standard resulting in a very low ratio of molecules amplified by MSP Met primers in the samples. This could be caused by a higher affinity of Met primers to the methylated DNA standard, compared to samples’ DNA that was rather unmethylated in the IM region.
Overall Methods Comparison
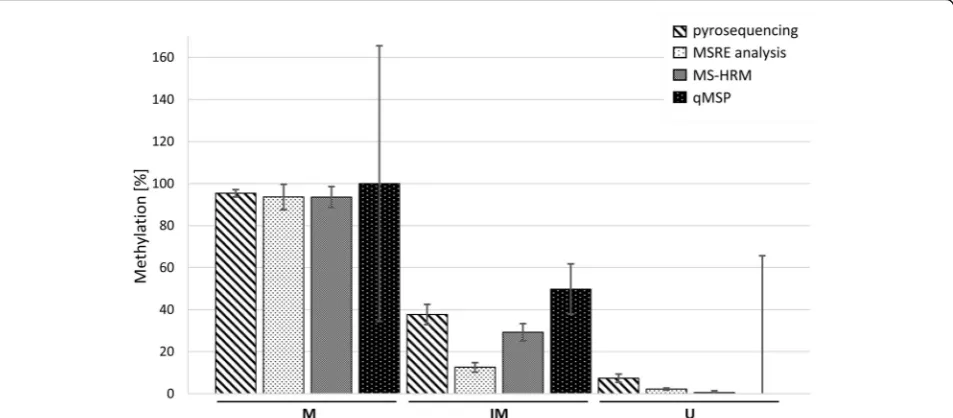
The final results of DNA methylation levels measured by all four methods are shown in Fig. 2. All methods were comparable and correlated with each other with
R2 > 0.92 and p-value < 1.2·10−17, except the qMSP method results of which were spoiled by extreme standard deviations. We also provide a review of all costs and mea-surements for each method in Table 5and a final evalu-ation of few other parameters in Table6.
Indisputably, pyrosequencing has most advantages in terms of the DNA methylation assessment of a specific locus. Primer design and interpretation of the results is straightforward with available software. Only the PCR step may require some optimization for gaining a sufficient amplicon but this is not always necessary. A disadvantage of this method may be the relatively high price of the in-strument. Also, the method is more time consuming be-cause it comprises three steps: PCR, gel electrophoresis and sequencing itself. This also corresponds with the higher price per one measurement.
When the pyrosequencing instrumentation is unavail-able, we recommend using MS-HRM. The primer de-sign is feasible for most regions. In our experiment, we had a CpG poor region (IM) as well as CpG dense re-gions (M and U) and were able to design reliable sets of primers for both. As we discussed in the chapter about the results from MS-HRM, deep optimization of primers’ sequence and Tann is not needed for method
resolution of 5–10%. This method is very simple as well as cost and time effective. The approximate results can be derived immediately from the melting curves. The exact quantification is not so straightforward when a specific software is not provided. Nevertheless, the cal-culations can be done using free software and Excel, as we have shown.
The MSRE analysis proved to be a quick and simple method. The main advantage of this approach is that it does not require the BS conversion of DNA. Thus, less DNA is needed to perform the analysis and it also makes the primer design easier. We were able to accurately measured the DNA methylation in M and U regions. Obviously though, the method is not suitable for inter-mediately methylated loci. Even by shortening the Table 3qMSP Ctvalues and primers’efficiencies
Locus and used primer set
Average Ctof samples (n= 10) Ctof standards Efficiency
MSP ± SD BSP ± SD MSP BSP MSP measured MSP counted BSP measured
M Met 23.18 0.52 22.88 0.27 24.01 22.70 96.47 94.57 83.00
IM Met 34.54 1.23 24.33 0.35 29.23 24.51 81.13 83.85 94.78
IM Unm 32.21 0.50 24.33 0.35 31.99 25.15 125.80 78.63 94.78
U Unm 37.36 0.80 23.04 0.20 37.95 23.40 65.93 61.66 90.52
Mmethylated locus,IMintermediately methylated locus,Uunmethylated locus,Metprimers for methylated DNA sequence,Unmprimers for unmethylated DNA sequence,MSPmethylation specific primers,BSPbisulfite specific primers (methylation independent),SDstandard deviation.
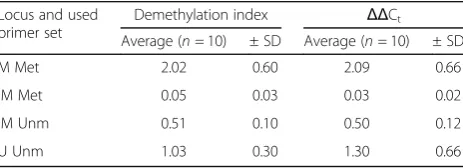
Table 4Summary of qMSP methylation results calculated using demethylation index andΔΔCtapproach
Locus and used primer set
Demethylation index ΔΔCt
Average (n= 10) ± SD Average (n= 10) ± SD
M Met 2.02 0.60 2.09 0.66
IM Met 0.05 0.03 0.03 0.02
IM Unm 0.51 0.10 0.50 0.12
U Unm 1.03 0.30 1.30 0.66
digestion time to half of that recommended, the mea-sured DNA methylation of IM locus remained signifi-cantly lower than expected. Also, the method is very costly when compared to the other three.
The last method evaluated was qMSP and this caused the most difficulties. The primer design was quite challen-ging and nearly impossible for the IM locus because of its lack of CpGs. Another issue was to find a suitable Tannat
which both Met and Unm primer sets were specific only for the methylated or unmethylated allele respectively but still functional so that it amplified the corresponding DNA standard. When we finally achieved this, the primers had very low efficiency, except for the M Met primer set. Moreover, the exact quantification of measured data was difficult and the results of the M and U loci had extremely high standard deviations within the samples. This method,
Fig. 2Summary of DNA methylation levels measured by the investigated methods. The average methylation of 10 samples is shown, the error bars represent the SD. Displayed MSRE data were measured after 2-h digestion. Displayed MS-HRM data were acquired using HRM M, HRM IM and HRM U Wojdacz primers. qMSP data shown were calculated usingΔΔCtapproach and multiplied by 100 to gain the percentage. For the M
locus in qMSP, all values were higher than 100% so we set the mean to 100% to make the figure more comprehensible, the SD was calculated from the original values multiplied by 100. For the IM and U loci in qMSP, we calculated the methylation percentage as 1-(UnmΔΔCt), the SD
was also calculated from the originalΔΔCtvalues multiplied by 100. M–methylated locus, IM–intermediately methylated locus, U–
unmethylated locus
Table 5Costs summary of each method
Method Total cost of analysis [$]
Number of samples measured Number of standards measured
Total number of measurements
Cost per measurement [$]
MSRE analysis 576 10 for each locus*, Test and Reference reaction, duplicates
2 for each locus*, duplicates 144 4
pyrosequencing 162‡ 10 for each locus* 2 for each locus* 36 4.5
MS-HRM 85 10 for each locus*, duplicates 6 for each locus*, duplicates 96 0.9
qMSP 196 10 for each primer set†, duplicates 2 for each primer set†, duplicates 216 0.9
*
Number of loci = 3
†Number of MSP/HRM primer sets for each locus = 3 ‡price of the pyrosequencing instrument ca 45,000 $
Table 6Overall evaluation of tested methods
Method Base resolution Consistency across methylation levels
Analysis of acquired data
Method optimization
Time consumption
Price
MSRE analysis – * * * * ***
Pyrosequencing + *** * * *** **
MS-HRM – *** ** */**(if needed) * *
qMSP – ** *** *** ** **
despite of its simplicity, is also quite expensive because it requires amplification of a chosen region by at least one MSP primer set and BSP primers.
Conclusion
Even in the era of arrays and next-generation sequencing, it is essential to have a method for validation of acquired DNA methylation data. A quick, cost-effective, and reli-able method that would enreli-able to confirm or reject a po-tential clinical significance of certain methylation changes and could be used in common laboratory practice is still needed.
We tested four standard methods that are used for DNA methylation validation: MSRE analysis, pyrosequencing, MS-HRM and qMSP. In terms of overall feasibility, ob-tained DNA methylation information and consistency across various methylation levels, we consider pyrosequenc-ing and MS-HRM approaches as the most suitable. Pyrose-quencing enables base resolution and thus acquisition of a methylation level for each CpG in the region, an indisput-able benefit. MS-HRM can be also designed to investigate a single CpG locus when needed. Otherwise, it provides an overall DNA methylation status of all CpGs inside the stud-ied region. Apparently, MSRE and qMSP are not very applicable for the detection of intermediate levels of DNA methylation. Nonetheless, MSRE does not require BS con-version of DNA and as we showed here, the digestion time can be shortened to one half. This makes the MSRE ana-lysis the simplest and fastest out of the four methods com-pared. The qMSP approach proved to be quite imprecise and demanding so it may be more convenient to keep this method only as a qualitative tool.
Materials and Methods Characterization of Analyzed CpGs
The three analyzed CpGs with different levels of methyla-tion were selected based on healthy donors’ data from Infinium MethylationEPIC BeadChip (Illumina, San Diego, CA, USA) acquired in our previous work [40]. Characteristic of chosen loci is summarized in Table 7. These CpG dinucleotides were also chosen so that they are within CCGG sequence to enable their cutting by MSRE.
Samples and DNA Standards
This study was approved by the Institutional Ethics Committee and all blood donors provided their full con-sent. Mononuclear cells of ten healthy blood donors were harvested from buffy coats by Ficoll gradient cen-trifugation (Histopaque, Sigma-Aldrich, St.Louis, MO, USA). DNA was extracted using MagCore system (RBCBioscience, New Taipei City, Tchaj-wan). Human Methylated & Non-methylated DNA Set (Zymo Re-search, Irvine, CA, USA) was used as methylated and unmethylated standards.
MSRE Analysis
OneStep qMethyl Kit (Zymo Research) was used for MSRE analysis. For each sample, DNA (20 ng) was proc-essed through the Test and Reference reactions according to the manufacturer’s protocol. In the PCR step, Tannwas
set to 60 °C and annealing time was shortened to 45 s. Rotor-Gene Q 2plex HRM Platform (Qiagen, Hilden, Germany) was used to perform the measurements.
Bisulfite Conversion
DNA (500 ng) was treated with bisulfite using EZ DNA Methylation-Lightning Kit (Zymo Research). For MS-HRM and qMSP experiments, the concentration of BS converted DNA was measured by NanoDrop™One/OneC Microvolume UV-Vis Spectrophotometer (Thermo Fisher Scientific, Waltham, MA, USA) and then adjusted to 10 ng·μl−1.
Primer Design
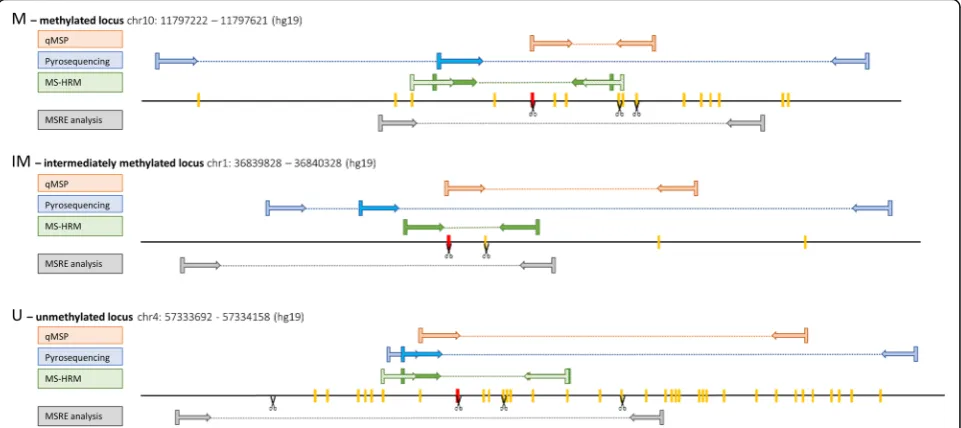
For MSRE analysis, online software Primer3Plus (http:// www.bioinformatics.nl/cgi-bin/primer3plus/primer3plus. cgi) was used. For methods that require BS converted DNA, we used Methyl Primer Express Software v1.0 (Thermo Fisher Scientific). For primers’ sequences and characteristics see Table 1. Positions of all primer pairs within the studied regions are shown in Fig.3.
Pyrosequencing
BS converted DNA (10–20 ng) was first amplified using HotStar HiFidelity Polymerase Kit (Qiagen) with final 2.5 mM MgCl2concentration. To increase primers’
spe-cificity and for easy gel loading, we added CoralLoad Concentrate from PyroMark PCR kit (Qiagen) to the final concentration of 1x. The final concentration of forward and universal biotinylated primer was 0.2μM. The final concen-tration of reverse tailed primer was 0.04μM. We used rec-ommended PCR reaction conditions for PyroMark PCR with 48 PCR cycles and Tannaccording to Table1.
Ampli-con quality (1μl of PCR reaction) was checked using 2% agarose gel electrophoresis. Pyrosequencing was performed on PyroMark Q24 instrument (Qiagen). Pyrosequencing protocol (User Manual 01/2016) was optimized by adding Table 7Specifications of selected CpG sites
Locus name
BeadChip probe ID
Cytosine location (hg 19) Beta value for all samples measured with BeadChip Chromosome Position
M cg24337108 10 11,797,422 > 0.99
IM cg25722983 1 36,840,028 from 0.45 to 0.55
U cg09655782 4 57,333,859 < 0.1
Mmethylated locus,IMintermediately methylated locus,Uunmethylated locus,BeadChipInfinium MethylationEPIC BeadChip (Illumina),Beta value
2μl of sepharose-coated Streptavidin beads (step 5.3.3.2) and by prolonging the agitation step to 20 min (step 5.3.3.6).
MS-HRM Analysis
We prepared 100, 75, 50, 25, 10 and 0% methylated stan-dards by mixing BS converted DNA methylated and unmethylated standards. 15 ng of BS converted samples and standards were processed using EpiTect HRM PCR Kit (Qiagen). Reaction conditions were set according to manufacturer’s protocol. The amount of reagents was ad-justed to 20μl final volume. The final concentration of primers was 0.375μM. The experiment was performed on Rotor-Gene Q 2plex HRM Platform (Qiagen). For the HRM analysis, the ramping was set from 67.1 to 82.2 °C, rising by 0.1 °C/2 s. Raw data were processed using web-based tool uAnalyze [41]. In the software, we performed baseline normalization and calculated the difference curves for all standards and samples using the 0% methyl-ated standard as a reference curve. Calibration curves were then plotted in Microsoft Excel according to Tse et al. [27] using peak heights and AUC of the standards’ processed data. From the calibration curves, the methyla-tion percentage of analyzed samples was calculated.
qMSP
Quantitative PCR with subsequent melting curve analysis was performed with 10–15 ng of BS converted DNA. Re-action mix (20μl) was prepared using QuantiTect SYBR®
Green PCR Kit (Qiagen). The final concentration of primers was 0.5μM. We kept recommended cycling con-ditions with 40 cycles and Tann according to Table 1. In
one run, all samples together with methylated and unmethylated DNA standards were amplified with meth-ylated MSP, unmethmeth-ylated MSP and HRM primers. For each primer set, the amplification efficiency was calculated according to Dorak et al. [42]. We performed qPCR with four dilutions of BS converted DNA of one sample and plotted decadic logarithm of the dilutions against acquired Cts. The efficiency was then calculated from the slope of
the calibration curve as follows: E¼ ½10ð−slope1Þ−1∙100. All measurements were done using StepOnePlus Real-Time PCR System (Thermo Fisher Scientific). Methylation levels were calculated using all three approaches reviewed in Husseiny et al. [36].
Additional files
Additional file 1:Correlation coefficients for AUC-based MS-HRM calibration curves and counted methylation levels. (DOCX 14 kb)
Additional file 2:qMSP methylation results calculated using the relative expression ration. (DOCX 12 kb)
Acknowledgements Not applicable.
Authors’Contributions
SS performed the measurements, data analysis and wrote the manuscript. CS revised the manuscript. HR designed the study and wrote the manuscript. All authors read and approved the final version.
Funding
This work was supported by the Project for Conceptual Development of Research Organization (00023736, Institute of Hematology and Blood Transfusion) provided by Ministry of Health of the Czech Republic.
Availability of Data and Materials
The datasets supporting the conclusions of this article are included within the article (and its additional files).
Ethics Approval and Consent to Participate
This work was conducted in accordance with the principles of the Declaration of Helsinki and was approved by the Ethics Committee of the Institute of Hematology and Blood Transfusion, Prague, Czech Republic. All blood donors provided written informed consent.
Consent for Publication Not applicable.
Competing Interests
The authors declare that they have no competing interests.
Author details 1
Institute of Clinical and Experimental Hematology, First Faculty of Medicine, Charles University and Institute of Hematology and Blood Transfusion, Prague, Czech Republic.2Institute of Hematology and Blood Transfusion, Prague, Czech Republic.
Received: 6 June 2019 Accepted: 9 August 2019
References
1. Schubeler D. Function and information content of DNA methylation. Nature. 2015;517(7534):321.
2. Jin Z, Liu Y. DNA methylation in human diseases. Genes & Diseases. 2018; 5(1):1–8.
3. Levenson VV. DNA methylation as a universal biomarker. Expert Rev Mol Diagn. 2010;10(4):481–8.
4. Heyn H, Esteller M. DNA methylation profiling in the clinic: applications and challenges. Nat Rev Genet. 2012;13(10):679–92.
5. Pidsley R, Zotenko E, Peters TJ, Lawrence MG, Risbridger GP, Molloy P, et al. Critical evaluation of the Illumina MethylationEPIC BeadChip microarray for whole-genome DNA methylation profiling. Genome Biol. 2016;17(1):208. 6. Lövkvist C, Dodd IB, Sneppen K, Haerter JO. DNA methylation in human epigenomes depends on local topology of CpG sites. Nucleic Acids Res. 2016;44(11):5123–32.
7. Cedar H, Solage A, Glaser G, Razin A. Direct detection of methylated cytosine in DNA by use of the restriction enzyme MspI. Nucleic Acids Res. 1979;6(6):2125–32. 8. Fraga MF, Esteller M. DNA Methylation: A Profile of Methods and
Applications. BioTechniques. 2002;33(3):632–49.
9. Singer-Sam J, LeBon JM, Tanguay RL, Riggs AD. A quantitative Hpall-PCR assay to measure methylation of DNA from a small number of cells. Nucleic Acids Res. 1990;18(3):687.
10. Itoi E, Kokubun S, Hashimoto K, Roach HI. Improved Quantification of DNA Methylation Using Methylation-Sensitive Restriction Enzymes and Real-Time PCR. Epigenetics. 2007;2(2):86–91.
11. Kurdyukov S, Bullock M. DNA Methylation Analysis: Choosing the Right Method. Biology. 2016;5(1):3.
12. Untergasser A, Nijveen H, Rao X, Bisseling T, Geurts R, Leunissen JAM. Primer3Plus, an enhanced web interface to Primer3. Nucleic Acids Res. 2007;35(suppl2):W74. 13. Ye J, Coulouris G, Zaretskaya I, Cutcutache I, Rozen S, Madden TL.
Primer-BLAST: A tool to design target-specific primers for polymerase chain reaction. BMC bioinformatics. 2012;13(1):134.
14. Hayatsu H, Wataya Y, Kazushige K. Addition of sodium bisulfite to uracil and to cytosine. J Am Chem Soc. 1970;92(3):724–6.
15. Sant KE, Nahar MS, Dolinoy DC. DNA methylation screening and analysis. Methods Mol Biol (Clifton, NJ). 2012;886:385–406.
16. Hernández HG, Tse MY, Pang SC, Arboleda H, Forero DA. Optimizing methodologies for PCR-based DNA methylation analysis. BioTechniques. 2013;55(4):181–97.
17. Frommer M, Mcdonald LE, Millar DS, Collis CM, Watt F, Grigg GW, et al. A genomic sequencing protocol that yields a positive display of 5-methylcytosine residues in individual DNA strands. 1992,.
18. Reed K, Poulin ML, Yan L, Parissenti AM. Comparison of bisulfite sequencing PCR with pyrosequencing for measuring differences in DNA methylation. Anal Biochem. 2010;397(1):96–106.
19. Tost J, El abdalaoui H, Glynne Gut I. Serial pyrosequencing for quantitative DNA methylation analysis. BioTechniques. 2006;40(6):721–6.
20. Delaney C, Garg SK, Yung R. Analysis of DNA methylation by pyrosequencing. Methods Mol Biol. 2015;1343:249.
21. Tost J, Gut IG. DNA methylation analysis by pyrosequencing. Nat Protoc. 2007;2(9):2265–75.
22. Li L, Dahiya R. MethPrimer: designing primers for methylation PCRs. Bioinformatics. 2002;18(11):1427–31.
23. Arányi T, Váradi A, Simon I, Tusnády GE. The BiSearch web server. BMC bioinformatics. 2006;7(1):431.
24. King CR, Scott-Horton T. Pyrosequencing. In: Marsh S, editor. Pyrosequencing protocols Totowa. NJ: Humana Press; 2007. p. 39–55. 25. Guo D, Milewicz DM. Universal primer applications for pyrosequencing. In: Marsh
S, editor. Pyrosequencing protocols Totowa. NJ: Humana Press; 2007. p. 57–62. 26. Wojdacz TK, Dobrovic A. Methylation-sensitive high resolution melting
(MS-HRM): a new approach for sensitive and high-throughput assessment of methylation. Nucleic Acids Res. 2007 Mar;35(6):e41.
27. Tse MY, Ashbury JE, Zwingerman N, King WD, Taylor SA, Pang SC. A refined, rapid and reproducible high resolution melt (HRM)-based method suitable for quantification of global LINE-1 repetitive element methylation. BMC Res Notes. 2011;4(1):565.
28. Smith E, Jones ME, Drew PA. Quantitation of DNA methylation by melt curve analysis. BMC Cancer. 2009;9(1):123.
29. Malentacchi F, Forni G, Vinci S, Orlando C. Quantitative evaluation of DNA methylation by optimization of a differential-high resolution melt analysis protocol. Nucleic Acids Res. 2009 Jul;37(12):e86.
30. Wojdacz TK, Borgbo T, Hansen LL. Primer design versus PCR bias in methylation independent PCR amplifications. Epigenetics. 2009;4(4):231–4. 31. Wojdacz TK, Lotte HL. Reversal of PCR bias for improved sensitivity of the
DNA methylation melting curve assay. BioTechniques. 2006;41(3):274–8. 32. Hansen LL, Wojdacz TK, Dobrovic A. Methylation-sensitive high-resolution
melting. Nat Protoc. 2008;3(12):1903–8.
33. Wojdacz TK, Hansen LL, Dobrovic A. A new approach to primer design for the control of PCR bias in methylation studies. BMC Res Notes. 2008;1(1):54. 34. Herman JG, Graff JR, Myöhänen S, Nelkin BD, Baylin SB. Methylation-Specific
PCR: A Novel PCR Assay for Methylation Status of CpG Islands. Proc Natl Acad Sci U S A. 1996;93(18):9821–6.
35. Derks S, Lentjes MH, Hellebrekers DM, de Bruïne AP, Herman JG, van Engeland M. Methylation-specific PCR unraveled. Cellular oncology : the official journal of the International Society for Cellular Oncology. 2004;26(5–6):291–9.
36. Husseiny MI, Kuroda A, Kaye AN, Nair I, Kandeel F, Ferreri K. Development of a Quantitative Methylation-Specific Polymerase Chain Reaction Method for Monitoring Beta Cell Death in Type 1 Diabetes. PLoS One. 2012 Oct 1;7(10):e47942.
37. Akirav EM, Lebastchi J, Galvan EM, Henegariu O, Akirav M, Ablamunits V, et al. Detection ofβcell death in diabetes using differentially methylated circulating DNA. Proc Natl Acad Sci U S A. 2011;108(47):19018–23. 38. Eads CA, Danenberg KD, Kawakami K, Saltz LB, Blake C, Shibata D, et al.
MethyLight: a high-throughput assay to measure DNA methylation. Nucleic Acids Res. 2000;28(8):e32.
39. Pfaffl MW. A new mathematical model for relative quantification in real-time RT-PCR. Nucleic Acids Res. 2001;29(9):45.
40. ŠestákováŠ, Krejčík Z, Folta A, Cerovská E,Šálek C, Merkerová MD, et al. DNA methylation and hydroxymethylation patterns in acute myeloid leukemia patients with mutations in DNMT3A and IDH1/2 and their combinations. Cancer Biomark: Section A of Disease Markers. 2019;25(1):43–51. 41. Dwight Z, Palais R, Wittwer C. uAnalyze: web-based high-resolution DNA
melting analysis with comparison to thermodynamic predictions. IEEE/ACM Trans Comput Biol Bioinform. 2012;9(6):1805–11.
42. Pfaffl MW. time qPCR amplification efficiency. In: Dorak MT, editor. Real-time PCR. 1st ed. London: Taylor & Francis; 2007. p. 68–71.
Publisher’s Note