www.ocean-sci.net/12/925/2016/ doi:10.5194/os-12-925-2016
© Author(s) 2016. CC Attribution 3.0 License.
Observed and simulated full-depth ocean heat-content
changes for 1970–2005
Lijing Cheng1, Kevin E. Trenberth2, Matthew D. Palmer3, Jiang Zhu1, and John P. Abraham4
1International Center for Climate and Environment Sciences, Institute of Atmospheric Physics,
Chinese Academy of Sciences, 100029, Beijing, China
2National Center for Atmospheric Research, Boulder, CO, USA 3Met Office Hadley Centre, FitzRoy Road, Exeter, EX1 3PB, UK 4School of Engineering, University of St. Thomas, St. Paul, MN, USA
Correspondence to:John Abraham ([email protected]) and Lijing Cheng ([email protected])
Received: 4 April 2016 – Published in Ocean Sci. Discuss.: 8 April 2016 Revised: 7 June 2016 – Accepted: 9 July 2016 – Published: 26 July 2016
Abstract. Greenhouse-gas emissions have created a plane-tary energy imbalance that is primarily manifested by in-creasing ocean heat content (OHC). Updated observational estimates of full-depth OHC change since 1970 are presented that account for recent advancements in reducing observa-tion errors and biases. The full-depth OHC has increased by 0.74 [0.68, 0.80]×1022J yr−1 (0.46 Wm−2) and 1.22 [1.16–1.29]×1022J yr−1 (0.75 Wm−2)for 1970–2005 and 1992–2005, respectively, with a 5 to 95 % confidence inter-val of the median. The CMIP5 models show large spread in OHC changes, suggesting that some models are not state-of-the-art and require further improvements. However, the en-semble median has excellent agreement with our observa-tional estimate: 0.68 [0.54–0.82]×1022J yr−1(0.42 Wm−2)
from 1970 to 2005 and 1.25 [1.10–1.41]×1022J yr−1 (0.77 Wm−2)from 1992 to 2005. These results increase con-fidence in both the observational and model estimates to quantify and study changes in Earth’s energy imbalance over the historical period. We suggest that OHC be a fundamen-tal metric for climate model validation and evaluation, espe-cially for forced changes (decadal timescales).
1 Introduction
Since the beginning of the industrial revolution, increased emissions of long-lived greenhouse gases such as carbon dioxide have resulted in an accumulation of thermal energy in the climate system (Trenberth et al., 2014; von
Schuck-mann et al., 2016) via the associated net energy imbalance at Earth’s top-of-atmosphere (TOA). It is estimated that more than 90 % of the excess heat is stored in the ocean and is manifested by ocean warming (Loeb et al., 2012; Balmaseda et al., 2013; Rhein et al., 2013; Trenberth et al., 2014), i.e., an increase in global ocean heat content (OHC; Lyman et al., 2010; Levitus et al., 2012; Abraham et al., 2013). Due to the ocean’s dominant role in the global energy storage changes, the rate of OHC change provides a strong con-straint on Earth’s energy imbalance on interannual and longer timescales (Palmer and McNeall, 2014; Trenberth, 2015). Numerous efforts have been made to detect the historical OHC change (for example, Levitus et al., 2005; Gouretski and Koltermann, 2007; Smith and Murphy, 2007; Domingues et al., 2008; Palmer and Haines, 2009; Ishii and Kimoto, 2009; Lyman et al., 2010; Levitus et al., 2012; Balmaseda et al., 2013; Cheng et al., 2015a) and attribute causes to its variation (Palmer et al., 2009; Gleckler et al., 2012). How-ever, large uncertainties exist in OHC estimates (Abraham et al., 2013; Balmaseda et al., 2013; Rhein et al., 2013), which can confound our understanding of the changes in Earth’s energy imbalance since the 1970s.
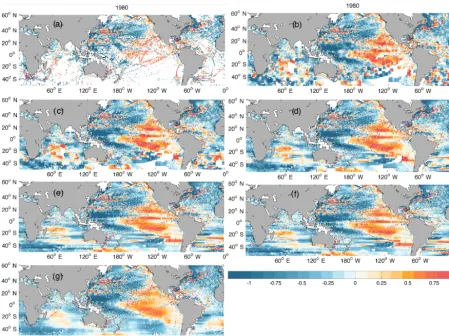
Figure 1.Flexible-grid method.(a)shows the geographical distribution of 700 m OHC in 1980 on each 1◦by 1◦grid, showing good data coverage in the Northern Hemisphere and sparse data in the Southern Hemisphere. To fill these data gaps by using the flexible-grid method, OHC on each grid in the poorly sampled region (defined as the Argo-Ship Area in CZ14) is calculated by averaging OHC on a large latitude– longitude grid with sizes of 5◦by 5◦, 5◦by 10◦, 5◦by 20◦, 1◦by 40◦, 8◦by 40◦, and 10◦by 40◦separately. The resultant OHC distribution is shown from(b)to(g).
in their formulation and performance. Hence, the XBT com-munity met in 2014 and made a series of recommendations on the factors that should be accounted for when designing and implementing an XBT bias-correction scheme (Cheng et al., 2015b). Only one bias-correction scheme (Cheng et al., 2014) meets all of these recommendations, and has been shown to correct the overall bias to less than 0.02◦C (for the 0–700 m layer, less than 10 % of the total 0–700 m tempera-ture change since 1970) and also reduce the spatio-temporal variation of bias.
Prior to 2004, observations of the upper ocean were pre-dominantly confined to the Northern Hemisphere and con-centrated along major shipping routes; the Southern Hemi-sphere is particularly poorly observed. In this century, the ad-vent of the Argo array of autonomous profiling floats (Roem-mich et al., 2015; von Schuckmann et al., 2014) has signifi-cantly increased ocean sampling to achieve near-global cov-erage for the first time over the upper 1800 m since about 2005.
The lack of historical data coverage requires a gap-filling (or mapping) strategy to infill the data gaps in order to esti-mate the global integral of OHC. A pioneering study showed that an improved strategy for gap-filling methods and cor-rections for XBT biases improved the consistency between models and observations of upper 700 m OHC (Domingues et al., 2008). Owing to sparse observations in the Southern Hemisphere, Durack et al. (2014) explored this region as a primary source of underestimation of OHC trends using climate models from the Coupled Model Intercomparison Project Phase 3/5 (CMIP 3/5; Meehl et al., 2007; Taylor et al., 2012). Cheng and Zhu (2014) examined the observation system evolution in this century, identifying a spurious sig-nal from 2001 to 2003 in global OHC estimates due to inad-equate sampling of the Southern Hemisphere prior to Argo. Accordingly, these studies imply that many past estimates likely underestimate the long-term trend.
the impact of historical sampling changes and to confront CMIP5 models with the state-of-the-art observational esti-mates of OHC change. We note that the work presented here is broadly similar to the recent study of Gleckler et al. (2016) and provides an important independent verification of some of their key findings. However, the present study also makes use of a larger number of CMIP5 models (24 compared to 15) and observation-based estimates of the 0–700 m ocean heat content changes (8 compared to 3), including improved XBT bias corrections and new mapping approaches. We are therefore able to more fully characterize the uncertainties as-sociated with CMIP5 models and place our new observation-based estimates of OHC in the context of several previous estimates (including those of Gleckler et al.). The paper is ar-ranged as follows. In Sect. 2 the data and methods are intro-duced. The various observation-based OHC estimates used are discussed in Sect. 3.1; CMIP5 model simulations are pre-sented in Sect. 3.2. We summarize our findings in Sect. 4.
2 Data and methods
The new observation-based estimates of OHC presented here use the XBT bias-correction scheme from Cheng et al. (2014) applied to the most recent version of the World Ocean Database (WOD2013; Boyer et al., 2013). MBT bias is cor-rected using the method provided in Ishii and Kimoto (2009). Because the choice of reference climatology to compute anomalies can lead to errors due to the sparseness and in-homogeneity of the historical ocean sampling (Lyman and Johnson, 2014; Cheng and Zhu, 2015), it is preferable to use the climatology that is constructed based on data with near-global data coverage (Cheng and Zhu, 2015), i.e., during the recent years in the Argo period. In this study, we use a cli-matology constructed for the period 2008–2012, similar to Cheng and Zhu (2014) and Cheng et al. (2015a).
We apply two approaches to mapping the OHC data. The first (Cheng and Zhu, 2014; hereafter termed the CZ14 method) calculated annual mean OHC in data-rich areas (de-fined as the Ship Area) and a linear OHC trend in data-sparse regions (defined as the Argo-Ship Area). Then the two esti-mates are summed to get the global OHC. The second ap-proach is an extension to CZ14 that uses flexible grid sizes to retain greater spatial information while ensuring an adequate number of observations in each grid box. OHC on each 1◦by 1◦grid in poorly sampled regions (Argo-Ship Area defined in
CZ14) is calculated by averaging OHCs over a large latitude– longitude grid with sizes of 5◦by 5◦, 5◦by 10◦, 5◦by 20◦, 2◦ by 40◦, 8◦by 40◦, and 10◦by 40◦separately to ensure that all regions have data coverage (Fig. 1). The gridded av-eraged anomalies are then integrated to get global OHC. This method (“flexible-grid” method hereafter) maintains the ob-served OHC in data-rich regions without smoothing and pro-vides a smooth OHC field in data-sparse regions. This is
ap-Domingues et al.
1970 1975 1980 1985 1990 1995 2000 2005 2010 −5
0 5 10 15 20 25 30 35 40
Year
OHC (10
22 Joules) Ishii & Kimoto
Durack & Wijffels
Levitus et al.
Smith & Murphy Full-depth, Flexible-grid
Full-depth, CZ14 Full-depth, ORAS4 0–700 m, Flexible-grid 0–700 m, CZ14 0–700 m, ORAS4 Below 2000 m, P&J 10 700–2000 m, NODC
Pinatubo
El Chichón 97–98
El
Niño
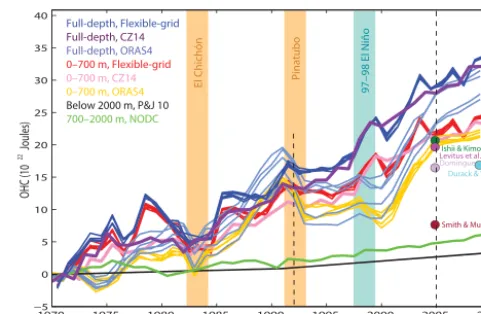
Figure 2.Observational ocean heat content from 1970 to 2010. The 0–700 m OHC is shown in red (flexible-grid method), pink (CZ14 method), and yellow (ORAS4). Five adjusted OHCs presented in Durack et al. (2014) are shown as dots, which are the OHC changes per 35 years. The 700–2000 m OHC is sourced from NODC in green, and abyssal (2000 m–bottom) OHC is from Purkey and John-son (2010) and shown in black (the warming rate within 1970–1991 is scaled to 3 times the linear trend in Purkey and Johnson, 2010). Full-depth OHC time series are also presented in blue (flexible-grid method), dark purple (CZ14 method), and light blue (ORAS4). All of the time series are referred to a baseline OHC within the 3-year period: 1969–1971. The vertical colored bars are 2-year intervals, starting when the event (volcano or El Niño) began.
propriate for the Southern Hemisphere, where there is more homogeneity, less land, and no boundary currents.
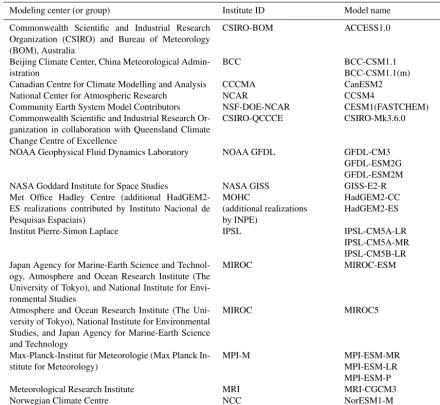
Table 1.List of CMIP5 models and group names.
Modeling center (or group) Institute ID Model name
Commonwealth Scientific and Industrial Research Organization (CSIRO) and Bureau of Meteorology (BOM), Australia
CSIRO-BOM ACCESS1.0
Beijing Climate Center, China Meteorological Admin-istration
BCC BCC-CSM1.1
BCC-CSM1.1(m)
Canadian Centre for Climate Modelling and Analysis CCCMA CanESM2
National Center for Atmospheric Research NCAR CCSM4
Community Earth System Model Contributors NSF-DOE-NCAR CESM1(FASTCHEM)
Commonwealth Scientific and Industrial Research Or-ganization in collaboration with Queensland Climate Change Centre of Excellence
CSIRO-QCCCE CSIRO-Mk3.6.0
NOAA Geophysical Fluid Dynamics Laboratory NOAA GFDL GFDL-CM3
GFDL-ESM2G GFDL-ESM2M
NASA Goddard Institute for Space Studies NASA GISS GISS-E2-R
Met Office Hadley Centre (additional HadGEM2-ES realizations contributed by Instituto Nacional de Pesquisas Espaciais)
MOHC
(additional realizations by INPE)
HadGEM2-CC HadGEM2-ES
Institut Pierre-Simon Laplace IPSL IPSL-CM5A-LR
IPSL-CM5A-MR IPSL-CM5B-LR Japan Agency for Marine-Earth Science and
Technol-ogy, Atmosphere and Ocean Research Institute (The University of Tokyo), and National Institute for Envi-ronmental Studies
MIROC MIROC-ESM
Atmosphere and Ocean Research Institute (The Uni-versity of Tokyo), National Institute for Environmental Studies, and Japan Agency for Marine-Earth Science and Technology
MIROC MIROC5
Max-Planck-Institut für Meteorologie (Max Planck In-stitute for Meteorology)
MPI-M MPI-ESM-MR
MPI-ESM-LR MPI-ESM-P
Meteorological Research Institute MRI MRI-CGCM3
Norwegian Climate Centre NCC NorESM1-M
NorESM1-ME
Combining our new OHC estimates with existing esti-mates provides an ensemble of observation-based estiesti-mates of historical upper 0–700 m OHC changes, and the spread is a simple measure of the observational uncertainty. Differences across the ensemble arise not only from mapping methods, but also from the choice of climatology, input data quality control procedures, and XBT correction scheme (Palmer et al., 2010).
To arrive at estimates of full-depth OHC change, we adapted and adjusted the Levitus et al. (2012) estimate for the 700–2000 m layer and, for the deeper ocean for the pe-riod 1990–2010, we use information from Purkey and John-son (2010), which was also used in the IPCC-AR5 report (Rhein et al., 2013). Prior to 1990, there is a larger uncer-tainty regarding the rate of deep-ocean warming. Because the upper 700–2000 m oceans show an approximate tripling of the heating rate from 1992 to 2005 compared to from
−0.1 0 0.1 0.2 0.3 0.4 0.5 0.6 0.7 0.8 0.9 1 1.1 1.2 0
2 4 6 8
1970−2005 OHC trend (10 J yr )22
Frequency
This study (CZ14)
(b)
5 % to 95 % CI Median
Ishii & Kimoto
Domingues et al.
ORAS4 Smith & Murphy
Levitus et al.
This study (Flexible−grid)
Durack & Wijffels
−0.1 0 0.1 0.2 0.3 0.4 0.5 0.6 0.7 0.8 0.9 1 1.1 1.2
0 2 4 6 8
1970−2005 OHC trend (10 J yr )22
Frequency
Median
5 % to 95 % CI
(a) This study (CZ14)
Ishii & Kimoto Levitus et al. Domingues et al.
ORAS4 Smith & Murphy
Durack & Wijffels This study (Flexible−grid)
–1 –1
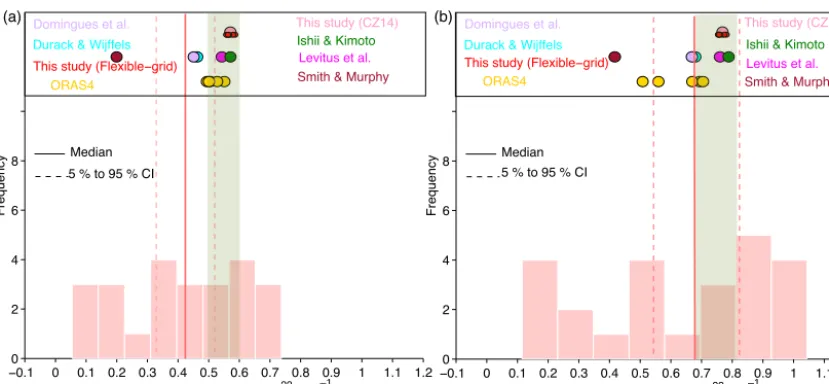
Figure 3. OHC trends during the 1970–2005 period in observations and CMIP5 models.(a)0–700 m.(b)Full depth. For models, the histograms are the distribution of CMIP5 results, and the median of the CMIP5 multimodel results is shown in solid line, with the 5–95 % confidence interval in dashed lines. For observations, we present the linear trends by different studies: this study (both CZ14 and the flexible-grid method), five estimates in Durack et al. (2014) after adjustment, and five ensembles of ORAS4 reanalysis. The 5–95 % confidence intervals for observations are shaded in light green. A quadratic fit to the entire pre-industrial control run was used to correct the CMIP5 time series for model drift.
by this assumption. The ORAS4 data also provide estimates of OHC changes deeper than 700 m. We estimate the un-certainty for the OHC changes below 700 m by computing the standard error from the ensemble members of Levitus et al. (2012), Purkey and Johnson (2010), and ORAS4 ensem-bles, and presenting the 5–95 % confidence interval.
We compare our observation-based OHC ensemble with 24 CMIP5 model simulations (Table 1) of historical OHC changes. Climate models suffer from so-called “drift” (Sen Gupta et al., 2013; Hobbs et al., 2015), i.e., spurious long-term trends arising due to the slow model adjustment to the initial conditions and/or imperfect representation of the en-ergy budget. This drift can bias the long-term representation of the ocean temperature, especially in deeper layers. Be-cause there is no general consensus on how to correct for climate drift in models, we applied two different drift correc-tion strategies by using available pre-industrial control (“pi-Control”) runs of 24 CMIP5 models. We applied both a linear and quadratic fit to the OHC time series of pi-control runs for OHC0-700, 700–2000, and 2000–6000 m. The resulting re-gression function is removed from the historical simulations for each model. The two methods show nearly identical re-sults (Tables 2 and 3) and we present the rere-sults for quadratic drift correction as the basis of our discussions.
To quantify the OHC changes for a given time period, we fit a linear trend. An alternative method for calculating the OHC difference between the two ends of a time series shows consistent results (compare Table 2 with Table 3). For both observation-based OHC and CMIP5-OHC results, we calcu-late the median of the ensemble to reduce the impact of
out-liers, together with the 5 to 95 % confidence interval of the median assuming that the values were independently and ran-domly sampled from a population distributed according to a Gaussian distribution. Therefore, the 5–95 % confidence in-terval is±standard error×2.10. The Student’sttest is used to examine the significance of the difference between obser-vations and CMIP5 models.
3 Results
3.1 Observation-based full-depth OHC estimates Figure 2 presents the observation-based 0–700 m OHC es-timates by using the methods listed in the previous sec-tion, after taking the Southern Hemisphere sampling bias into account. The updated 0–700 m OHC estimate based on the CZ14 method indicates a total upper ocean warm-ing of approximately 21.0×10²²J, equal to a linear trend of 0.58×10²²J yr−1(or 0.35 Wm−2, averaged over the global surface area) from 1970 to 2005. The six individual flexible-grid method estimates (based on six choices of flexible-grid size; Fig. 2) span a range of 0.52–0.58×10²²J yr−1 during the
Table 2.Summary of ocean heat content change. Comparison of CMIP5 models and observations. The medians with the 5–95 % confidence interval are presented.
Time period Depth CMIP5 linear drift CMIP5 quadratic drift Observations
correction (×1022J yr−1) correction (×1022J yr−1) (×1022J yr−1)
1970–2005 0–700 m 0.42 [0.32, 0.51] 0.42 [0.32, 0.51] 0.55 [0.50, 0.60]
full depth 0.69 [0.56, 0.82] 0.68 [0.54, 0.82] 0.74 [0.68, 0.80]
1992–2005 0–700 m 0.89 [0.77, 1.02] 0.89 [0.77, 1.02] 0.85 [0.79, 0.92]
full depth 1.26 [1.11, 1.42] 1.25 [1.10, 1.41] 1.22 [1.16, 1.29]
1970–1991 0–700 m 0.39 [0.30, 0.47] 0.40 [0.31, 0.48] 0.51 [0.46, 0.56]
full depth 0.57 [0.44, 0.69] 0.56 [0.43, 0.68] 0.61 [0.53, 0.69]
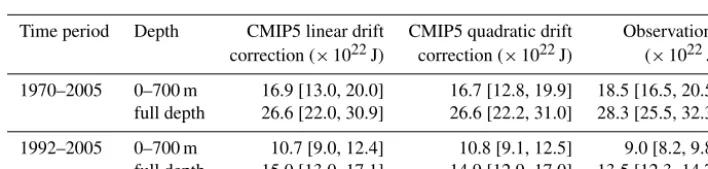
Table 3.Summary of total ocean heat content change within 1970–2005 and 1992–2005 by using an alternative method to assess the long-term OHC change. Here the total OHC changes based on observations are calculated by the difference of OHC with 2004–2006 and OHC within 1969–1971 (1990–1992) for the 1970–2005 (1992–2005) period to reduce the interannual temporal variability. This is an alternative method to assess the OHC change in addition to the linear trend in Table 2.
Time period Depth CMIP5 linear drift CMIP5 quadratic drift Observations correction (×1022J) correction (×1022J) (×1022J)
1970–2005 0–700 m 16.9 [13.0, 20.0] 16.7 [12.8, 19.9] 18.5 [16.5, 20.5] full depth 26.6 [22.0, 30.9] 26.6 [22.2, 31.0] 28.3 [25.5, 32.3]
1992–2005 0–700 m 10.7 [9.0, 12.4] 10.8 [9.1, 12.5] 9.0 [8.2, 9.8]
full depth 15.0 [13.0, 17.1] 14.9 [12.9, 17.0] 13.5 [12.3–14.7]
rather than the mean. ORAS4 reanalysis shows a range of 0.49–0.53×10²²J yr−1for the 0–700 m OHC.
The collection of the different observational OHC esti-mates discussed above (16 individual estiesti-mates) provides current best estimates of OHC, along with an estimate of the uncertainty associated with the analytical methodology (Fig. 3a). Although all OHC estimates are based on es-sentially the same temperature profile database, they use four different methods, and hence their differences give an indication of the uncertainty. The total OHC change of the upper 700 m layer has increased by 0.55×10²²J yr−1 (0.34 Wm−2)from 1970 to 2005, which is the median among all of the ensemble members, with a 5–95 % confidence in-terval of 0.50–0.60×10²²J yr−1.
On the other hand, it is worthwhile noting that the com-parison of CZ14, flexible-grid method, and ORAS4 re-sults shows inconsistencies in OHC changes on interannual timescales (Fig. 2), indicating that the errors in OHC es-timates are still larger than the interannual variability, as shown in Abraham et al. (2013). However, all of the es-timates show the OHC decreases after the major volcano eruptions: El Chichón in March–April 1982 and Pinatubo in June 1991 (Fig. 2). The OHC change after the two vol-cano eruptions is approximately assessed by subtracting the OHC 1 year before the eruption from the OHC in the sec-ond year after eruption. It shows a 0–700 m OHC decrease of ∼ −2.67 [−3.28, −2.06]×1022J after El Chichón and
∼ −2.72 [−3.97,−1.47]×1022J after Pinatubo, indicating the strong ocean cooling. The negative radiative forcing to the ocean (and climate system) due to the volcano eruption is probably the major reason for this decrease (Church et al., 2005, Domingues et al., 2008; Balmaseda et al. 2013), but our observational analyses can not exclude the possibil-ity that the unforced ocean variabilpossibil-ity (such as ENSO, Tren-berth and Fasullo, 2012) and the insufficiency of data cover-age (which could induce spurious interannual OHC change) are fully or partly responsible for the values calculated above, which requires more careful model-based studies in the fu-ture. Moreover, it is also suggested that volcanic eruptions can trigger an El Niño-like response in the ocean, which is another possible explanation (Mann et al., 2005).
meth-ods and the processes of OHC redistribution during ENSO represented by re-analyses (ORAS4) in the vertical in the Pa-cific Ocean and into the other ocean basins via atmosphere teleconnections (Mayer et al., 2013).
For deeper ocean layers, we adopt the 700–2000 m ocean heat content estimate from 1970 to 2005 in Levitus et al. (2012), where all of the historical in situ data are objec-tively analyzed. According to Levitus et al. (2012), the 700– 2000 m ocean warmed by 0.12×10²² (0.17×10²²)J yr−1 or 0.075 (0.106) Wm−2 over the global surface since 1970 (1992). For the abyssal (2000 m–bottom) OHC changes, according to the strategies provided in the Methods sec-tion, we estimate a deep-ocean warming of 0.03×10²² (0– 0.11×10²²)J yr−1or 0.02 (0–0.07) Wm−2during the 1970– 1991 period and 0.11×10²²J yr−1 (0.077 Wm−2) during 1992–2005. According to the two estimates at two layers, the ocean warming rate deeper than 700 m is 0.15×10²²J yr−1
(0.090 Wm−2)during 1970–2005. However, as we discussed
above, the traditional method from Levitus et al. (2012) is likely to underestimate the long-term trend, and this is also the case for the 700–2000 m estimate of OHC change. Hence it is also valuable to use ORAS4, which provides alternative estimates of 700–2000 m/2000 m–bottom OHC changes and also provides an assessment of the uncertainty. It is shown from the recent Ocean Reanalyses Intercomparison Project (Palmer et al., 2015) that there remain large biases in the deeper ocean, because there are limited 700 m (historical) data available, and hence it is a challenge for assimilation to deliver information to the model in those layers. ORAS4 shows the deeper 700 m–bottom ocean warming of 0.09– 0.24×10²²J yr−1(0.056–0.150 Wm−2)since 1970, indicat-ing large uncertainties generally consistent with the previous assessments based on Levitus et al. (2012) and Purkey and Johnson (2010).
By summing OHCs for the different layers 0–700, 700– 2000, and 2000 m–bottom, the observation-based full-depth OHCs are obtained. All of these results (Fig. 3b) in-dicate a range of full-depth ocean warming of 0.50– 0.79×10²²J yr−1 (0.31–0.50 Wm−2) over the 36-year period (1970–2005, again calculated by linear trend). The median of the different estimates is 0.74 [0.68, 0.80]×1022J yr−1 (1.22 [1.16–1.29]×1022J yr−1) since 1970 (since 1992), with the values in brackets represent-ing the 5 and 95 % confidence intervals of the median. This is equivalent to a global energy imbalance of 0.46 [0.42, 0.50] Wm−2(0.75 [0.69, 0.81] Wm−2)averaged over Earth’s surface area since 1970 (1992). Furthermore, af-ter the two major volcano eruptions, the total OHC de-crease is ∼ −2.42 [−3.28, −1.56]×1022J for El Chichón and∼ −3.19 [−4.92,−1.67]×1022J for Pinatubo. Follow-ing the major 1997–1998 El Niño event, the total OHC de-creases by∼ −1.85 [−2.62,−1.10]×1022J. This indicates a substantial rearrangement of heat from 0 to 700 m to the deeper ocean, since most ensemble members show smaller full-depth heat loss than for the 0–700 m layer.
1970 1975 1980 1985 1990 1995 2000 2005 2010
−20
−15
−10
−5 0 5 10 15 20 25
OHC (10
22 Joules)
CCSM4 MPI−ESM−P bcc−csm1−1−m IPSL−CM5A−MR MPI−ESM−LR GISS−E2−R MPI−ESM−MR bcc−csm1−1 GFDL−ESM2G GFDL−ESM2M IPSL−CM5A−LR NorESM1−ME CanESM2 NorESM1−M MIROC−ESM MIROC5 IPSL−CM5B−LR ACCESS1−0 CSIRO−Mk3−6−0 MRI−CGCM3 GFDL−CM3 HadGEM2−ES HadGEM2−CC CESM1−FASTCHEM
OHC full−depth, this study (CZ14)
OHC full−depth, CMIP5 ensemble mean
1970 1975 1980 1985 1990 1995 2000 2005 2010
−20
−15
−10
−5 0 5 10 15 20 25
OHC (10
22 Joules)
CCSM4 MPI−ESM−P bcc−csm1−1−m GISS−E2−R MPI−ESM−LR IPSL−CM5A−MR MPI−ESM−MR bcc−csm1−1 GFDL−ESM2G IPSL−CM5A−LR GFDL−ESM2M NorESM1−ME CanESM2 NorESM1−M MIROC−ESM IPSL−CM5B−LR MIROC5 ACCESS1−0 GFDL−CM3 CSIRO−Mk3−6−0 MRI−CGCM3 HadGEM2−ES HadGEM2−CC CESM1−FASTCHEM OHC full−depth, CMIP5 ensemble mean
OHC full−depth, this study (CZ14)
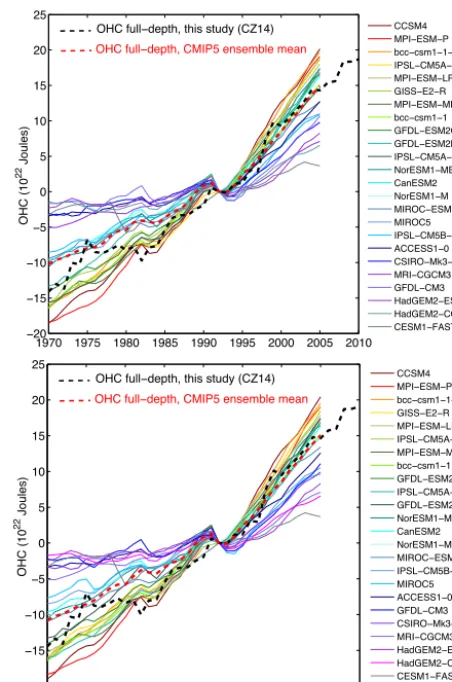
Figure 4.Full-depth OHC by individual CMIP5 models and obser-vations. The observational OHC time series (black dashed) uses the CZ14 method (0–700 m), Levitus et al. (2012) (700–2000 m), and Purkey and Johnson (2010) (2000 m–bottom). The multimodel semble median is shown in dashed curve. A quadratic fit to the en-tire pre-industrial control run was used to correct the CMIP5 time series for model drift in the upper panel, and the results for the linear fit are shown at the bottom.
3.2 Climate model assessments
0 5 10 15 20 25 30 35 40 45
Total OHC change(10
22 Joules)
Observation CCSM4 MPI −ESM −P bcc −csm1
−1− m IPSL −CM5A −MR MPI −ESM −LR GISS −E2 −R MPI −ESM −MR bcc− csm1 −1 GFDL −ESM2G GFDL −ESM2M IPSL −CM5A −LR NorESM1 −ME CanESM2 NorESM1 −M MIROC −ESM MIROC5 IPSL −CM5B −LR ACCESS1 −0 CSIRO −Mk3
−6− 0 MRI −CGCM3 GFDL −CM3 HadGEM2 −ES HadGEM2 −CC CESM1 −FASTCHEM CMIP5 Obs Obs CMIP5 1970−1991
1992−2005
0 5 10 15 20 25 30 35 40 45 Observation CCSM4 MPI −ESM −P bcc −csm1
−1−
m IPSL −CM5A −MR MPI −ESM −LR GISS −E2 −R MPI −ESM −MR bcc− csm1 −1 GFDL −ESM2G GFDL −ESM2M IPSL −CM5A −LR NorESM1 −ME CanESM2 NorESM1 −M MIROC −ESM MIROC5 IPSL −CM5B −LR ACCESS1 −0 CSIRO −Mk3
−6−
0 MRI −CGCM3 GFDL −CM3 HadGEM2 −ES HadGEM2 −CC CESM1 −FASTCHEM
Total OHC change(10
22 Joules)
Obs CMIP5 Obs CMIP5 700−bottom 0−700 m (a) (b)
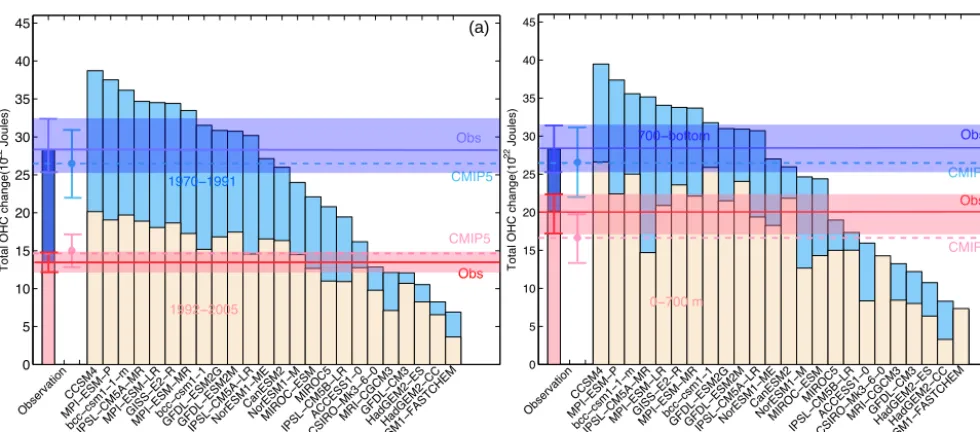
Figure 5.Comparison of full-depth OHC change between observation and CMIP5 models(a)for two separate time periods, 1970–1991 (in blue bars) and 1992–2005 (in red bars), and(b)for two vertical layers: 0–700 m (in red bars) and 700 m–bottom (in blue bars). The medians of the observational total OHC changes are shown in solid lines, compared with the model results in dashed lines. Their 5–95 % confidence intervals are presented in error bars. The 5–95 % confidence intervals for observations are also shaded in light red and light blue. A quadratic fit to the entire pre-industrial control run was used to correct the CMIP5 time series for model drift.
within 1970–2005 is 0.56×10²²J yr−1for OHC0-700 m and 0.75×10²²J yr−1for OHC0-700 m, both of which are nearly identical to the results in Table 2, suggesting that including Durack et al. (2014) does not influence the main conclusion of our study.
The distribution of OHC0-700 m from the 24 models af-ter a correction of “climate drift” (see Methods) shows an ensemble median of 0.42 [0.32–0.51]×1022J yr−1 (0.26
[0.19–0.37] Wm−2) for the 1970–2005 time period and
0.89 [0.77–1.02]×1022J yr−1(0.55 [0.48–0.64] Wm−2)for 1992–2005. The sensitivity of the results to the climate drift correction is very small (within 0.03×10²²J yr−1) when two different climate drift correction methods are applied (as shown in Tables 2 and 3 and Fig. 4). For the 1970–2005 pe-riod, the median of the CMIP5 models is significantly smaller than observations (0.55 [0.50–0.60]×1022J yr−1), indicat-ing that the models underestimate the upper 700 m OHC change since 1970. But within the 1992–2005 period, the median of the CMIP5 models falls into the confidence in-terval of the existing observational estimates, indicating that the ensemble median of models agrees very well with obser-vational estimates in the recent period.
For full-depth OHC, drift-corrected CMIP5 models show the total OHC change by 0.68 [0.54–0.82]×1022J yr−1 (0.42 [0.34–0.51] Wm−2)from 1970 to 2005 and 1.25 [1.10– 1.41]×1022J yr−1 (0.77 [0.68–0.88] Wm−2)during 1992– 2005 (Fig. 3). The CMIP5 ensemble median again shows very good agreement with observations for both 1970–2005 (0.74×10²²J yr−1) and 1992–2005 (1.22×10²²J yr−1).
The central estimates of observation-based and CMIP5 OHC change are consistent within the estimated uncertainty. The total OHC decrease after the two major volcano eruptions is ∼ −0.60 [−0.81, −0.38]×1022J for El Chichón and
∼ −1.47 [−1.93, −1.00]×1022J for Pinatubo, which are weaker than for observations.
Table 2 provides a summary of observed and simulated OHC change for different time periods and depths. CMIP5 results are shown for the upper ocean, both with linear and quadratic drift corrections. Within the drift-corrected CMIP5 models, the rate of ocean warming has nearly doubled since 1992 (Fig. 5, Table 2): 0.56 [0.43, 0.68]×1022J yr−1 within 1970–1991 (∼0.35 [0.26, 0.43] Wm−2 over global surface) compared to 1.25 [1.10, 1.41]×1022J yr−1 dur-ing 1992–2005 (∼0.77 [0.67, 0.87] Wm−2) for both the drift-corrected CMIP5 ensembles, while for observations the corresponding values are 0.61 [0.53, 0.69]×1022J yr−1 within 1970–1991 (∼0.38 [0.33, 0.43] Wm−2), and 1.22 [1.16, 1.29]×1022J yr−1 during 1992–2005 (∼0.75 [0.71, 0.80] Wm−2). This provides evidence of an acceleration of ocean warming due to the increasing radiative forcing from rising greenhouse gases and from the effects of volcanic eruptions near the intersection of those two time periods (Myhre et al., 2013). This acceleration of ocean warming is also found by a recent study (Gleckler et al., 2016).
overestimate the warming rate prior to 1990. Together these are indicators that the models might be too diffusive and that the vertical distribution of heat may not be correct, as sug-gested by previous studies (Forest et al., 2008; Kuhlbrodt and Gregory, 2012).
Although the comparison between the observational and CMIP5 full-depth OHC results in an insignificant differ-ence, CMIP5 models show a large spread (Figs. 3, 4, and 5), indicating that there are still large uncertainties in model simulations of Earth’s energy budget (Flato et al., 2013). The spread of CMIP5 models far exceeds the estimated ob-servational uncertainty in the OHC changes, even for the upper 0–700 m where the model drift is expected to be less important compared to the deeper layer. There are two groups of models: seven models calculate a small upper 700 m ocean warming of less than 0.3×10²²J yr−1 over 1970–2005; the other group shows a 0–700 m ocean warm-ing of 0.3–0.75×10²²J yr−1(Fig. 3a). The first group also
shows a much smaller full-depth OHC increase of less than 0.35×10²²J yr−1 than the second: 0.35–1.05×10²²J yr−1 over 1970–2005 (Fig. 3b). The second group shows better agreement with observational estimates. The models with smaller values should be treated with caution in future anal-yses. The reasons why the models have large divergence are still an actively studied issue. Frölicher et al. (2015) discussed the large range of model results and attributed a contribution of this to the differences in indirect aerosols. Additionally, CMIP5 has been missing post-2000 volcanic eruptions in these simulations as discussed in Glecker et al. (2016), but this effect is shown to be small and less than 0.1 Wm−2, as indicated in Trenberth et al. (2014).
Furthermore, the OHC for models shows a non-Gaussian distribution (Fig. 3), potentially challenging our method of the use of Gaussian estimations for the confidence levels. However, there is no a priori reason for the statistics to be non-Gaussian, other than that there is a small sample and the likelihood that there are some outliers. The non-Gaussian na-ture of the distribution (Fig. 3) may be partly due to the small sample size. The use of the median reduces the impact of outliers and then enables us to use the standard deviation to characterize the spread.
4 Summary
This study presents new estimates of observed OHC change since 1970 based on improved mapping methods and XBT bias corrections. Our results suggest that previous IPCC-AR5 observational estimates of a 0–700 m OHC change of
∼0.26 Wm−2 may be too low, typically by about ∼25 % compared to our findings here (∼0.35 Wm−2), supporting the conclusions of Durack et al. (2014) based on some-what different constraints. Our estimates of full-depth OHC change show remarkably good agreement with the CMIP5 ensemble median response during 1970–2005 and give us
confidence that the climate models are not systematically bi-ased in their simulation of historical variations in Earth’s en-ergy imbalance over this period.
The present work demonstrates how improvements in OHC estimation methods have led to a greater degree of consistency with climate model simulations of long-term changes in Earth’s energy budget. In turn this allows an eval-uation of the models and suggests that some may not be cred-ible. Further work is needed to understand the spatial pat-terns of ocean heat uptake and TOA changes over the histor-ical past as a means of assessing potential model deficiencies in key processes. Since 93 % of the energy of global warm-ing is stored in the ocean, our observation-based results in-dicate that the ocean component of Earth’s heat imbalance is∼0.38 [0.33, 0.43] Wm−2from 1970 to 1991 and∼0.75 [0.71, 0.80] Wm−2from 1992 to 2005. With 0.07 Wm−2for the other components (Trenberth et al. 2014), the implied av-erage energy imbalance is 0.46 [0.40, 0.52] Wm−2after 1970
and 0.82 [0.76, 0.88] Wm−2after 1992. For the period 1970– 2005, our new value is about 15 % larger than the central es-timate of Rhein et al. (2013) over the same period, and could have important implications for closure of the sea-level bud-get.
5 Data availability
The CZ14 data and CMIP5 OHCs are available at http: //159.226.119.60/cheng/ and data access to ORAS4 OHC is available at https://climatedataguide.ucar.edu/climate-data/ oras4-ecmwf-ocean-reanalysis-and-derived-ocean-heat-content.
Acknowledgements. Lijing Cheng and Jiang Zhu are supported by National Natural Science Foundation of China (41506029) and Chinese Academy of Sciences’ project “Western Pacific Ocean System: Structure, Dynamics and Consequences” (XDA11010405). Matthew D. Palmer is supported by the Joint UK DECC/Defra Met Office Hadley Centre Climate Programme (GA01101) and his work represents a contribution to Natural Environment Research Council DEEP-C project NE/K005480/1. Kevin E. Trenberth is supported by DOE grant DE-SC0012711. NCAR is sponsored by the National Science Foundation. We thank NOAA/NODC, who made the observational ocean temperature data set available. We acknowledge the World Climate Research Programme’s Working Group on Coupled Modelling, which is responsible for CMIP, and we thank the climate modeling groups (listed in Table 1 of this paper) for producing and making available their model output. For CMIP the US Department of Energy’s Program for Climate Model Diagnosis and Intercomparison provides coordinating support and led development of software infrastructure in partner-ship with the Global Organization for Earth System Science Portals.
Edited by: M. Hecht
References
Abraham, J. P., Reseghetti, F., Baringer, M., Boyer, T., Cheng, L., Church, J., Domingues, C., Fasullo, J. T., Gilson, J., Goni, G., Good, S., Gorman, J. M., Gouretski, V., Ishii, M., Johnson, G. C., Kizu, S., Lyman, J., MacDonald, A., Minkowycz, W. J., Mof-fitt, S. E., Palmer, M., Piola, A., Trenberth, K. E., Velicogna, I., Wijffels, S., and Willis, J.: A review of global ocean temperature observations: implications for ocean heat content estimates and climate change, Rev. Geophys., 51, 450–483, 2013.
Balmaseda, M. A., Trenberth, K. E., and Källén, E.: Distinctive cli-mate signals in reanalysis of global ocean heat content, Geophys. Res. Lett., 40, 1–6, doi:10.1002/grl.50382, 2013.
Boyer, T. P., Antonov, J. I., Baranova, O. K., Boyer, T. P., Coleman, C. L., Garcia, H. E., Grodsky, A. I., Johnson, D. R., Locarnini, R. A., Mishonov, A. V., Reagan, J. R., Sazama, C. L., Seidov, D., Smolyar, I., Yarosh, E. S., and Reagan, J. R.: World Ocean Database 2013, edited by: Levitus, S. and Mishonov, A., NOAA Atlas NESDIS 72, 209 pp., 2013.
Cheng, L. and Zhu, J.: Artifacts in variations of ocean heat content induced by the observation system changes, Geophys. Res. Lett., 20, 7276–7283, 2014.
Cheng, L. and Zhu, J.: Influences of the choice of climatology on ocean heat content estimation, J. Atmos. Ocean. Technol., 32, 388–394, 2015.
Cheng, L., Zhu, J., Cowley, R., Boyer, T., and Wijffels, S.: Time, probe type and temperature variable bias corrections to historical expendable bathythermograph observations, J. Atmos. Ocean. Technol., 31, 1793–1825, 2014.
Cheng, L., Zhu, J., and Abraham, J.: Global upper ocean heat content estimation: recent progress and the remain-ing challenges, Atmos. Ocean. Sci. Lett., 8, 333–338, doi:10.3878/AOSL20150031, 2015a.
Cheng, L., Abraham, J., Goni, G., Boyer, T., Wijffels, S., Cowley, R., Gouretski, V., Reseghetti, F., Kizu, S. Dong, S., Bringas, S., Goes, M., Houpert, L., Sprintall, J., and Zhu, J.: XBT Science: assessment of instrumental biases and errors, B. Am. Meteorol. Soc., 97, 924–933, doi:10.1175/BAMS-D-15-00031.1, 2015b. Church, J. A., White, N. J., and Arblaster, J. M.: Significant
decadal-scale impact of volcanic eruptions on sea level and ocean heat content, Nature, 438, 74–77, 2005.
Church, J. A., White, N. J., Konikow, L. F., Domingues, C. M., Cogley, J. G., Rignot, E., Gregory, J. M., van den Broeke, M. R., Monaghan, A. J., and Velicogna, I.: Revisiting the Earth’s sea-level and energy budgets from 1961 to 2008, Geophys. Res. Lett., 38, L18601–L18608, 2011.
Domingues, C. M., Church, J. A., White, N. J., Gleckler, P. J., Wijf-fels, S. E., Barker, P. M., and Dunn, J. R.: Improved estimates of upper-ocean warming and multi-decadal sea-level rise, Nature, 453, 1090–U1096, 2008.
Durack, P. and Wijffels, S.: Fifty-year trends in global ocean salin-ities and their relationship to broad-Scale warming, J. Climate, 23, 4342–4362, 2010.
Durack, P., Gleckler, P. J., Landerer, F., and Taylor, K. E.: Quantify-ing underestimates of long-term upper-ocean warmQuantify-ing, Nature Climate Change, 4, 999–1005, doi:10.1038/NCLIMATE2389, 2014.
Flato, G., Marotzke, J., Abiodun, B., Braconnot, P., Chou, S. C., Collins, W., Cox, P., Driouech, F., Emori, S., Eyring, V., Forest, C., Gleckler, P., Guilyardi, E., Jakob, C., Kattsov, V., Reason C.,
and Rummukainen, M.: Evaluation of climate models, in: Cli-mate Change 2013: The Physical Science Basis, Contribution of Working Group I to the Fifth Assessment Report of the Intergov-ernmental Panel on Climate Change, edited by: Stocker, T. F., Qin, D., Plattner, G. K., Tignor, M., Allen, S. K., Boschung, J., Nauels, A., Xia, Y., Bex, V., and Midgley, P. M., Cambridge Uni-versity Press, Cambridge, United Kingdom and New York, NY, USA, 777–787, 2013.
Forest, C. E., Stone, P. H., and Sokolov, A. P.: Constraining climate model parameters from observed 20th century changes, Tellus A, 60, 911–920, doi:10.1111/j.1600-0870.2008.00346.x, 2008. Frölicher, T., Sarmiento, J. L., Paynter, D. J., Dunne, J. P.,
Krast-ing, J. P., and Winton, M.: Dominance of the Southern Ocean in Anthropogenic Carbon and Heat Uptake in CMIP5 Models, J. Climate, 28, 862–886, 2015.
Gleckler, P. J., Santer, B. D., Domingues, C. M., Pierce, D. W., Bar-nett, T. P., Church, J. A., Taylor, K. E., AchutaRao, K. M., Boyer, T. P., Ishii, M., and Caldwell, P. M.: Human-induced global ocean warming on multidecadal timescales, Nature Climate Change, 2, 524–529, 2012.
Gleckler, P. J., Durack, P. J., Stouffer, R. J., Johnson, G. C., and Forest, C. E.: Industrial-era global ocean heat uptake dou-bles in recent decades, Nature Climate Change, 6, 394–398, doi:10.1038/nclimate2915, 2016.
Gouretski, V. and Koltermann, K. P.: How much is the ocean really warming?, Geophys. Res. Lett., 34, L01610, doi:10.1029/2006GL027834, 2007.
Hobbs, W., Palmer, M., and Monselesan, D.: An energy conserva-tion analysis of ocean drift in the CMIP5 global coupled mod-els, J. Climate, 29, 1639–1653, doi:10.1175/JCLI-D-15-0477.1, 2015.
Ishii, M. and Kimoto, M.: Reevaluation of historical ocean heat con-tent variations with time-varying XBT and MBT depth bias cor-rections, J. Oceanogr., 65, 287–299, 2009.
Ishii, M., Kimoto, M., and Kachi, M.: Historical ocean subsurface temperature analysis with error estimates, Mon. Weather Rev., 131, 51–73, 2003.
Kuhlbrodt, T. and Gregory, J. M.: Ocean heat uptake and its conse-quences for the magnitude of sea level rise and climate change, Geophys. Res. Lett., 39, L18608, doi:10.1029/2012GL052952, 2012.
Levitus, S., Antonov, J., and Boyer, T.: Warming of the worldocean, 1955–2003, Geophys. Res. Lett., 32, L02604, doi:10.1029/2004GL021592, 2005.
Levitus, S., Antonov, J. I., Boyer, T. P., Baranova, O. K., Garcia, H. E., Locarnini, R. A., Mishonov, A. V., Reagan, J. R., Seidov, D., Yarosh, E. S., and Zweng, M. M.: World ocean heat content and thermosteric sea level change (0–2000 m), 1955–2010, Geophys. Res. Lett., 39, L10603, doi:10.1029/2012GL051106, 2012. Loeb, N. G., Lyman, J. M., Johnson, G. C., Allan, R. P., Doelling,
D. R., Wong, T., Soden, B. J., and Stephens, G. L.: Observed changes in top-of-the-atmosphere radiation and upper-ocean heating consistent within uncertainty, Nat. Geosci. 5, 110–113, 2012.
Lyman, J. M., Good, S. A., Gouretski, V. V., Ishii, M., Johnson, G. C., Palmer, M. D., Smith, D. M., and Willis, J. K.: Robust warming of the global upper ocean, Nature, 465, 334–337, 2010. Mann, M. E., Cane, M. A., Zebiak, S. E., and Clement, A.: Volcanic and solar forcing of the tropical pacific over the past 1000 years, J. Climate, 18, 447–456, 2005.
Mayer, M. K., Trenberth, K. E., Haimberger, L., and Fasullo, J. T.: The response of tropical atmospheric energy budgets to ENSO, J. Climate, 26, 4710–4724, doi:10.1175/JCLI-D-12-00681.1, 2013. Meehl, G. A., Covey, C., Delworth, T., Mojib, L., McAvaney, B., Mitchell, J. F. B., Stouffer, R. J., and Taylor, K. E.: The WCRP CMIP3 multimodel dataset: a new era in climate change re-search, B. Am. Meteorol. Soc., 88, 1383–1394, 2007.
Myhre, G., Shindell, D., Bréon, F. M., Collins, W., Fuglestvedt, J., Huang, J., Koch, D., Lamarque, J. F., Lee, D., Mendoza, B., Nakajima, T., Robock, A., Stephens, G., Takemura, T., and Zhang, H.: Anthropogenic and Natural Radiative Forcing, in: Climate Change 2013: The Physical Science Basis, Contribution of Working Group I to the Fifth Assessment Report of the Inter-governmental Panel on Climate Change edited by: Stocker, T. F., Qin, D., Plattner, G. K., Tignor, M., Allen, S. K., Boschung, J., Nauels, A., Xia, Y., Bex, V., and Midgley, P. M., Cambridge Uni-versity Press, Cambridge, United Kingdom and New York, NY, USA, 659–740, 2013.
Palmer, M. D. and Haines, K.: Estimating oceanic heat content change using isotherms, J. Climate, 22, 4953–4969, 2009. Palmer, M., Antonov, J., Barker, P., Bindoff, N., Boyer, T., Carson,
M., Domingues, C. M., Gille, S., Gleckler, P., Good, S., Gouret-ski, V., Guinehut, S., Haines, K., Harrison, D. E., Ishii, M., John-son, G. C., Levitus, S., Lozier, M. S., Lyman, J. M., Meijers, A., von Schuckmann, K., Smith, D., Wijffels, S., and Gouretski, V.: Future observations for monitoring globalocean heat content, in Proceedings of the OceanObs’ 09: Sustained Ocean Observations and Information for Society Conference, September 2009, edited by: Hall, J., Harrison, D. E., and Stammer, D., 2, 21–25, ESA Publication WPP-306, Venice, Italy, 2010.
Palmer, M. D. and McNeall, D. J.: Internal variability of Earth’s en-ergy budget simulated by CMIP5 climate models, Environ. Res. Lett., 9, 034016, doi:10.1088/1748-9326/9/3/034016, 2014. Palmer, M. D., Good, S. A., Haines, K., Rayner, N. A., and Stott,
P. A.: A new perspective on warming of the global oceans, Geo-phys. Res. Lett., 36, L20709, doi:10.1029/2009GL039491, 2009. Palmer, M. D., Roberts, C. D., Balmaseda, M., Chang, Y.-S., Chep-urin, G., Ferry, N., Fujii, Y., Good, S. A., Guinehut, S., Haines, K., Hernandez, F., Köhl, A., Lee, T., Martin, M. J., Masina, S., Masuda, S., Peterson, K. A., Storto, A., Toyoda, T., Valdivieso, M., Vernieres, G., Wang, O., and Xue, Y.: Ocean heat content variability and change in an ensemble of ocean reanalyses, Clim. Dynam., 1-22, doi:10.1007/s00382-015-2801-0, 2015.
Purkey, S. and Johnson, G.: Warming of global abyssal and deep southern ocean waters between the 1990s and 2000s: contribu-tions to global heat and sea level rise budgets, J. Climate, 23, 6336–6351, 2010.
Rhein, M., Rintoul, S. R., Aoki, S., Campos, E., Chambers, D., Feely, R. A., Gulev, S., Johnson, G. C., Josey, S. A., Kostianoy, A., Mauritzen, C., Roemmich, D., Talley, L. D., and Wang F.: Ob-servations: Ocean, in: Climate Change 2013: The Physical Sci-ence Basis, Contribution of Working Group I to the Fifth Assess-ment Report of the IntergovernAssess-mental Panel on Climate Change, edited by: Stocker, T. F., Qin, D., Plattner, G. K., Tignor, M., Allen, S. K., Boschung, J., Nauels, A., Xia, Y., Bex, V., and Midgley, P., Cambridge Univ. Press, Cambridge, UK, and New York, 261–265, 2013.
Roemmich, D. and Gilson, J.: The global ocean imprint of ENSO, Geophys. Res. Lett., 38, L13606, doi:10.1029/2011GL047992, 2011.
Roemmich, D., Church, J., Gilson, J., Monselesan, D., Sutton, P., and Wijffels, S.: Unabated planetary warming and its ocean structure since 2006, Nature Climate Change, 5, 240–245, doi:10.1038/nclimate2513, 2015.
Sen Gupta, A., Jourdain, N. C., Brown, J. N., and Monselesan, D.: Climate drift in the CMIP5 Models, J. Climate, 26, 8597–8615, 2013.
Smith, D. M. and Murphy, J. M.: An objective ocean tem-perature and salinity analysis using covariances from a global climate model, J. Geophys. Res. Oceans, 11, C02022, doi:10.1029/2005JC003172, 2007.
Taylor, K. E., Stouffer, R. J., and Meehl, G. A.: An overview of cmip5 and the experiment design, B. Am. Meteorol. Soc., 93, 485–498, 2012.
Trenberth, K., Fasullo, J., and Balmaseda, M.: Earth’s energy im-balance, J. Climate, 27, 3129–3144, 2014.
Trenberth, K. E.: Has there been a hiatus?, Science, 349, 691–692, doi:10.1126/science.aac9225, 2015.
Trenberth, K. E. and Fasullo, J. T.: Tracking earth’s energy: from El Niño to global warming, Surv. Geophys., 33, 413–426, 2012. von Schuckmann, K., Sallée, J.-B., Chambers, D., Le Traon, P.-Y.,
Cabanes, C., Gaillard, F., Speich, S., and Hamon, M.: Consis-tency of the current global ocean observing systems from an Argo perspective, Ocean Sci., 10, 547–557, doi:10.5194/os-10-547-2014, 2014.
von Schuckmann, K., Palmer, M. D., Trenberth, K. E., Cazenave, A., Chambers, D., Champollion, N., Hansen, J., Josey, S. A., Loeb, N., Mathieu, P.-P., Meyssignac, B., and Wild, M.: An im-perative to monitor Earth’s energy imbalance, Nature Climate Change, 6, 138–144, 2016.