Iran J Public Health, Vol. 46, No.9, Sep 2017, pp.1211-1216
Original Article
The Relationship between Type 2 Diabetes and Platelet
Indicators
Xiangyu CHEN
1,
Le FANG
1, Hongbo LIN
2, Peng SHEN
2, Tao ZHANG
3, Hui LI
3,
Xiaoyong LI
2, Min YU
1, Chunxiao XU
1, Jie ZHANG
1, Feng LU
1, Xiaofu DU
1, Ruying
HU
1, *Jieming ZHONG
11. Zhejiang Provincial Center for Disease Control and Prevention, Hangzhou, P.R. China 2. Yinzhou District Center for Disease Control and Prevention, Ningbo, P.R. China 3. Ningbo Municipal Center for Disease Control and Prevention, Ningbo, P.R. China
*Corresponding Author: Email: [email protected]
(Received 11 Sep 2016; accepted 19 Feb 2017)
Introduction
The platelets play significant roles in the integrity of normal homeostasis and atherosclerosis pro-cess (1, 2). They are also closely associated with cardiovascular events. There were numerous studies on the role of platelets in cardiovascular events during last decades, many of them focused on thrombotic complications. The thromboxane generation increased in patients with thrombotic complications (3), especially in the cardiovascular diseases patients with poor glycemic control (4).
Diabetes mellitus (DM) has been considered as a ‘prothrombotic state’ with enhanced platelet reac-tivity (5), researchers found the morphological changes of platelets and the increased platelet activity occurred in diabetic patients (6).
Among the Chinese adults, the estimated preva-lence of diabetes was 11.6% while the prevapreva-lence of prediabetes was 50.1% (7). Taking the total number of Chinese populations into considera-tion, there were approximate 113.9 million
diabe-Abstract
Background: Currently, the studies on the relationship between type 2 diabetes and platelets indicators were carried out on a selective small sample population generally. Large sample studies in this area are rare, especially in Chinese population. In this study, we aimed to investigate the relationship between type 2 diabetes and the mean platelet vol-ume (MPV), platelet count (PLT) and platelet distribution width (PDW).
Methods: This is a cross-sectional analysis of the routine health examination data from 20128 participants with com-plete baseline data in Yinzhou District 2013. The detection of indicators in this study was comcom-pleted by automatic hematology analyzer.
Results: The PDW and PLT were not significantly different between diabetic group and non-diabetic group, (16.00% vs. 16.00%, P=0.88, and 194*109/L vs. 196*109/L, P=0.05 respectively). The MPV was significantly higher in diabetic
group (9.3fl vs. 9.2fl, P<0.05). MPV was an independent risk factor of diabetes mellitus (Unadjusted OR=1.07 (95% CI: 1.03, 1.11), Adjusted for age, sex OR=1.07 (95% CI: 1.02, 1.12)). The adjusted odds ratio of diabetes rose with increasing MPV levels and were most pronounced in subjects with MPV levels exceeding the 90th percentile (MPV≥10.70 fl, Crude or=1.23 adjusted or=1.19).
Conclusion: There was no relationship between the presence of diabetes with PDW and PLT. The MPV was inde-pendently associated with the presence of diabetes.
tes patients and 493.4 million people with predia-betes (7), indicating that diapredia-betes has become a major public health problem in China. Higher MPV values have recently been shown in patients with proliferative diabetic retinopathy (8). Since microvascular, complications of DM are im-portant causes of morbidity and medical expendi-ture, to determine indicators of these complica-tions such as MPV will be highly beneficial. Currently, the studies on the relationship between platelet and diabetes were carried out on a selec-tive small sample population generally. Large sample studies in this area are rare, especially in Chinese population.
This study was conducted to explore the relation-ship between selected platelet indicators (MPV, PDW, PLT) and prevalence of diabetes.
Materials and Methods
This study was carried out in Yinzhou District; Ningbo 2013. Totally, 20128 subjects come from a random sample of 7 towns in the district. The data of the subjects come from the local health information platform. In this study, we defined diabetes patients as fasting glucose≥126mg/dl, 2h postprandial glucose≥200mg/dl, or treatment with insulin or oral hypoglycemic drugs. The da-taset of 20128 subjects having all non-missing values for diabetes, platelet indicators, was de-fined as the complete case dataset and was used for domain analysis. The level of significance (α) was kept at 5%. Odds ratios and 95% confidence interval were estimated by logistic regression, the selection of confounding factors in logistic re-gression model refer to the similar study in this field (1). Because the goodness-of-fit tests for normal distribution of these indicators show that the indicators were not normally distributed (P<0.01), the median (interquartile (IQR)) for the indicators was used in the descriptive analyses (1). In regression analyses on the indicators, however, the continuous indicators were used according to the central limit theorem because the sample size is quite large (9).
Results
Characteristics of subjects and platelet indi-cators information according to diabetic sta-tus
The median age of the subjects was 62 yr old (IQR 55–69 yr old). Other characteristics of sub-jects were presented in Table 1.
Of the 20128 subjects, 2473 had diabetes; the proportion was 12.29%. The proportion of hy-pertension was 47.76%. There were 7780 subjects with hypertriglyceridemia; the proportion was 38.65%. There were 4200 subjects with low HDL cholesterol, the proportion was 20.87%.
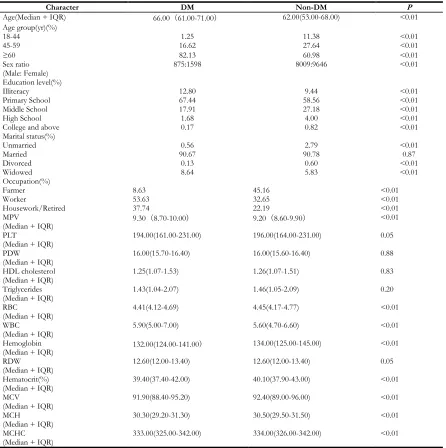
Table 2 reports the baseline and platelet indica-tors information in subjects with and without diabetes. MPV was significantly higher in the subjects with diabetes (9.30 vs. 9.20 femtoliter (fL), P<0.01). Of all the subjects, those diagnosed with diabetes had elder age (P<0.01). The female proportion was higher in the diabetic group (P<0.01). There was no significant difference in PLT, PDW, HDL cholesterol and triglycerides between subjects with and without diabetes. The WBC was higher in the diabetic cases while the other indictors of CBC were higher in the nondiabetic cases (Table 1).
Linear association of fasting serum glucose with platelet indicators
Table 2 reports the linear association of fasting serum glucose with platelet indicators and the confounding factors. The fasting serum glucose was positively correlated with age, triglycerides, PDW, PLT and MPV. There was no linear asso-ciation of fasting serum glucose with HDL cho-lesterol (Table 2).
MPV in different characteristic group of sub-jects
Table 1:Demographic and baseline information of the participants according to diabetic status
Character DM Non-DM P
Age(Median + IQR) 66.00(61.00-71.00) 62.00(53.00-68.00) <0.01
Age group(yr)(%)
18-44 1.25 11.38 <0.01
45-59 16.62 27.64 <0.01
≥60 82.13 60.98 <0.01
Sex ratio
(Male: Female) 875:1598 8009:9646 <0.01
Education level(%)
Illiteracy 12.80 9.44 <0.01
Primary School 67.44 58.56 <0.01
Middle School 17.91 27.18 <0.01
High School 1.68 4.00 <0.01
College and above 0.17 0.82 <0.01
Marital status(%)
Unmarried 0.56 2.79 <0.01
Married 90.67 90.78 0.87
Divorced 0.13 0.60 <0.01
Widowed 8.64 5.83 <0.01
Occupation(%)
Farmer 8.63 45.16 <0.01
Worker 53.63 32.65 <0.01
Housework/Retired 37.74 22.19 <0.01
MPV
(Median + IQR) 9.30(8.70-10.00) 9.20(8.60-9.90)
<0.01
PLT
(Median + IQR)
194.00(161.00-231.00) 196.00(164.00-231.00) 0.05
PDW (Median + IQR)
16.00(15.70-16.40) 16.00(15.60-16.40) 0.88
HDL cholesterol (Median + IQR)
1.25(1.07-1.53) 1.26(1.07-1.51) 0.83
Triglycerides (Median + IQR)
1.43(1.04-2.07) 1.46(1.05-2.09) 0.20
RBC
(Median + IQR)
4.41(4.12-4.69) 4.45(4.17-4.77) <0.01
WBC
(Median + IQR)
5.90(5.00-7.00) 5.60(4.70-6.60) <0.01
Hemoglobin
(Median + IQR) 132.00(124.00-141.00)
134.00(125.00-145.00) <0.01
RDW (Median + IQR)
12.60(12.00-13.40) 12.60(12.00-13.40) 0.05
Hematocrit(%) (Median + IQR)
39.40(37.40-42.00) 40.10(37.90-43.00) <0.01
MCV
(Median + IQR)
91.90(88.40-95.20) 92.40(89.00-96.00) <0.01
MCH (Median + IQR)
30.30(29.20-31.30) 30.50(29.50-31.50) <0.01
MCHC (Median + IQR)
333.00(325.00-342.00) 334.00(326.00-342.00) <0.01
Demographic features listed including age, sex, education level, marital status and occupation
Data are presented as median (IQR) or percent. P values were obtained by linear regression and chisq test
Table 2:Linear association of fasting serum glucose with platelet indicators
Variable Estimated parameters SE. t P
Fasting serum glucose
Age 0.13 0.001 18.38 <0.01
Triglycerides 0.11 0.008 15.27 <0.01
PDW 0.05 0.005 7.49 <0.01
PLT 0.06 0.000 6.94 <0.01
MPV 0.03 0.009 3.54 <0.01
HDL cholesterol 0.001 0.008 0.08 0.94
Estimated parameters stands for standardized beta
Table 3: MPV in different characteristic group of subjects
Character YES(Median + IQR) NO(Median + IQR) P
Diabetes 9.30(8.70-10.00) 9.20(8.60-9.90) <0.01
Hypertension 8.90(8.40-9.56) 9.60(8.90-10.40) <0.01
Male 9.20(8.50-9.90) 9.30(8.60-10.00) <0.01
Low HDL Cholesterol 9.30(8.60-10.10) 9.20(8.60-9.90) <0.01
Hypertriglyceridemia 9.20(8.60-9.80) 9.30(8.60-10.00) <0.01
Data are presented as median (IQR). P-values were obtained by linear regression
MPV was significantly higher in the subjects without hypertriglyceridemia (9.30 vs. 9.20 fL,
P<0.01) (Table 3).
The diabetes prevalence by each MPV quartile To understand better, the relationship between MPV and diabetes prevalence, we divided the MPV into quartiles. As shown in Table 4, the di-abetes prevalence increased with increasing MPV quartiles (The difference of diabetes prevalence was compared by chi-square trend test) (Table 4).
Odds ratio of diabetes with elevated MPV levels
The multivariable model was applied to quantita-tively assess the risk the MPV brings to the dia-betic prevalence. The unadjusted odds ratio was 1.07, the 95% confidence interval was (1.03, 1.11). After adjusting age, sex, hypertension, PDW, PLT, HDL cholesterol and Triglycerides, the odds ratio was 1.07 and the 95% confidence interval was (1.02, 1.12).
Table 4:The diabetes prevalence by each MPV quartile
Quartile DM Non-DM Prevalence(%) P
1st 607 4927 10.97 <0.01
2nd 583 4220 12.14
3rd 607 4184 12.67
4th 676 4324 13.52
P-value was obtained by chi-square trend test
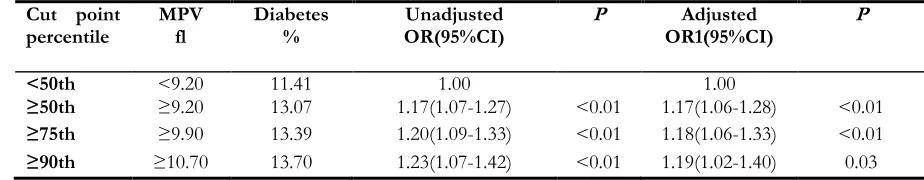
As shown in Table 5, when compared with the subjects with the MPV level less than 50th (<9.20 fl), the odds ratio of having diabetes rose with increasing MPV levels. In a multivariable model
adjusted for age, sex, the adjusted odds ratios were obtained. The adjusted odds ratios were lower than the unadjusted ones (Table 5).
Table 5:Odds ratio of diabetes with elevated MPV levels*
Cut point
percentile MPV fl Diabetes % OR(95%CI) Unadjusted P OR1(95%CI) Adjusted P
<50th <9.20 11.41 1.00 1.00
≥50th ≥9.20 13.07 1.17(1.07-1.27) <0.01 1.17(1.06-1.28) <0.01
≥75th ≥9.90 13.39 1.20(1.09-1.33) <0.01 1.18(1.06-1.33) <0.01
≥90th ≥10.70 13.70 1.23(1.07-1.42) <0.01 1.19(1.02-1.40) 0.03
* The P-values of OR in the table were obtained by comparison with MPV level less than 50th
DM is a complex disease characterized by chron-ic hyperglycemia responsible for complchron-ications affecting the kidneys, eyes, peripheral nerves, and micro and macrovascular systems. The reported prevalence of diabetes in these 7 towns was 3.89% while the diabetes proportion among the subjects was 12.29%. The main cause of this dif-ference might be the subjects are older and the diabetes patients focus more on their health. This is the largest study so far to explore the rela-tionship between the platelet indicators and dia-betes in a large unselected population at present in China.
In this study, the platelet indicators, known as PDW and PLT, were not significantly different between diabetic patients and non-diabetic popu-lation.
The MPV is a marker of platelet size and an easi-ly measured platelet indicator, which increase during platelet activation. In this study, the MPV was significantly higher in the diabetic patients. The prevalence of diabetes increased with the increasing MPV levels. This is consistent with other studies that have also reported the increase in MPV in diabetic patients in comparison with non-diabetic controls (1,2,10,11). The mechanism why the MPV were higher in diabetes patients was not yet fully understood (1). The hypergly-cemia status in diabetes patients cause the osmot-ic swelling and lead to the increased MPV finally (12). The insulin may cause the generate of larger platelets by megakaryocytes (13). The clear mech-anism of this relationship needs to be explored in the further study.
Limitations of our study
In this study, we only find the relationship be-tween type 2 diabetes and platelet indicators, the clear mechanism of this relationship still needs to be explored. Also, this relationship in type 1 dia-betes has not involved.
MPV was associated with diabetes prevalence. The adjusted odds ratio was lower than the unad-justed one because of the uneven distribution of the confounding factors, known as age and sex.
Conclusion
There was no relationship between type 2 diabe-tes with PDW and PLT. The MPV was inde-pendently associated with type 2 diabetes.
Ethical considerations
Ethical issues (Including plagiarism, Informed Consent, misconduct, data fabrication, double publication and/or submission, redundancy, etc.) have been completely checked by the authors.
Acknowledgements
This study was supported by Zhejiang Provincial Public Welfare Technology Applied Research Projects (No. 2015C33099). We are grateful to Le Fang, Hongbo Lin, Peng Shen, Chunxiao Xu, for their invaluable help in field investigations and calculations.
Conflict of Interests
The authors declare that there is no conflict of interest.
References
1. Shah B, Sha D, Xie D, et al (2012). The Relation-ship Between Diabetes, Metabolic Syndrome, and Platelet Activity as Measured by Mean Platelet Volume The National Health and Nutrition Examination Survey, 1999–2004. Diabetes Care, 35(5): 1074-8.
2. Zuberi B, Akhtar N, Afsar S (2008). Comparison of mean platelet volume in patients with dia-betes mellitus, impaired fasting glucose and non-diabetic subjects. Singapore Med J, 49(2): 114-6.
3. Zahavi J, Zahavi M, Firsteter E, et al (1991). An abnormal pattern of multiple platelet function abnormalities and increased thromboxane generation in patients with primary thrombo-cytosis and thrombotic complications. Eur J Haematol, 47(5): 326-332.
1346-9.
5. Jindal S, Gupta S, Gupta R, et al (2011). Platelet indices in diabetes mellitus: indicators of dia-betic microvascular complications. Hematology, 16(2):86-9.
6. Mustand J, Packham M (1984). Platelets and dia-betes mellitus. N Engl J Med, 311:665-667. 7. Xu Y, Wang L, He J, et al (2013). Prevalence and
control of diabetes in Chinese adults. JAMA, 310(9): 948-59.
8. Ates O, Kiki I, Bilen H, et al (2009). Association of mean platelet volume with the degree of retinopathy in patients with diabetes mellitus. Eur J Gen Med, 6(2):99–102.
9. Lumley T, Diehr P, Emerson S, et al (2002). The importance of the normality assumption in large public health data sets. Annu Rev Public
Health, 23: 151-69.
10. Saigo K, Yasunaga M, Ryo R, et al (1992). Mean platelet volume in diabetics. Rinsho Byori, 40(2): 215-7.
11. Hekimsoy Z, Payzin B, Ornek T, Kandoğan G (2004). Mean platelet volume in Type 2 dia-betic patients. J Diabetes Complications, 18(3):173-6.
12. Martyn CN, Matthews DM, Popp-Snijders C, et al (1986). Effects of sorbinil treatment on erythrocytes and platelets of persons with di-abetes. Diabetes Care.9:36–9