IJEDR1801085
International Journal of Engineering Development and Research (
www.ijedr.org
)
492
A Linear Programming Approach For Optimal Relay
Coordination Of Numerical Overcurrent Relay
Nikunj K. Chauhan
Electrical Engineer & Training Coordinator STELMEC Limited, Ahmedabad, Gujarat, India
Abstract:- The transmission line fault results in a much larger postfault current than the prefault load current. So overcurrent relaying is widely used for transmission lines. The speed of relaying and selectivity can be sacrificed, to some extent, in LV or MV lines. The other line relays like distance protection relays are too expensive. The percentage cost of the protection, which can be justified is around 10% to 15% of the cost of the equipment or section to be protected. Hence directional overcurrent relays are commonly used as an economic alternative for the protection of interconnected sub transmission systems, distribution systems, or as a secondary protection of transmission systems. Nowadays, “Numerical
Overcurrent relays” are widely used. So we have considered numerical relay in our case-study. The most important task
when installing numerical overcurrent relay on the system is selecting their suitable settings such that their basic protection function is met under sensitivity, selectivity, reliability and speed. The settings should be designed for minimum relay time of operation. That is, the settings should be such that the overall time of operation is minimized while maintaining the selectivity and reliability. Thus, the numerical relay problem is an optimization problem, where the solution is the optimal settings of each relay. Various methods have been proposed to formulate and find the optimal solution for the numerical overcurrent relay problem. In, this paper the proposed techniques are discussed. In this paper the data taken for research is of the real field of The power system at TATA Motors Ltd, Pimpri. The problem is formulated as linear programming problem as a basic case study. The problem is solved using linprog function of the optimization toolbox of the MATLAB software.
Keywords:- Linear Programming, Numerical Overcurrent Relay, Power System Protection, Relay Coordination
I.
INTRODUCTIONThe low voltage line is basically a radial line. The problem of transient stability does not exist for a redial line. However, the problems of power quality and voltage dip have become more significant nowadays for the LV and MV lines. So if the operation of the relay takes more time then the voltage dip caused by the fault persists for a longer time. This is critical for industrial and urban loads and especially for metros. This motivates to find out solutions to this problem in various ways.
II.
LINEAR PROBLEM FORMULATION USING ANUMERICAL RELAYIn the coordination problem, aim is to calculate the TDS and Ip, which would minimize the time of operation of the relays. The coordination problem of numerical relays can be stated as follows:
Objective = min ∑ W’i x Tik (1)
Where Tik indicates the operation time of the relay Ri for a fault in zone k and Wi is a coefficient and is usually set to 1. The objective is to minimize the time of operation of the relays under the following constraints.
Coordination Criteria Tnk — Tik ≥ ΔT (2)
where Tnk is the operation time of the first backup of Ri for a given fault in protection zone k. ΔT is the coordination time interval and is taken to be 0.05 seconds. The coordination time interval is the minimum interval that permits the backup relay to clear the fault in its operating zone.
B. Bound On Relay Settings And Operation Times
TDSimin ≤ TDSi ≤ TDSimax (3)
Ipimin ≤ Ipi ≤ Ipimax (4)
Tikmin ≤ Tik ≤ Tikmax (5)
IJEDR1801085
International Journal of Engineering Development and Research (
www.ijedr.org
)
493
such that it is less than the minimum fault current that passes through the relay. As the relay has to also protect for next zone fault as a backup relay, the minimum fault current will be for a fault at the end of the next section to beprotected.
C. Relay Characteristics
All relays are assumed identical and with characteristic functions approximated as:
Tik = [0.14*TDSi]
[(Iik/Ipi)^0.02 - 1] (6)
where Iik is the fault current passing through the relay for a fault in zone k. As we can see from the equation (6) that the non-linearity comes from pickup current term. For LP formulation, the pickup current is assumed to be known and as a result eq. (6) now takes the form as:
Tik = Pik x TDS (7)
where Pik is a constant depending on the values of Ipand fault current.
III.
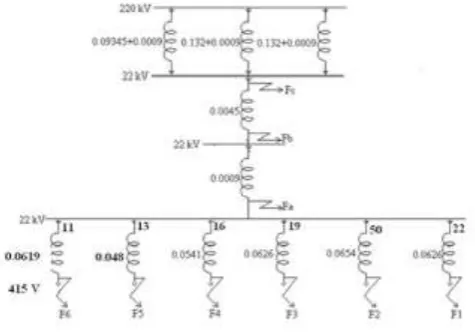
ABASIC CASE STUDY USING LINEAR PROGRAMMINGThis example is solved to understand the relay coordination aspects for a network. The linear programming approach explained in section II is implemented here. The network is as shown in figure 2 below.
In this case, each protection zone corresponds with one of the transmission lines. As we know the fault immediately after the breaker will have the maximum fault current. So now as per the fault occurs in the network considered the achieved minimum time discrimination of 0.05 seconds. If TDS is based on this calculation, then it will be true for all other fault locations that a minimum time interval of 0.05 seconds is always provided. This will ensure proper coordination as well as selectivity. The system data and the pickup current values are provided in the Table I. The minimum allowed TDS is taken as 0.01 and upper bound is taken as 1.1 in steps of 0.01. The objective function weights W0 I shown in eq.1 were all set equal to one because the lines are short and their lengths are approximately equal.
The objective is to be minimized is the sum of time of operation of the relays for fault in their own primary zone and located immediately after the respective breaker.
Fig. (1) System Taken for Case Study
IJEDR1801085
International Journal of Engineering Development and Research (
www.ijedr.org
)
494
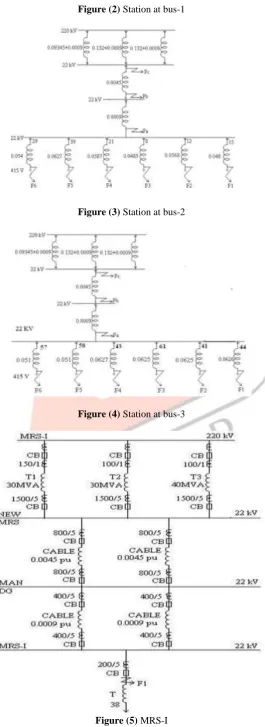
Figure (2) Station at bus-1Figure (3) Station at bus-2
Figure (4) Station at bus-3
IJEDR1801085
International Journal of Engineering Development and Research (
www.ijedr.org
)
495
Here we have consider a three phase symmetrical fault. The short circuit analysis was done for 3-phase symmetrical fault in three buses. A proper calculation was done for the system. All the required matrices f, A, b, lb, and ub were formed by writing the MATLAB program. The impedances of generators, transformers, cables and motors are contributing to the change in fault level at different locations.The data and calculation is shown in the tables 1, table 2 and table 3.
TABLE 1: - Data of Generators, Relays and Transformers
Generator 1 30 MVA 22 KV Z = 1.4285
Generator 2 30 MVA 22 KV Z = 1.4285
Generator 3 40 MVA 22 KV Z = 1.4285
Transformers-(2 of 5) 2 MVA, 11K / 415 V Transformers-(3 of 5) 22 MVA, 11K / 22 KV Short Circuit Ratio 0.447
Relay Number R1 R2 R3 R4 R5 R6
Pickup Setting (Amps)
300 60 240 200 200 80
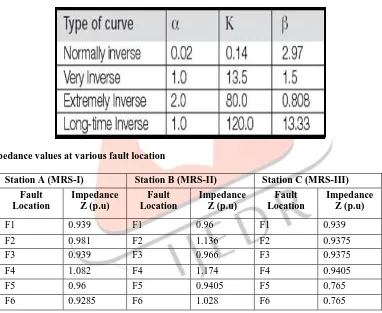
TABLE 2: - Values of different constants for Relay’s Different Characteristics
TABLE 3: - Impedance values at various fault location
Station A (MRS-I) Station B (MRS-II) Station C (MRS-III)
Fault Location Impedance Z (p.u) Fault Location Impedance Z (p.u) Fault Location Impedance Z (p.u)
F1 0.939 F1 0.96 F1 0.939
F2 0.981 F2 1.136 F2 0.9375
F3 0.939 F3 0.966 F3 0.9375
F4 1.082 F4 1.174 F4 0.9405
F5 0.96 F5 0.9405 F5 0.765
F6 0.9285 F6 1.028 F6 0.765
For the case study we have selected the values as:- k = 0.14
α = 0.02 β = 2.97
Plug Setting = 100% i.e. 1 Fault Current I = 19.70 kA
For first level, we assume TMS = 0.01.
The OLD-DG House and MAN-DG House contribute 1.68 kA and 2.54 kA respectively to the fault level at incomer of New MRS. So the changed fault level at the incomer of New MRS is 26.65 kA.
Short circuit ratio of all eight generators is 0.447. From the short circuit ratio we calculate the transient reactance and sub- transient reactance of the generator.
IJEDR1801085
International Journal of Engineering Development and Research (
www.ijedr.org
)
496
Total Fault Current = (Fault current contributedContributed by single generator) x 3 (8)
Here we do not consider the OLD-DG House and MAN-DG House then the values of impedance, Fault MVA and Fault current is calculated as under:-
Z(pu)T =0.039+0.0045+0.0009 – 0.1x(0.039+0.0045+0.0009) =0.0444 – 0.00444
We consider 10% negative tolerance as per IEC Standards So,
Z(pu)T =0.03996 pu
Fault MVA = 30 / (0.0996) =750.75
Fault Current = 750.75 / (√3 x22000) =19.70 kA
Now if we consider the OLD-DG House and MAN-DG House then the values of impedance, Fault MVA and Fault current is calculated as under:-
Xd = 1 / 0.447 = 2.237 pu
Also, sub-transient reactance is given by:-
Xd” = 0.2 x 2.237 = 0.4474 pu
MVA rating for all generators is 3.125. Hence fault MVA for all generators is given by:-
Fault MVA = 14.65 / 0.4474 = 32.74
Now fault current contributed by each generator at 6.6 kV is given by:- Fault Current = 32.74 / (√3 x 11)
= 1.72 kA
Let us consider any one generator. It is connected to another 6.6 kV bus through a cable of impedance 0.0009 pu. So total impedance is given by:-
Z = Xd” + 0.0009 =0.4474 + 0.0009 = 0.4484 pu
Fault MVA = 14.65 / 0.4484 = 32.74
Fault Current = 32.74 / (√3 x 11) = 1.72 kA
Now this generator, with cable of 0.0009 pu in series, is connected to 22kV bus through a step up transformer of 11/22 kV. So total impedance is given by:
ZT = (Xd” + 0.0009 +Z transformer) = (0.4474 + 0.0009 + 0.00617) = 0.4545 pu
Fault MVA = 14.65 / 0.4545 = 32.24
Fault Current = 32.24 / (√3 x 22) = 0.85 kA
IJEDR1801085
International Journal of Engineering Development and Research (
www.ijedr.org
)
497
by all generators = (Fault current contributed by single generator) x 3= 0.85 x 3 = 2.54 kA
From incomer of New MRS to outgoing feeder the fault impedance is increasing while the voltage remains constant resulting in decrease in fault level. At low voltage side of distribution transformers the voltage level is significantly lower than high voltage side as the transformation ratio is high. The effect of lower voltage level is more than the effect of increase in fault impedance which causes the fault level to rise considerably as compared to the 22 kV level.
RESULTS: -
We co-ordinated the over current relays from the outgoing feeder of MRS-I to incomer of New MRS. The actual operating time for the relays at
Outgoing feeder of MRS-I is 0.15 sec Incomer of MRS-I is 0.30 sec Outgoing feeder of MAN-DG is 0.40 sec Incomer of MAN-DG is 0.60 sec Outgoing of New MRS is 0.70 sec Incomer of New MRS is 0.90 sec
The fault currents obtained from short circuit analysis. After calculation enter all values in program and run the program. The
linprog function was finally executed in the MATLAB program and the results obtained are reproduced here: -
New MRS incomer has the highest fault level amongst all the 22 kV buses. The selected operating time for this circuit breaker for a fault of 19.7 kA at outgoing feeder of MRS-I is 0.9 sec. Therefore, for the changed fault level of 26.65 kA the sustainable time is
19.72 X 0.9 = 26.652X t t=0.5 sec.
For the system taken the fault clearing time obtained as per the real time settings is t = 0.5 sec for TDS as 0.05. According to the consideration and value taken in program the time of clearing fault (summation of all values of X) obtained is
t = 0.1216 + 0.0101 + 0.0833 + 0.0674 + 0.1019 + 0.0504
t = 0.4347 sec.
IV.
CONCLUSIONSIJEDR1801085
International Journal of Engineering Development and Research (
www.ijedr.org
)
498
results of Linear Programming based optimization are well in line with actual settings done. Though the fault level is maximum, fault will be cleared without any damage. The implementation can further be extended to bigger power system with more buses.REFERENCES [1] Oza, Nair, Mehta, Makwana, Tata McGraw Hill , 2010.
[2] D P Kothari, I J Nagrath, Modern Power System Analysis, Tata McGraw-Hill Publication, 2008. [3] V K Mehta, Rohit Mehta, Principles Of Power System, S Chand Prakashan, 4th revised edition, 2008. [4] Urdaneta A. J, Ramon N., Luis G.P.J “Optimal Coordination Of Directional Overcurrent Relays In Interconnected Power Systems”, IEEE Transactions on Power Delivery, Vol. 3, No. 3, July 1988. [5] Rashesh P Mehta, Optimal Relay Coordination, Journal Of Engineering And Technology, Sardar Patel University, Vol. 19, December 2006.
[6] H.Zeineldin, E.F.EI-Saadany, M.A.Salama, “Optimal Coordination Of Directional Overcurrent Relay Coordination”, Power Engineering Society General Meeting, IEEE CNF, June 12-16, 2005.
[7] www.google.com
[8] Wikipedia, the free encyclopedia
[9] User’s manual and technical description “Combine overcurrent and earth-fault relay SPAJ 140c” of ABB, www.abb.com
BIOGRAPHY: -
NIKUNJ K. CHAUHAN has received his M.E degree in Electrical Engineering Electrical Power System from Birla Vishvakarma Vidyalaya Engg. College, V.V. Nagar from Gujarat Technological University, Ahmedabad, India. He is currently working as a Trainee Electrical Engineer & Training Coordinator at STELMEC Ltd., Ahmedabad.