IJEDR1802047
International Journal of Engineering Development and Research (
www.ijedr.org
)
268
Optimization Of Process Parameters In Drilling
Using Taguchi Method
1P.Surendra, 2B.Krishna Murthy, 3M.V.Kiran Kumar 1Associate Professor, 2Assistant Professor, 3Assistant Professor
Department of Mechanical Engineering Sasi Institute of Technology and Engineering
T.P.Gudem Andhra Pradesh, India
_____________________________________________________________________________________________________ Abstract- Drilling is a metal cutting machine process used to create hole of circular cross section by employing a drill bit.
Several types of drill bits like H.S.S, carbide tool, TiN and TiAlN coated carbide and HSS twist drill etc. are used for drilling process in industries. The drilling operation is affected by various input parameters like speed, feed rate, depth of cut, cutting fluid, drill diameter, point angle etc. it is frequently used in automotive, aircraft and aerospace and dies or mold industries, home appliances, medical and electrical equipment industries. Thus, it needs to be cost effective along with the assurance of the quality specifications within the experimental limit. Taguchi methods are widely used for design of experiments and analysis of experimental data for optimization of processing conditions. The optimization of drilling process parameters using Taguchi technique is employed to obtain minimum surface roughness (Ra), machining time and maximum material removal rate. A number of drilling experiments is has been conducted using the L9 orthogonal
array on a CNC Drilling machine. The experiments are performed on aluminium alloy 7075 using HSS twist drills. Analysis of variance (ANOVA) was employed to determine the most significant control factors affecting the surface roughness and maximum material removal rate.
Keywords- Material Removal Rate, Surface Roughness, Taguchi Method
_____________________________________________________________________________________________________
I. INTRODUCTION
A Material Removal Rate
Metal cutting is one of the important and commonly used manufacturing processes in any metal processing or business industries. By machining processes or manufacturing operations, attempts are made to make a product in several steps as of required dimensions and shapes to ensure the quality of machining products for the intended applications made for. The step-by-step machining is done on the material to reduce the machining costs thereby increasing the machining effectiveness. Every manufacturing.
Industry aims at producing many products within relatively lesser time. It has long been recognized that conditions during cutting, such as feed rate, cutting speed, drill diameter and depth of cut should be selected to optimize the economics of machining operations, as assessed by productivity, total manufacturing cost per component or some other suitable criterion. The optimization of cutting parameters during machining is a difficult task as it involves several aspects such as knowledge of machining, empirical equations of tool life, cutting forces, power consumed, machining surface finish etc. All these aspects should be considered during machining optimization to develop an effective optimization criterion. Manufacturing industries have long depended on the skill and experience of shop-floor machine-tool operators for optimal selection of cutting conditions and cutting tools.
B Surface Roughness
Surface Roughness is a measure of the surface smoothness of a manufactured surface. It is the variation of the surface from a reference plane. Low variation from the reference line means low roughness and high variation from reference line means more roughness. Optimal settings of the cuttings parameters are most important for obtaining low surface roughness.
C Taguchi Method
The Taguchi methodology involves reducing the variation in a process through robust design of experiments. The overall objective of the method is to make high quality product at low cost to the manufacturer. The Taguchi methodology was developed by Dr. G. Taguchi. He developed a methodology for designing experiments to investigate how different parameters influence the mean and variance of a process performance characteristic that defines how well the process is functioning.
The experimental design planned by Taguchi involves using orthogonal arrays to organize the parameters affecting the process parameters and the levels at which they should be varied. Instead of having to test all possible combinations like the factorial design, the Taguchi methodology tests pairs of combinations.
IJEDR1802047
International Journal of Engineering Development and Research (
www.ijedr.org
)
269
II. DESCRIPTION OF THE PROBLEM
In the present scenario of manufacturing industries particularly in all of the machining processes, the application of various optimization techniques is playing vital role which seeks identification of the best process parametric condition for that particular manufacturing or metal removal process.
Manufacturing process involves a number of process parameters (controllable and uncontrollable). Since selection of wrong cutting parameter in any machining process may lead to several negative effects. For example, high maintenance cost of the lathe machine, poor surface finish of the work piece, short tool life, low production rate, material wastage and increased production cost.
Taguchi Method and Anova has been applied for optimizing of machining parameters during Drilling operation of Aluminium Alloy 7075 using CNC machines. Find the optimum parameters values for drilling operations for maximizing the material removal rate and minimizing surface roughness. The machining parameters that been consider in this paper are spindle speed, feed rate and drill diameter. The minitab software is used for design of experiments and optimization.
III. RESULTS & CONCLUSION
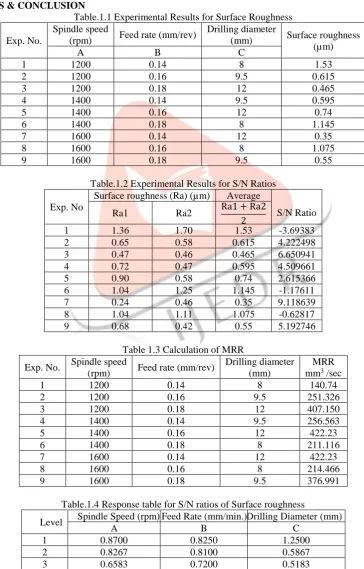
Table.1.1 Experimental Results for Surface Roughness Exp. No.
Spindle speed
(rpm) Feed rate (mm/rev)
Drilling diameter
(mm) Surface roughness (µm)
A B C
1 1200 0.14 8 1.53
2 1200 0.16 9.5 0.615
3 1200 0.18 12 0.465
4 1400 0.14 9.5 0.595
5 1400 0.16 12 0.74
6 1400 0.18 8 1.145
7 1600 0.14 12 0.35
8 1600 0.16 8 1.075
9 1600 0.18 9.5 0.55
Table.1.2 Experimental Results for S/N Ratios Exp. No
Surface roughness (Ra) (µm) Average
S/N Ratio
Ra1 Ra2 Ra1 + Ra2
2
1 1.36 1.70 1.53 -3.69383
2 0.65 0.58 0.615 4.222498
3 0.47 0.46 0.465 6.650941
4 0.72 0.47 0.595 4.509661
5 0.90 0.58 0.74 2.615366
6 1.04 1.25 1.145 -1.17611
7 0.24 0.46 0.35 9.118639
8 1.04 1.11 1.075 -0.62817
9 0.68 0.42 0.55 5.192746
Table 1.3 Calculation of MRR Exp. No. Spindle speed
(rpm) Feed rate (mm/rev)
Drilling diameter (mm)
MRR mm3 /sec
1 1200 0.14 8 140.74
2 1200 0.16 9.5 251.326
3 1200 0.18 12 407.150
4 1400 0.14 9.5 256.563
5 1400 0.16 12 422.23
6 1400 0.18 8 211.116
7 1600 0.14 12 422.23
8 1600 0.16 8 214.466
9 1600 0.18 9.5 376.991
Table.1.4 Response table for S/N ratios of Surface roughness
Level Spindle Speed (rpm) Feed Rate (mm/min.) Drilling Diameter (mm)
A B C
1 0.8700 0.8250 1.2500
2 0.8267 0.8100 0.5867
IJEDR1802047
International Journal of Engineering Development and Research (
www.ijedr.org
)
270
Delta 0.2117 0.105 7.52829
Rank 2 3 1
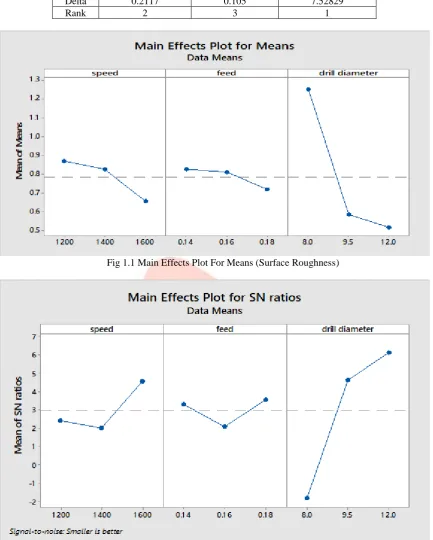
Fig 1.1 Main Effects Plot For Means (Surface Roughness)
Fig.1.2 Main Effects Plot For S/N Ratios (Surface Roughness)
IJEDR1802047
International Journal of Engineering Development and Research (
www.ijedr.org
)
271
Fig.1.3 Anova in Minitab softwareThe results obtained from ANOVA for surface roughness of drilled holes are given in Table 1.5. Table.1.5 Anova Results For S/N Ratios (Surface Roughness) Source DOF ADJ SS ADJ MS F Value P value P % Spindle speed (A)
1 0.06720 0.25579 3.08 0.129 5.6823 Feed rate (B) 1 0.01654 0.06720 0.81 0.410 1.3986 Drilling Diameter (C) 1 0.68361 0.01654 0.20 0.674 57.8056
Error 5 0.41524 0.68361 8.23 0.035 35.11
Total 8 1.18260 0.08305 100
SS, sum of squares; DOF, Degree of freedom; P, Percentage contribution;
† Significance at 95% confidence level.
As can be seen in the Table 1.5, F value for parameters Drilling Diameter, Spindle speed and is more than the limiting value, but for Feed rate F value is less than limiting value. So, it is clear that Drilling diameter and Spindle speed are more significant factors at 95% confidence level but the Feed rate is found to be insignificant factor and has no effect on surface roughness. This means that these two factors Drilling diameter and Spindle speed must be considered when an optimizing study will be planned for the given range of the parameters that were used.
It is clear from Table 1.5, that Drilling diameter has a maximum percentage contribution to the surface roughness with 57.8056%, followed by Spindle speed with 5.6823%.
Regression Results
Regression technique is also a optimization technique in which a equation obtained to correlates the parameters which are taken in the experiment. The regression equations are as follows
Regression equation for Aluminium alloy
IJEDR1802047
International Journal of Engineering Development and Research (
www.ijedr.org
)
272
Fig.1.4 Regression in Minitab softwareTaguchi method has been successfully implemented in determining optimum conditions for surface roughness of drilled hole.
An optimum parameter combination for the minimum Surface roughness (Ra), machining time, maximum material removal rate was obtained at the level of (A3, B1, C3) i.e. Spindle speed 1600 (rpm), Feed rate 224(mm/min.) and Drilling Diameter 9.5 (mm). Based on S/N ratio and ANOVA the Drilling Diameter was obtained as the most significant factor for Ra followed by Spindle speed. But the Feed rate has no significant influence on the Ra. For surface roughness, Drilling Diameter and Spindle speed were significant, with a percentage contribution of 57.8056 % and 5.6823 respectively, and the obtained optimum value for minimum Ra was 0.35 µm.
The material removal rate is maximum (422.23mm3/sec), hole surface roughness(0.35 µm) at seventh experiment i.e drill diameter 12 mm, spindle speed 1600 rpm, and feed rate 224 mm3/min.
References
[1] K Garg, J Singh, Bharat Bhushan. “The Process Parameters of Drilling Process A Review”, International Journal of Emerging Research in Management & Technology Volume 6, Issue 3 page 36-40.
[2] A S Sumesh, M E Shibu (2017). “Optimization of Drilling Parameters For Minimum Surface Roughness Using Taguchi Method”, IOSR Journal of Mechanical and Civil Engineering (IOSR-JMCE), ISSN: 2278-1684, Page 12-20.
[3] D E Patil, A.R. Balwan , V.A.Kamble (2016), “Optimization of drilling process parameters for cycle time, hole accuracy and surface roughness using Taguchi method”, International Conference on Recent Innovations in Engineering and Management (ICRIEM), Page 586-595.
[4] A R Mundhekar, S R Jadhav (2015), “Optimization of Drilling Process Parameters A Review”, International Journal for Research in Applied Science and Engineering Technology (IJRASET), volume 3, issue 2, Page 341-344. [5] A N Siddiqueea, Z A. Khana , P Goelb , B Mukesh Kumar , B Gaurav Agarwal , N ZKhan (2014) “Optimization of
Deep Drilling Process Parameters of AISI 321 Steel using Taguchi Method”. 3rd International Conference on Materials Processing and Characterisation (ICMPC), Procedia Materials Science 6, Page 1217 – 1225.
[6] S.V. Alagarsamy, S. Arockia Vincent Sagayaraj, P Raveendran (2016), “Optimization of Drilling Process Parameters on Surface Roughness & Material Removal Rate by Using Taguchi Method International Journal of Engineering Research and General Science Volume 4, Issue 2, Page 290-298.
[7] V Vignesh, R Sasikumar, R Raj Kumar, Darathi Manisha, M Nageshwaran, (2017), “Optimization of Drilling Parameters for Minimum Surface Roughness Using Taguchi Method in 7075 Alloy Imperial Journal of Interdisciplinary Research (IJIR) Vol-3, Issue-4, Page 1338-1342.
[8] T Nisha, R S Jadoun (2015),”Parametric Optimization of Drilling Machining Process for Surface Roughness on Aluminium Alloy 6082 Using Taguchi Method SSRG International Journal of Mechanical Engineering (SSRG-IJME) Volume 2, Issue 7,Page 49-55.
[9] M Sundeep, M Sudhahar, T T M Kannan, P Vijaya Kumar, N Parthipan (2014) “Optimization of Drilling Parameters on Austenitic Stainless Steel (AISI 316) Using Taguchi's Methodology”, International Journal of Mechanical Engineering and robotics research Volume 3, No. 4, page 388-394.