Sudden
Infant
Death
Syndrome
in Relation
to Weather
and
Optimetrically
Measured
Air
Pollution
in Taiwan
Harald
H. Kn#{246}bel,MD*;
Chien-Jen
Chen,
ScD*;
and
Kung-Yee
Liang,
PhD
ABSTRACT.
Objective.
To
examine
the
possible
role
of
weather
and
air
pollution
in
sudden
infantdeath
syndrome
(SIDS)
and
suffocation.
Methods.
Poisson
regression
analysis
was
carried
out
to measure
the
association
between
daily
rates
of SIDS
per
1000
live
births
anddaily
average
values
of visibility
and
temperature
in Taiwan
between
1981
and 1991.The
optimetrical
measure
of air
pollution
was
used
to
repre-sent
pollution
over
a whole
area
rather
than
at a point
source.
Results.
Mortalityfrom
SIDS
per
1000
live
births
was
3.3 times
greater
in the
lowest
category
of visibility
on
the
day
of death
than
in
the
highest
category;
this
rate
ratio
was
3.4 for the
average
visibility
during
the
9 days
before
death.
Adjustment
for
population
size,
season,
level
of urbanization,
incidence
of deaths
from
respira-tory
tract
infections,
temperature,
air pressure,
sunshine,
rainfall,
relative
humidity,
and
windspeed
increased
these
rate ratios
to 3.8
and5.1, respectively.
This
suggests
that
the
relationship
between
airpollution
and
511)5 isnot
biased
by
ecological
confounders.
For
temperature
the
rate
ratios
were
between
3.3
and4.0.
Conclusions.
Our
findings
confirm
the
association
of
climatic
temperature
and
air
pollution
with
511)5.
Pediatrics
199596:1106-1110;air pollution,
climatic
tern-perature, SIDS, suffocation.ABBREVIATIONS. SIDS, sudden infant death syndrome; PMIcC,
weight of particles of diameter less than 10 pm/m3; PSI, pollutants standard index.
Previous
studies
on
sudden
infant
death
syn-drorne
(SIDS)
have
persistently
shown
associations
with
environmental
climatic
factors,3
specifically
temperature.
Air
pollution
is
considered
to
elevate
the
general
mortality,47
while
studies
on
the
rela-tionship
between
environmental
pollution
and
511)5
have
varied
in their
methods
and
findings,
as well
as
in
their
conclusions.8#{176}
Taiwan
has
experienced
a
consistent
reduction
of infant
mortality
in recent
de-cades,
whereas
511)5
and
suffocation
have
been
ris-ing durris-ing
the same
time
period.”
This
has
coincided
with
an equally
consistent
rise
in air pollution.’2
The
regional
distribution
of 511)5
has
shown
low
rates
in
From the *Imtitute of Biomedical Sciences, Academia Sinica, Taipei, Taiwan, Republic of China; the Institute of Epidemiology, School of Public Health, National Taiwan University, Taipei, Taiwan, Republic of China, and the §Departinent of Biostatistics, School of Hygiene and Public Health, Johns Hopkins University, Baltimore, MD.
Received for publication May 16, 1994; accepted Nov 22, 1994.
Address correspondence to: Harald H. Kn#{246}bel,MD, ISSP Academia Sinica,
Taipei 11529, Taiwan, Republic of China.
PEDIATRiCS (ISSN 0031 4005). Copyright © 1995 by the American Acad-emy of Pediatrics.
the
undeveloped
unpolluted
regions,
while
general
infant
mortality
has
been
high
in those
regions
and
low
in
the
highly
urbanized
areas.11
We
therefore
decided
to investigate
the
relationship
between
SIDS
and
air pollution
in Taiwan.
Together
SIDS
and
suffocation
account
now
for
20%
of
the
total
infant
mortality
in
Taiwan,
repre-senting
a
yearly
rate
of close
to I
per
1000
live
births,
a figure
similar
to infant
mortality
from
5105
alone
in
western
countries.1’15
511)5
as a distinct
diagnosis
has
recently
been
introduced
because
suffocation
seemed
an
inappropriate
diagnosis
for
the
majority
of sudden
unexplained
infant
deaths.
Suffocation
as
cause
of
death
is
now
rarely
recorded
in
western
countries.16”7
The
situation
in Asia
is essentially
dif-ferent.
Taiwan
and
Japan
both
record
suffocation
rates
that
are
higher
than
SIDS
rates,
and
together
these
two
causes
of death
sum
up to values
similar
to
those
for
511)5
in
western
countries.’1’17
We
include
accidental
suffocation
diagnoses
in 511)5,
taking
the
view
that
from
a western
perspective
both
terms
would
be
synonymous.
In the
absence
of gravimetrically
measured
data
on
individual
pollutants
for
the
whole
island
of Taiwan
for
several
years
we
chose
visibility
as measured
at
all
the
meteorological
stations
throughout
the
island
as the
best
available
variable
to indicate
the
degree
of
air
pollution.
Visibifity
in our
study
is measured
as
visual
range,
which
makes
the
measurements
repre-sentative
for
areas,
whereas
aerosol
extinction
coef-ficients
from
photometers
are
point
measurements
like
the
gravimetrical
measures.
Recently
the
close
relationship
between
visual
range,
aerosol
extinction
coefficients,
and
total
suspended
particulates
(TSP)
has
been
reconfirmed.4’18
Emissions
from
metropoli-tan
areas
are
known
to
cause
the
production
of
visibffity-reducing
aerosols
from
160
to
240
km
downwind,long
after
the
primary
precursors
have
been
diluted
to
low
concentrations.19
The
aerosols
that
have
the
most
effect
on reducing
visibility
are
in
the
diameter
range
from
0.2
to
2 tim,
those
inhaled
most
deeply
into
the
lungs.192#{176} Aerosols,
like
NH4HSO4
and
(NH4)2SO4
are
usually
not
measured
in
air
samplers,
but
are
important
pollutants
that
constitute
up
to
50%
of
submicrorneter
particles.2’
These
aerosols
induce
light
scattering,21’
and
thus
are
integratively
measuredwith
visibifity.
As
visibifity
and
also
511)5
mortality
may
be influenced
in
partby
ecological
confounders
such
as
temperature,
air
pres-sure,
sunshineduration,
rainfall,
relative
humidity,
and
windspeed,
those
values
were
induded
in our
analysis.
at Viet Nam:AAP Sponsored on September 1, 2020
www.aappublications.org/news
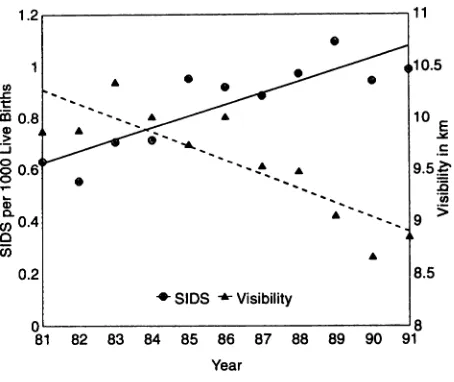
Year
ARTICLES
1107
METHODS
Data from death certificates for all deaths of infants in Taiwan
above I week and below I year of age were made available to us
for the years 1981 to 1991 by the Taiwan Center for Vital Statistics. The underlying causes of death
are
assigned
according to the ninth revision of the International Classification of Diseases?’ Westudied deaths coded as SIDS (ICD9 798.0, in one year also coded
as 799.0), which accounted for 38% of the cases, and those coded as suffocation (E911, E912, and E913); 62% of the cases were subsumed under SIDS. As a potential confounder respiratory tract
infections (ICD9 460 to 466 and 480 to 487) were used in the
regression analysis, because they are believed to be a causal factor in SIDS.124
A forensic doctor examined 42% of SIDS cases, a coroner 15%, and the remaining death certificates were issued by a physician. A
forensic investigation by a forensic doctor or coroner indudes an examination of the body, inspection of the place of death, and an
interview with the family. These investigations are perfonned in addition to the primary examination by a physician. An autopsy is
performed only if an infanticide cannot be excluded, in about 3%
of the cases.n fr 0.5% of SIDS cases the status of the issuer of the
death
certificate was unknown, or the issuer was not a physician; therefore these cases were excluded from the analysis.Data on weather were recorded by the Central Weather Bureau of the Ministry of Transport and Communications. Nine stations
located in the center of each of the nine main regions on the island were chosen to represent each region (in the dties of Taipei,
Hsinchu, Taichung, Chiayi, Tainan, Kaohsiung, Taitung, Hualien,
and ilan). On average an area of 2200 square km was covered by each weather station. The island groups of Penghu, Kinmen, Matsu, Lanyu, and Lutao as well as the central mountainous areas were exduded from the analysis because either the population was too small for the time series analysis to be performed or
because no weather station representative for the area was
avail-able. Daily mean values for all days in the years 1981 to 1991 of visibility, temperature, air pressure, rainfall, sunshine hours, rel-ative humidity, and windspeed were used. Visibility is defined as the furthest distance from which an object (or, at nighttime, a
diffuse light source) can be recognized with the unaided eye.
Sixteen measurements were made at intervals of 22.5#{176},in a circle
around the observing position. The visibility observed from
mea-surements over at least 202.5#{176}sectors was used. Therefore at
conditions of low visibility of 4.1 km (5% quantile of visibility
during the study period) the measurement is representative of an area of 30 j2; at mean visibifity of 11.6 km it represents 238 km2; at high visibility of 22.3 km (95% quantile) it represents 880 km2.
The measurements were repeated every 3 hours and followed a
precise standardized protocol.26
Daily gravimetrica! measures of air pollution [weight of parti-des of diameter <10 pm/m’ (PM1O), pollutants standard index
(PSI),
sulphur dioxide, and carbon monoxide] were madeavail-able from the Environmental Protection Agency for 1990 and 1991 for seven regions (Taipei, Hsinchu, Taichung, Chiayi, Tainan, Kaohsiung, and Hualien). Gravimetrical measures, optimetrica! measures, and weather variables were correlated using Pearson and Spearman correlation coefficients to assess inferences. In
Taipei and Kaohsiung areas the mean daily values of the five
available stations were used for the correlation analysis, the other
regions had only one station. To make weather and pollution correlations comparable, only the 2 years for which data were also
available for gravimetrically measured pollutants were used.
Each region throughout the study period was then divided
according to the daily values of visibility and temperature. To link several regions for a combined analysis we divided the number of deaths occurring on each day in each category by the daily num-ber of live births, which was computed by dividing the monthly
number of live births by the number of days in each month. To
control for seasonality ofbirths, the number of live births 3 months before death (3 months being the peak age of SIDS and
suffoca-tion) was taken as denominator. For the computation of crude rates within each category, the total number of deaths was divided by the total number of live births.
As there is no consensus about the time between disease onset
and death from SIDS, we analyzed our data under two different assumptions. First, a time lag of no more than several hours was assumed. Second, we allowed for a time lag of several days
between the hypothetical disease onset and death.2 Under this
second hypothesis the visibility and weather values on the 9 days before death are considered to be related to the incidence of SIDS. Poisson regression analysis was performed to control for po-tential confounders. For this analysis the natural
logarithm
of the daily rate of SIDS per 1000 live births was explained by visibifityand temperature. The daily number of live births was included to control for the different population sizes of the regions and
sea-sonality of births; the month of death to control for seasonality of
deaths; the proportion of births in each level of urbanization (the
levels were cities, towns, and rural townships) to control for the different development state and the different social composition of the regions; the daily rate of respiratory tract infections to control for their possible influence on SIDS, temperature, air pressure,
sunshine
hours,
rainfall,
relative humidity, and windspeed to control for their potential influence on visibility. All statistical analysis was performed with the Statistical Analysis System (SASInstitute, Cary, NC).
RESULTS
Rates
of SIDS
consistently
rose
throughout
the
11
years
of the
study
period
(Fig
1),
in contrast
to
gen-eral
infant
mortality
which
decreased
from
8.9
per
1000
live
births
in 1981
to 4.8
per
1000
live
births
in
1991.11
Among
the
weather
variables
investigated,
only
visibility
had
a clear
secular
trend
with
consis-tently
decreasing
values,
mirroringthe
trend
of 511)5
(Fig
1).
The
seasonal
pattern
of
511)5
showed
the
highest
rate
in
January,
the
coldest
month,
with
an
additional
peak
in March
(Fig
2). Weather
variables
varied
widely
with
the
season.
Similar
to
tempera-ture
variations
were
the
seasonal
variations
of
sun-shine
duration
and
most
notably,
air
pressure
(data
not
shown).
Visibility
was
lowest
and
inversely
cor-related
with
the
high
rate
of SIDS
in March
(Fig
2).
Rainfall
was
highest
during
the
summer.
Average
windspeed
showed
little
seasonal
variation.
In
a
combined
regression
analysis
only
visibility
and
temperature
were
consistently
significantly
related
to SIDS
rates.
The
influence
of weather
variables
on
visibifity
as well
as the
relationship
of gravimetrical
air pollution
measures
to visibifity
was
assessed
via
correlation
coefficients
for
the
years
1990
and
1991
(Table
1). Data
were
available
for seven
regions,
for a
total
of
5028
observations.
Temperature
and
sun-shine
hours
were
significantly
correlated
to visibility,
with
correlation
coefficients
(Pearson/Spearman)
of
Fig 1.
Yearly trends of visibility and of mortality from SIDS inTaiwan 1981 to 1991.
at Viet Nam:AAP Sponsored on September 1, 2020
www.aappublications.org/news
(I)
.c
0 >
a
(I)CI)
E
11 .
10
Cl)
>.
0
0
Jan
Feb Mar Apr May Jun Jul Aug Sep Oct NovDec
Month
Fig
2. Monthly trends of visibility and mortality from SIDS in Taiwan 1981 to 1991.TABLE 1. Correlation of Optimetrically Measured Air Pollu-tion to Gravimetrically Measured Air Pollution and Weather in Taiwan
PM10 Pearson!
Spearman*
Visibility
Pearson/Spearman
PSI 0.97 0.97 -0.60 -0.62
PM10
1.00 1.00 -0.59 -0.61Sulfur
dioxide
0.51
0.53
-0.40
-0.41
Carbon monoxide 0.44 0.48 -0.46 -0.53
Visibthty -0.59 -0.61 1.00 1.00
Temperature -0.02 -0.03 O.38 0.39
Air/Pressure 0.06 0.05 -0.19 -0.22
Rainfall -0.16 -0.27 -0.08 -0.06
Relative humidity -0.13 -0.15. -0.17 -0.19
Sunshine hours 0.12 0.13 0.29 0.26
Windspeed -0.12 -0.07 -0.03 -0.07
Abbreviations: PM10, weight of particles of diameter <10 pm/m3;
PSI, pollutants
standard
index.Daily
average
values from seven regions for 1990 and 1991, in total5028 observations.
* Correlation index.
§P
< .0001.0.38/0.39
and
0.29/0.26,
respectively.
Visibility
was
highly
correlated
to PM10
(coefficients
0.59/0.61)
and
PSI
(0.60/0.62).
This
was
higher
than
the
correlation
of
PM10
to
sulphur
dioxide
and
carbon
monoxide.
The
correlation
of
visibility
to
sulphur
dioxide
was
only
slightly
less,
and
of visibility
to carbon
monox-ide
was
higher
than
the
correlation
of PM10
to those
two
single
pollutants
(Table
1).
Visibility
and
temperature
were
divided
into
cat-egories
and
tested
for
consistency
of
their
effect
throughout
the
whole
range
of
values.
The
ratio
of
the
crude
rate
of SIDS
per
1000live
births
from
the
highest
to the lowest
category
of visibility
(ie, the rate
ratio)
on
the
day
of
death
was
3.3,
and
3.4
for
the
average
of visibility
during
the
9 days
before
death
(Table
2). There
was
a consistent
trend
of increasing
SIDS
from
the
highest
to
the
lowest
visibility
cate-gory
(P
<.01,
based
on
test
for
trend).
In
the
regression
model
where
population
size,
season,
de-gree
of
urbanization,
the
incidence
of
respiratory
tract
infections,
and
the
other
weather
variables
were
controlled,
the
effect
of
visibility
was
even
stronger
TABLE 2. Postperinatal SIDS Rate by Daily Average Visibility (in han) on Day of Death and During the 9 Days Before Death
SIDS, Visibility on Day of Death
Visibility, No. of Crude Crude RR Adjusted RR
(lan) Births* Ratet (95% CI) (95% CI)
1-3 183 1.14 3.3 (2.0-5.2) 3.8(2.8-5.1)
4-9 2117 0.84 2.4 (1.5-3.8) 2.9(22-3.9)
10-15 1130 0.73 2.1 (1.3-3.3) 2.7(2.0-3.7) 16-21 326 0.53 1.5 (0.9-2.4) 2.0(1.5-2.7)
22-37
60
0.35 1.0 1.0SIDS, Visibility I to 9 Days Before Death
Visibility, (han) No. of Crude Crude RR Adjusted RR Births* Ratet (95%
CI)
(95% CI) 1-3 33 1.20 3.4 (1.5-7.9) 5.1 (3.2-8.1)4-9 2318 0.89 2.6 (1.2-5.5) 3.6 (2.4-5.5)
10-15 1215 0.65 1.9 (0.9-4.0) 3.2(2.1-4.9)
16-21
225 0.43 1.2(0.6-2.7) 1.7 (1.1-2.6)22-37 24 0.35 1.0 1.0
Abbreviations: SIDS, sudden infant
death
syndrome;
RR, rate
ratio; CI, confidence interval.
“in l000s.
t Deaths from SItS per 1000 live births.
Controlling for daily number of live births, month, daily average
temperature, air pressure, sunshine, rainfall, relative humidity, windspeed, daily
incidence
of
respiratory tract infections, andlevel of urbanization.
and
equally
consistent.
The
adjusted
rate
ratio
was
3.8
for
the
day
of
death
and
5.1
for
the
average
visibility
on
the
9 days
before
death
(Table
2).
The
rate
ratio
of 511)5
per
1000
live
births
from
the
high-est
to
the
lowest
temperature
for
the
day
of death
was
4.0
and
remained
at 3.3
after
adjustment
(Table
3).
For
the
temperature
on
the
9 days
before
death
the
crude
rate
ratio
was
4.0
and
the
adjusted
rate
ratio
was
3.5.
The
other
weather
variables,
air
pres-sure,
sunshine
duration,
rainfall,
relative
humidity,
and
windspeed
were
either
not
consistent
in
the
TABLE 3. Postperinatal SIDS Rate by Daily Average
Temper-ature in Degrees Celsius on Day of Death and During
the
9 Days Before DeathSIDS, Temperature on Day of Death
Temperature No. of Crude Crude RR Adjusted RR Births” Ratet (95% CI) (95% CI)
7-13 179 1.63 4.0 (3.3-4.8) 3.3(2.7-4.1)
14-18
827
1.21 3.0 (2.5-3.5) 2.4(2.1-2.9)19-23 938 0.88 2.1 (1.8-2.5) 1.8 (1.6-2.1) 24-28 1433 0.49 1.2 (1.0-1.4) 1.1 (1.0-1.3)
29-33 438 0.41 1.0 1.0
SIDS, Temperature I to 9 Days Before Death
Temperature No. of Crude Crude RR Adjusted RR
Births” Ratet (95% CI) (95% CI)
7-13 77 1.77 4.0 (3.1-5.1) 3.5(2.8-4.5)
14-18 958 1.33 3.0 (2.5-3.6) 2.4(2.0-2.8) 19-23 935 0.84 1.9 (1.6-2.2) 1.6(1.4-1.9)
24-28 1515 0.45 1.0 (0.8-1.2) 0.9(0.8-1.1)
29-33 329 0.45 1.0 1.0
Abbreviations: SIDS, sudden infant death syndrome; RR, rate ratio; CI, confidence interval.
“in l000s.
1Deaths from SIDS per 1000 live births.
§
Controlling for daily number of live births, month, daily averagevisibility, air pressure, sunshine, rainfall, relative humidity, daily incidence of respiratory tract infections. and level of urbanization.
at Viet Nam:AAP Sponsored on September 1, 2020
www.aappublications.org/news
ARTICLES 1109
direction
of their
effect
from
single
to multivariate
analysis
or became
nonsignificant
in the
multivariate
analysis
(data
not
shown).
Therefore
they
were
not
believed
to
have
an
independent
important
effect
and
were
used
only
for
adjustment
of visibility
and
temperature.
511)5 mortality
was
low
in conditions
of
clear
air
and
temperatures
above
24#{176}C,
and
high
in
conditions
of low
visibifity
and
low
temperature.
Air
pollution,
measured
optimetrically,
had
a
con-sistent
relationship
to SIDS
that
was
as strong
and
significant
as the relationship
between
SIDS
and
tem-perature.
Other
weather
variables,
including
air
pressure,
sunshine
duration,
rainfall,
relative
humid-ity,
and
windspeed
were
inconsistent
in
their
rela-tion
to 511)5
and
seemed
not
to be independent
from
each
other.
The
values
of
visibility
on
the
9 days
before
death
had
a slightly
better
predictive
power
for
5105
than
the
values
on
the
day
of death.
DISCUSSION
Temperature
has
been
independently
and
consis-tently
identified
as a risk
factor
for
SIDS
in different
parts
of the
world.3
Paradoxical
overheating
is the
most
frequently
suggested
mechanism,2”#{176}
but
low
temperature
may
also
increase
the
effect
of
sub-stances
like
pollutants
on
the
respiratory
system.
Also
there
is a higher
prevalence
of respiratory
in-fections
in
colder
seasons,
and
a multiplication
of
risk
when
overbedding
and
infection
are
combined.24
Concern
has
also
been
expressed
about
how
closely
climatic
temperature
and
room
temperature
corre-late.3’
As
heating
is
still
uncommon
in
Taiwanese
households,
inside
and
outside
temperatures
are
closer
than
in countries
where
heating
is the
norm.
Recently,
air
pollution
has
been
studied
primarily
on
the
basis
of
gravimetrically
measured
data
that
offer
detailed
information
on
single
pollutants.8’9
Such
data
may
vary
with
the
distance
of the
station
from
strong
individual
polluters,
and
may
under-
or
overestimate
the
real
exposure
of
people
in
a given
area.
Optimetrical
data
give
an
average
reading
that
is more
generalizable,
but
may
be
more
influenced
by
weather
and
climate
than
gravimetrical
readings.
To
adjust
for
that
influence
we
have
included
a
va-riety
of weather
data
into
our
analysis.
Taiwan
has
a
wide
range
from
heavy
to
very
low
pollution,’2
a
mild
climate
ranging
from
subtropical
to
tropical,
and
a low
prevalence
of certain
maternal
risk
factors
(eg,
smoking),
and
is thus
a suitable
place
to study
the
effects
of
air
pollution
on
511)5.
Studies
on
air
pollution
and
511)5
have
used
a
wide
variety
of
methodologies
with
conflicting
results.
Some
studies
that
failed
to show
a correlation
have
been
carried
out
in areas
with
a very
narrow
band
of air pollution
values.9”0
The
results
of
our
study
are
presented
as
population-based
rates
that
allow
easy
comparison
among
areas.
Our
findings
suggest
that
air pollution
is
linked
to
SIDS,
and
thus
reopen
the
discussion.
The
likelihood
that
SIDS
is not
a homogeneous
cause
of death,
but
may
consist
of
etiologically
different
subgroups
should
lead
to an
underestimation
of
ef-fect.
Variation
in the
different
social
composition
of
the
regions
was
controlled
by
including
level
of
ur-banization
in
the
regression
analysis.
Urbanization
level
reflects
the
differences
in
the
three
variables
that
are
usually
used
to measure
social
class-edu-cation,
income,
and
occupation.
Higher
level
of
ur-banization
is associated
with
a greater
proportion
of
the
population
that
has
achieved
higher
or secondary
education,
higher
income,
more
prestigious
occupa-tion,
lower
total
infant
mortality,
and
fewer
births
to
teenage
mothers.”2
This
is reflected
in the
regions
according
to
their
composition
of
cities,
towns,
and
rural
townships.
As
the
different
distribution
of
so-cial
riskfactors
for
511)5
in different
areas
is well
characterized
through
the
level
of
urbanization,
for
which
we
control
in our
analysis,
we
maintain
that
social
risk
factors
do
not
constitute
a potential
bias
in
this
study.
Infant
mortality
from
respiratory
infec-tions
and
total
infant
mortality
were
low
in the
de-veloped
regions
where
pollution
is high,
while
511)5
was
low
in
the
less
developed
regions
where
pollu-tion
is
low.”
Maternal
smoking
is
extremely
rare,
regardless
of
the
region.
Teenage
mothers
are
more
prevalent
in
underdeveloped
unpolluted
areas,’1’2
which
should
lead
also
to an underestimation
of the
effect.
Infants
are
usually
not
autopsied
in
Taiwan,
though
studies
comparing
clinical
and
pathological
diagnosis
have
shown
that
autopsy
findings
nor-mally
are
not
able
to differentiate
511)5
and
suffoca-tion,
and
usually
do
not
change
the
clinical
diag-nosis
of
SIDS.37
Furthermore,
any
misclassification
of
explained
causes
under
SIDS
should
be
either
non-differential
with
regard
to
the
exposure
or
occur
more
likely
as
overdiagnosis
of
511)5
in
the
under-developed
unpolluted
regions,
thus
introducing
a
bias
towards
the
null.
The
use
of visual
range
as a measure
of air
pollu-tion
gives
more
weight
to the
small
particles
that
are
inhaled
most
deeply
into
the
lungs.’9’#{176} Furthermore,
as visual
range
gives
an
average
reading
for
a whole
area,
there
is less
chance
that
exposure
will
be
mis-classified
than
there
is with
local
air
samples.
Visual
range
is a good
measure
of air pollution
in the
mild
Taiwan
climate,
although
in
cooler
climate
zones
modifications
might
be needed
to allow
for
the
nat-ural
occurrence
of fog.
The
association
of pollution
with
511)5
as
found
in this
study
is consistent
with
previously
proposed
pathways
involving
the
respi-ratory
system.
Both
assumptions
about
the
disease
onset,
ie,
several
hours
or
up
to
9 days,
show
a
consistently
strong
association
with
air
pollution.
The
influence
of the
psycho-emotional
dimension
on
health
has
been
taken
up
recently
in
medical
research.
The
newly
created
term
seasonal
affective
disorder
gives
a
first
glimpse
of
the
influence
of
weather
and
climate
on
human
life.
“Wet-cold
weather
patterns,”
which
have
been
mentioned
in a
study
on
SIDS,39could
influence
infants
at the
level
of
the
autonomic
nervous
system
and
thus
could
possibly
subtly
interfere
with
vital
functions
like
res-piration.
Such
influence
could
increase
the
suscepti-biity
of
infants
to
a malfunctioning
of
respiration
and
be
one
of the
stones
in the
risk-factor
mosaic
of
SIDS.
Research
into
the
physiology
of
infant
devel-opment
and
adaptation
to climatic
and
environmen-tal changes
needs
to be expanded
to clarify
the
at Viet Nam:AAP Sponsored on September 1, 2020
www.aappublications.org/news
sible
role
of climate
and
weather
in the
etiology
of
511)5.
REFERENCES
1. Bonser RSA, Knight BH, West RR. Sudden infant death syndrome in Cardiff, association with epidemic influenza and with
temperature-1955-1974. mt j Epidemio!. 1978;7:335-340
2. Campbell MJ. Sudden infant death syndrome and environmental
temperature: further evidence for a time-lagged relationship. Med I Aust. 1989;151:365-367
3. Beal 5, Porter C. Sudden infant death syndrome related to climate. Acta Paediatr Scand. 1991;80:278-287
4. Schwartz J. Particulate air pollution and daily mortality in Detroit.
Environ Res. 199156:204-213
5. Fairley D. The relationship of daily mortality to suspended particulates in Santa Clara county, 1980-1986. Environ Health Perspect. 199089: 159-168
6. Mazumdar 5, Schimmel Higgins ITF. Relation of daily mortality to air
pollution. An analysis of 14 London winters, 1958/59-1971/72. Arch Environ Health. 198237:213-220
7. Firket M. Fog along the Meuse valley. Trans Farad Soc. 193632:
1192-1197
8. Hoppenbrouwers T, Calub M, Arakawa K, Hodgman JE. Seasonal relationship of sudden infant death syndrome and environmental pd-lutants. Am
J
Epidemiol. 1981;113:623-6359. Greenberg MA, Nelson KE, Carnow BW. A study of the relationship
between sudden infant death syndrome and environmental factors. Am
I
Epidemic!. 1972;98:412-42210. Audliems A, Barnes A. Sudden infant deaths and dear weather in a
subtropical environment. Soc Sci Med. 1987;24:51-56
Ii. Kn#{246}belHH, Yang WS, Ho MS. Urban and regional differences in infant
mortality in Taiwan. Soc Sci Med. 199439:815-fl
12. Environmental Protection Agency Taiwan ROC. Report on Air Quality in
Taiwan. Taipei, Taiwan: EPA; 1989
13. Grether JK, Schulman J, Croen LA. Sudden infant death syndrome
among Asians in California. IPediatr. 1990;116:525-528
14. Ponsonby AL, Jones ME, Lumley J, Dwyer D, Gilbert N. Climatic
temperature and variation in the incidence of sudden infant death syndrome between the Australian states. Med IAust. 1992;156:246-251 15. Sivan Y, Shen G, Schonfeld T, Nitzan M, NutmanJ. Sudden infant death
syndrome in the Tel Aviv and Petah Tivka districts. Isr
J
Med Sci.1992;28:430-435
16. Osterreichisches Statistisches Zentralamt. Demographisches Jahrbuch Osterreichs. Wien: Osz; 1990
17. Sato Y, Kagehara B, Mukai T, Endo T. Diagnosis of asphyxia on the sudden infant death-prone sleeping position and vomit aspiration. Jpn
I
Legal Med. 1992;46:407-41218. Ozkaynak H, Schatz AD, Thurston GD. Relationships between aerosol extinction coefficients derived from airport visual range observations and alternative measures of airborn particulate mass.
J
Air Pollut Control Assoc. 198635:937-94219. White WH, Anderson JA, Blumenthal DL, et al. Formation and tram-port of secondary air pollutants: ozone and aerosols in the St. Louis
urban plume. Science. 1976;194:187-189
20. Charison RJ, Ahlquist NC, Selvidge H, Mac Ready PB. Monitoring of
atmospheric aerosol parameters with the integrating nephelometer. I Air Po!!ut Control Assoc. 1969;19:937-942
21. Charlson RJ, Vanderpol MI, Covert DS, Waggoner DS, Ahlquist NC.
Sulfuric add-aminonium sulfate aerosol: optical detection in the St.
Louis region. Science. 1974;184:156-158
22. Horvath H, Charlson RJ. The direct optical measurement of atmo-spheric air pollution. Am md Hyg Assoc
J.
196930:500-50923. World Health Organization. International Statistical Classification of Dis-eases, Injuries and Causes of Death. Geneva, Switzerland: World Health
Organization; 1975 Revision
24. Gilbert R, Rudd P, Berry PJ, et al. Combined effect of infection and
heavy wrapping on the risk of sudden unexpected infant death. Arch Dis Child. 199267:171-177
25. Yang WS, Kn#{246}bel HH, Kuo PY. Study of Social Factors ofSudden
Unex-pected Deaths in Taiwan. Taipei, Taiwan: ROC National Science Council; July 1993 (Report No. NSC8I-0301-H-001)
26. Central Weather Bureau. Manual of Ground and Climate Measurements.
Taipei, Taiwan: Central Weather Bureau; 1982
27. Thom CC, Oft WR. A proposed uniform air pollution index. Atmos Environ. 1976;10:261
28. Liang KY, Zeger SL. Longitudinal data analysis using generalized linear models. Biometrika. 1986;73:13-22
29. Azaz Y, fleming PJ, Levine M, McCabe R, Stewart A, Johnson P. The relationship between environmental temperature, metabolic rate, sleep state, and evaporative water loss in infants from birth to three months.
Pediatr Res. 199232:417-423
30. fleming P1, Azaz Y, Wigfield R. Development of thermoregulation in infancy: possible implications for SIDS. Clin Pathol. 1992; 45(suppl): 17-19
31. Wailoo NW, Petersen SA, Whittaker H, Goodenough P. The thermal
environment in which 3-4 months old infants sleep at home. Arch Dis Child. 1989;64:600-604
32. Ministry of the Interior ROC. Taiwan-Pu/den Demographic Fact Book.
Taipei, Taiwan: Ministry of the Interior; 1981-1991 (inclusive)
33. Department of Budget Accounting & Statistics, Taiwan PrOVincial Gov-ernment ROC. Reporton theSurveyofFamilylncome & Expenditure Taiwan
Province, ROC. Taipei, Taiwan; Taiwan PrOVincial Government ROC; 1993
34. Bureau of Budget Accounting and Statistics, Taipei Municipal
Govern-ment. The Statistical Abstract of Taipei Municipality. Taipei, Taiwan: Taiwan Municipal Government; 1981-1991 (inclusive)
35. Leadbeatter 5, Knight B. Sudden infant death and suffocation. Br Med
J.
1989;299:455
36. Bunai Y, Ohya I, Brinkmann B. Pathological approaches to SIDS L Special emphasis on the histopathologicaldifferences betweenSlDS and
asphyxia. Jpn ILegal Med. 1992;46:405-406
37. Haas JE, Taylor JE, Bergman AB, et al. Relationship between epidemi-ological risk factors and dinicopathological findings in the sudden
infant death syndrome. Pediatrics. 199391:106-112
38. Heleniak EP. Seasonal affective disorder: lower or raised resting mets-bolic rate? Med Hypotheses. 1993;40:367
39. Deacon EL, Williams AL The incidence of the sudden infant death syndrome in relation to climate.
mt
I Biometeorol. 198226207-218at Viet Nam:AAP Sponsored on September 1, 2020
www.aappublications.org/news
1995;96;1106
Pediatrics
Harald H. Knöbel, Chien-Jen Chen and Kung-Yee Liang
Air Pollution in Taiwan
Sudden Infant Death Syndrome in Relation to Weather and Optimetrically Measured
Services
Updated Information &
http://pediatrics.aappublications.org/content/96/6/1106
including high resolution figures, can be found at:
Permissions & Licensing
http://www.aappublications.org/site/misc/Permissions.xhtml
entirety can be found online at:
Information about reproducing this article in parts (figures, tables) or in its
Reprints
http://www.aappublications.org/site/misc/reprints.xhtml
Information about ordering reprints can be found online:
at Viet Nam:AAP Sponsored on September 1, 2020
www.aappublications.org/news
1995;96;1106
Pediatrics
Harald H. Knöbel, Chien-Jen Chen and Kung-Yee Liang
Air Pollution in Taiwan
Sudden Infant Death Syndrome in Relation to Weather and Optimetrically Measured
http://pediatrics.aappublications.org/content/96/6/1106
the World Wide Web at:
The online version of this article, along with updated information and services, is located on
American Academy of Pediatrics. All rights reserved. Print ISSN: 1073-0397.
American Academy of Pediatrics, 345 Park Avenue, Itasca, Illinois, 60143. Copyright © 1995 by the
been published continuously since 1948. Pediatrics is owned, published, and trademarked by the
Pediatrics is the official journal of the American Academy of Pediatrics. A monthly publication, it has
at Viet Nam:AAP Sponsored on September 1, 2020
www.aappublications.org/news