Forestry & Natural-Resource Sciences Last Correction: Oct. 23, 2018
COUNTY-SCALE MAPPING OF THE INVASION STAGE AND
INVASIVENESS OF MAJOR NONNATIVE INVASIVE PLANTS IN
THE UPPER MIDWEST FORESTLANDS, USA
Z. Fan
1,*, W.K. Moser
2, M.K. Crosby
3, W. Yu
4, Y. Zhang
5, M.H. Hansen
6,
S.X. Fan
71
School of Forestry and Wildlife Sciences, Auburn University, 602 Duncan Drive, Auburn, AL 36849 USA 2 USDA Forest Service, Rocky Mountain Research Station, Flagstaff, AZ 86001 USA
3
School of Agricultural Sciences and Forestry, Louisiana Tech University, Ruston, LA 71272 USA 4 Department of Forestry, Mississippi State University, Mississippi State, MS 39762 USA
5
School of Forestry and Wildlife Sciences, Auburn University, Auburn, AL 36849 USA 6
USDA Forest Service, Northern Research Station, St. Paul, MN 55180 USA
7Statistical Consulting Center, Department of Mathematics and Statistics, Auburn University, Auburn, AL 36849 USA *
Corresponding Author: Ph.: +1(334)844-1014; Fax: +1(334)844-1084
Abstract. The determination of invasion stages and the degree to which an invasive plant (non-native
invasive plant, NNIP) has become established and spread in an ecosystem (“invasiveness”) is essential for developing methods of mitigation and control. We mapped the invasion stages and quantified the invasiveness of four NNIPs of great concern, multiflora rose (Rosa multiflora Thunb), nonnative bush hon-eysuckles (including four species from theLonicera spp family), common buckthorn (Rhamnus cathartica
L.) and garlic mustard (Alliaria petiolata [M. Bieb.] Cavara & Grande) in the Upper Midwest forestlands. Specifically, we used the product of the estimated presence probability and mean cover rate of an NNIP from a group of Forest Inventory and Analysis (FIA) plots in a county to represent its severity or area occupied. We then calculated the empirical cumulative density function (ECDF) of the occupied area and used classification and regression tree (CART) to classify the ECDF into a number of disjoint segments to spatially represent invasion stages of an NNIP. The invasiveness of an NNIP in three major forest type groups was then investigated via regression analysis of the change in the estimated mean cover rate with the estimated presence probability across the mapped invasion stages (a proxy for invasion time). This study demonstrates the feasibility of using data from a single time period for determining invasion stages and invasiveness of NNIPs for the deployment of controlling or eradicating measures.
Keywords: empirical cumulative density function; CART; FIA; invasive plant.
1
Introduction
Mapping the invasion condition of nonnative invasive plants (NNIPs) in forested ecosystems has become a pressing concern in natural resource management. NNIPs can result in significant ecological and economic losses through competing with and displacing native species, changing the chemical properties of soil and the composition and structure of native ecosystems, alter-ing natural disturbance regimes, and degradalter-ing ecosys-tem services including timber production, carbon se-questration, biodiversity, and recreation (e.g.,
Macdon-ald 1994, Pimentel et al. 2005, Moser et al. 2009, Eviner et al. 2012, Anderson and Crosby 2018). The degradation of ecosystem functions and services is di-rectly related to the abundance and invasion stage as well as the “invasiveness” (degree to which an NNIP has become established and spread in an ecosystem) of NNIPs. There is extensive literature on the topic of invasion stages (Richardson et al. 2000) and inva-sion barriers (Williamson and Fitter 1996), largely re-flecting the authors’ orientation on plants or animals (Blackburn et al. 2011). Blackburn et al. (2011) pro-posed a more comprehensive model that integrates both
Copyright©2018 Publisher ofMathematical and Computational Forestry & Natural-Resource Sciences
stages and barriers in a quest to unify invasion biology. For the purposes of developing this elegant unified the-ory, such efforts are laudable. However, managers face situations with incomplete data and understanding of the site-specific dynamics of invasive plants. Occam’s razor suggests that a simpler paradigm better reflects not only the situation on the ground but also the tools available to managers. Finally, similar to an industrial logistics model, managers measure “inventory” of inva-sive species or stages at a point in time, and infer flows or barriers between the stages. In that vein, we chose the four-stage model of Theoharides and Dukes (2007) They classified the invasion process of NNIPs into four stages: introduction, colonization, establishment, and spread. As Blackburn et al. (2011) observed, the barri-ers to progression from one stage to the next are implied. In the introduction stage, NNIPs are transported from their native regions to a new region via long-distance movements such as global commerce and travel, and their impact on local ecosystems is minimal or hardly detected. In the colonization stage, NNIPs survive and achieve positive net growth rates at low densities. In the establishment stage, NNIPs develop self-sustaining and expanding populations. In both the colonization and es-tablishment stage, the impacts of NNIPs are confined to local ecosystems, so managers should take advantage of the relatively limited presence of NNIPs and promptly plan and conduct control measures. In the spread stage, NNIPs disperse within a region over long distances and the most efficient opportunity for controlling or eradi-cating NNIPs has already passed. Others have classified the invasion process into two stages (Davis 2009), three stages (Williamson and Fitter 1996 Radosevich 2007), or up to six stages (Henderson et al. 2006). All these classifications are primarily qualitative, providing a way to evaluate or characterize the impact of NNIPs on the bioecological processes of native ecosystems based on en-vironmental factors or the life-history or genetic traits of the species.
Radosevich (2007) classifies the invasion process into three invasion stages— introduction, colonization, and naturalization—based on the logistic growth (i.e., occu-pied areas) of NNIPs with invasion time. In the intro-duction stage, the occupied area slowly increases with time; in the colonization stage, the occupied area quickly increases with time; and in the naturalization stage, the occupied area slowly increases and gradually reaches a stable limit or carrying capacity. Management strategies are different for each invasion stage. The cost of mitiga-tion increases substantially as the populamitiga-tions of NNIPs become more established in the ecosystem (Hobbs and Humphries 1995). When the abundance of NNIPs is very low, the corresponding management strategies pri-oritize quarantine or eradication. When the abundance
of NNIPs rapidly increases during the colonization stage, the management strategy, given limited resources, is to focus on limiting their spread (Webster et al. 2006). To prevent the spread of NNIPs, it is critical that man-agers detect them as early as possible and strategic in-ventories can help here (Moser et al. 2016). Finally, when the abundance of NNIPs is very high, in the nat-uralization stage, it is often extraordinarily expensive to remove NNIPs from an invaded area, particularly in forested ecosystems (Hobbs and Humphries 1995). Early detection of NNIPs is therefore an important step in cost-effective control of these species. Mapping the in-vasion stage (process) and quantifying the invasiveness of an NNIP in infested native ecosystems based on its occurrence, abundance, and spatial distribution will be of great value to the control and mitigation of NNIPs (Moser et al. 2016).
In order to quantify levels (or stages) of biological in-vasion, Catford et al. (2012) proposed and compared twelve potential indicators including presence/absence, abundance, cover and richness (absolute and relative) of NNIPs. They argued that an index of invasion level (stage) should not only facilitate the assessment of the extent or severity of NNIPs, reveal spatial and tempo-ral trends and act as an early warning sign of ecologi-cal degradation, but also can be used to guide manage-ment efforts. Among the potential indices, Pearson at al. (2016) and Guo et al. (2015) used relative abundance (presence) and relative richness (cover rate) to quantify “apparent” impact of NNIPs and invisibility and degree of invasion for recipient communities and ecosystems. To date, we have not noted specific research or methodology that integrate these indices and spatial data of NNIPs for mapping invasion stages (delineating the boundary and/or spatial extent/range of invasion severity/level) and quantifying invasiveness of NNIPs at the regional scale.
patchwork landscape and altered wildfire regime created conditions that NNIPs could exploit (Moser et al. 2009), often at the expense of understory development of native tree species.
The inventory data collected in 2005 and 2006 by the U.S. Department of Agriculture, Forest Service’s Forest Inventory and Analysis (FIA) program recorded 25 com-monly found invasive shrubs, vines, herbs, and grasses that may have adverse impacts on the forests in the Mid-west (Fan et al. 2013). The primary factors known to affect the invasiveness of NNIPs are disturbances sig-nified by county-level forest cover percent, distance to road, biodiversity, site quality, slope, and stocking level. As a continuation of our previous study in which the spatial distributional patterns of NNIPs were mapped using kernel smoothing (Fan et al. 2013), the objectives of this study are to 1) develop a methodology to map the invasion stage of four most dominant NNIPs, mul-tiflora rose (Rosa multiflora Thunb), nonnative bush honeysuckles (including four species from the Lonicera spp family), common buckthorn (Rhamnus cathartica
L.), and garlic mustard (Alliaria petiolata [M. Bieb.] Cavara & Grande) in the Upper Midwest counties based on the probability of presence and cover percentage data and 2) quantify the invasiveness of these four NNIPs in three major forest type groups (oak-hickory [ Quer-cusspp.-Caryaspp.], maple-beech-birch [northern hard-woods;Acer spp.-Fagus spp.-Betula spp.], and elm-ash-cottonwood [Ulmus spp.-Fraxinus spp.-Populus spp.]) in the Upper Midwest. The resultant maps of invasion stage and measures of invasiveness of selected NNIPs in major forest type groups will provide baseline informa-tion on current condiinforma-tion of NNIPs for management de-cision making about the control and mitigation of NNIPs in the Upper Midwest.
2
Materials and Methods
2.1 Study area
The Upper Midwest study area (Figure 1) consists of seven states: Illinois, Indiana, Iowa, Michigan, Min-nesota, Missouri, and Wisconsin. Situated where sev-eral ecoregions come together, this area is character-ized by diverse vegetation communities. The north-ern portions of the region are the most heavily forested areas (Minnesota - 29.3%, Wisconsin - 38.5%, Michi-gan - 31.2%, and Missouri - 32.8%, of total land area). The central portion of this area (Iowa, Illinois, and In-diana) is currently a patchwork of agricultural lands, urban areas, and some forest land; forests make up 8%, 12.2%, and 20.3%,of total land area in Iowa, Illi-nois, and Indiana, respectively [3,18]. A long history of human-caused disturbance and fertile soil provide favor-able conditions for the establishment of NNIPs. In this
study area, the primary forest-type groups infested by NNIPs are oak/hickory (37.7% of total forestland in the Midwest), maple/beech/birch (15.9% of forestland), and elm/ash/cottonwood (3.6 % of forestland) (Figure 1)
Figure 1.
Figure 1: Distribution of three forest-type groups that have been infested by NNIPs in the Upper Midwest.
2.2 Data
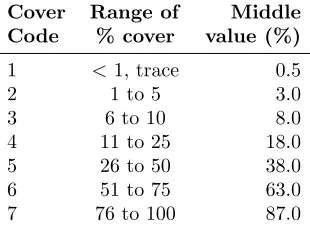
We used FIA data from the 2005 and 2006 inven-tory years. Phase 2 (tree inventory) data are col-lected on the standard FIA plot grid (1 plot per 2400 ha) (https://www.fia.fs.fed.us/library/database-documentation/index.php). Each Phase 2 plot consists of four subplots with a radius of 7.3 m (McRoberts 1999, Woudenberg et al. 2010). In the Upper Midwest states, sampling of 25 NNIPs including shrubs, grasses, herba-ceous species, and vines of interest was overlaid on these plots (Pearson et al. 2016). The presence and cover rate (%) were used to describe the presence and abundance of each NNIP in an FIA plot. For each NNIP, the value for presence is 1 if present or 0 if absent; the values for cover rate (%) are recorded as the middle value of the range of percent cover for each cover code (Table 1). In total, 8632 Phase 2 forested plots were assessed, and 594 counties out of 649 counties in the Upper Mid-west had FIA plots (Moser et al. 2009) Four of the most abundant NNIPs (groups) in terms of presence proba-bilities (pp) in different life forms (shrubs and herbs) included in this study are multiflora rose (Rosa multi-floraThunb,pp = 15.3%), nonnative bush honeysuck-les (including four species from theLonicera sppfamily, pp = 9.2%), common buckthorn (Rhamnus cathartica
L., pp = 4.8%) and garlic mustard (Alliaria petiolata
Figure 2: Spatial distribution of infested FIA plots by four major nonnative invasive plants in the Upper Midwest forestlands in the 2005-2006 inventory.
Table 1: Cover codes and ranges of percent cover of non-native invasive plants (NNIPs) used in recording invasive species’ presence, FIA plots, 2005-2006.
Cover Range of Middle
Code % cover value (%)
1 <1, trace 0.5
2 1 to 5 3.0
3 6 to 10 8.0
4 11 to 25 18.0 5 26 to 50 38.0 6 51 to 75 63.0 7 76 to 100 87.0
2.3 The presence probability and mean cover rate (%) of NNIPs at county level
In the dataset used for this study there are, on average, 15 plots in each county. Fifty-nine counties have only
one FIA plot, whereas 65 counties have more than 30 FIA plots. In order to overcome this bias attributed to the sample size in calculating the presence probability and mean cover rate (%) of an NNIP for each county, we used the following formula (neighborhood smooth-ing) to define the presence probability for a county based on the positive spatial autocorrelation in NNIP data (Moser et al. 2016, Fan et al. 2013):
pi=
P
i∈ηisi
P
i∈ηini
(1)
NNIPs for a county using the same rule. The estimated presence probability and mean cover rate will be used to estimate the severity or occupied area of an NNIP in a county.
2.4 Classification of invasion stages through a proxy of the occupied area or invasion severity of NNIPs at county level
The presence probability (measuring abundance) and mean cover rate (measuring dominance) are two indica-tors of the invasion severity or occupied area of NNIPs in a county; values of these two variables are often posi-tively correlated and increase with the invasion time (or stage). In our analysis, we used the product of the es-timated presence probability and mean cover rate as a proxy to quantify the occupied area or invasion severity of NNIPs in a county, which considers both the abun-dance and the dominance of NNIPs in a group of FIA plots (Catford et al. 2012, Pearson et al. 2016). The empirical cumulative distribution function (ECDF) of the product shows the ranked (from low to high) dis-tribution of the invasion condition or severity of NNIPs among the Upper Midwest counties. The ECDF often takes a sigmoid or exponential or spherical curve and can be viewed as a composite “space-for-time” version of the hypothetical, temporal invasion process (stage) on a particular site or area (Theoharides and Dukes 2007). Each point on the ECDF curve will represent one county with low invasion severity counties appearing on the left and high invasion severity counties on the right in a se-quential order (from low cumulative probabilities to high cumulative probabilities).
In this study, classification and regression tree (CART) (Breiman et al. 1984) was used to segment the ECDF of the NNIP invasion proxy so that the 649 Up-per Midwest counties were classified into different groups (invasion stages) using the cumulative probability of a county as the response and the invasion proxy (the prod-uct of the estimated presence probability and mean cover rate of NNIPs) as the predictor. Thus, counties are more homogenous in the invasion condition (similar ECDF values) within an invasion stage but significantly differ-ent between and among invasion stages. The R pack-age rpart (R Development Core Team 2011) was used to construct the optimal regression tree model since it automatically performs cross-validation and calculates the cross-validation error rate, which estimates the ex-pected error rate for use of the regression tree with new data. The cross-validation error rate gives an assess-ment of the performance of the resulting regression tree, that is, the change in prediction error with changing tree size. Therefore, the optimal regression tree model that minimizes the relative cross-validation error rate can be
selected (Maindonald and Braun 2007) Taking multi-flora rose as an example, the optimal regression tree size (the number of terminal nodes) with the minimal rela-tive cross-validation error is four (Figure 3A). Figure 3B shows the optimal regression tree profile with four ter-minal nodes and figure 3C shows the corresponding four invasion stages (I, II, III, IV) displayed in the ECDF curve of the product of the estimated county-level pres-ence probability and mean cover rate of multiflora rose.
2.5 Quantifying the invasiveness of NNIPs in an ecosystem
FIA plots were first grouped by forest type group and classified invasion stage. To assess the invasiveness of an NNIP in a forest type group, we calculated its pres-ence probability and mean cover rate for each forest type group by classified invasion stages (time). The re-lationship between the mean cover rate (response vari-able, measuring the dominance or rate of the coloniza-tion and establishment of an NNIP) and the presence probability (independent variable, measuring the abun-dance or rate of spread of an NNIP) across different in-vasion stages was evaluated via regression analysis for each forest type group. The slope (increase of mean cover rate with presence probability) of the regression model was used to measure the invasiveness of an NNIP in a forest type group based on the assumption that the presence probabilities of NNIPs by invasion stage are an approximate measure of invasion time. A permuta-tion test was conducted to test the statistical difference of the slope (invasiveness) of an NNIP between differ-ent forest type groups This study includes three major hardwood forest type groups, which account for 88.2% of the total forestland in the Upper Midwest and are in-creasingly threatened by NNIPs based on the FIA data (Moser et al. 2009, Moser et al. 2016, Fan et al. 2013)
All statistical computation and analysis were con-ducted under the R statistical environment (R Devel-opment Core Team 2011). Therpart package in R was used to implement CART analysis (Therneau and Atkin-son 2012, John and John 2003). The stats, maps and
rpart.plot and ggplot2 packages were used to run lin-ear regression and to draw graphics and map invasion stages.
3
Results
Figure 3. Classification of invasion stages of multiflora rose: (A) The plot of X relative error (relative cross-validation error) vs. the regression tree size (the number of terminal nodes) showing an optimal tree size of four corresponding to the minimal relative error. (B) The optimal regression tree model with four terminal nodes labelled as 4,5,6,7 (invasion stages I, II, III and IV) showing the cut-off values of the product of the estimated county-level presence probability and mean cover rate (%)). The numbers (0.38, 0.41, 0.43, 0.46) in the terminal nodes are the mean probability. (C) The ECDF of the product and four cut-off values to map multiflora rose into four invasion stages (labelled as I, II, III and IV) based on the CART model.
A
B
C
Tree Size
Product
X relative error
ECDF
Figure 3: Classification of invasion stages of multiflora rose: (A) The plot of X relative error (relative cross-validation error) vs. the regression tree size (the num-ber of terminal nodes) showing an optimal tree size of four corresponding to the minimal relative error. (B) The optimal regression tree model with four terminal nodes labelled as 4,5,6,7 (invasion stages I, II, III and IV) showing the cut-off values of the product of the esti-mated county-level presence probability and mean cover rate (%)). The numbers (0.38, 0.41, 0.43, 0.46) in the terminal nodes are the mean probability. (C) The ECDF of the product and four cut-off values to map multiflora rose into four invasion stages (labelled as I, II, III and IV) based on the CART model.
central and northern counties, and garlic mustard in cen-tral counties, while nonnative bush honeysuckles spread across the entire Upper Midwest (Figure 2). Figure 3 showed the mapping process of invasion stages for mul-tiflora rose. Based on the relative cross-validation error change with regression tree size, the best regression tree with the minimum relative cross-validation error should
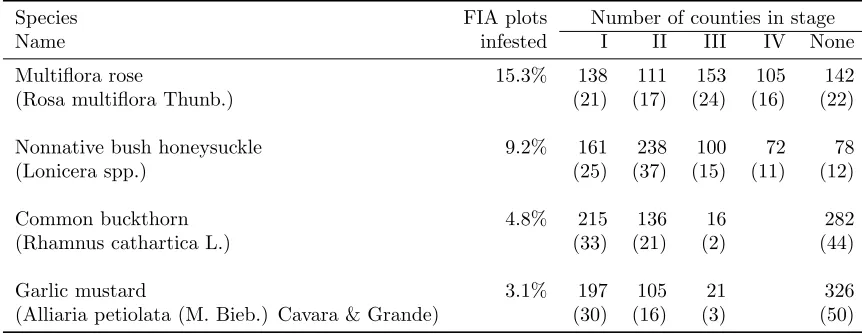
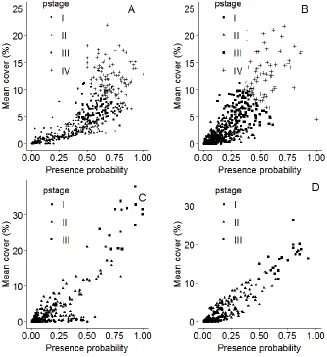
have four terminal nodes (Figure 3A) as indicated by the resultant pruned regression tree (Figure 3B). The ECDF of the product of the estimated presence probability and mean cover rate (%), a proxy of the county-level invasion severity or occupied area of multiflora rose was then seg-mented into four sections representing the four invasion stages by using the breaks (cut-off values) of the pruned regression tree (Figure 3C). Same process was applied with the other three NNIP species. A graphic represen-tation (Figure 4) displays the classified invasion stages on the plane of presence probability versus mean cover rate for all NNIPs. For multiflora rose, in invasion stages I and II, the estimated mean cover rate increases slowly and has relatively low variation with the presence prob-ability, but in invasion stages III and IV the estimated mean cover rate increases rapidly and has greater varia-tion. Except for 142 (22%) deep northern counties (Fig 5, shaded in white) where no multiflora rose was found in FIA plots, 138 (21%) and 111 (17%) counties (shaded in blue and green, respectively) belong to invasion stages I and II where multiflora rose has low cover class (<5%) and presence probability (<0.4). Multiflora rose was more prominent in the central counties and part of the southern counties, of which 153 (24%) and 105 (16%) counties belong to invasion stage III (shaded in brown) and IV (shaded in red) with moderate and higher cover classes (>5%) and presence probability (>0.4), respec-tively. For the other three NNIPs, all advanced invasion stages (III, IV) were spatially located in central counties. Nonnative bush honeysuckles spread over more (88%) counties than other species in four invasion stages with 36% of counties in advanced stages (III, IV). Common buckthorn spread over 56% counties in three stages with only 2% in advanced stage (III). Garlic mustard spread over 50% of counties in four stages with 3% of counties in advanced stages (III).
Regression analysis suggests that common buckthorn, garlic mustard, and nonnative bush honeysuckles were, overall, more invasive than multiflora rose in the Up-per Midwest forest lands as shown by their significantly greater slope coefficients (p<0.0009), but there were no significant differences among them (Figure 5). For each taxon that we studied, we did not find significant dif-ferences in regression slopes among the three forest-type groups at the significance level ofα = 0.05. This result suggests that the invasiveness of each genus or species is not statistically different by forest type group due to large standard errors (in parentheses in Figure 5.)
4
Discussion
4.1 4.1 Classification of invasion stages
Table 2: Proportion of FIA plots infested by NNIPs, number (proportion in parenthesis) of counties in different invasion stages based on the 2005-2006 survey data of nonnative invasive plants.
Species FIA plots Number of counties in stage
Name infested I II III IV None
Multiflora rose 15.3% 138 111 153 105 142 (Rosa multiflora Thunb.) (21) (17) (24) (16) (22)
Nonnative bush honeysuckle 9.2% 161 238 100 72 78
(Lonicera spp.) (25) (37) (15) (11) (12)
Common buckthorn 4.8% 215 136 16 282
(Rhamnus cathartica L.) (33) (21) (2) (44)
Garlic mustard 3.1% 197 105 21 326
(Alliaria petiolata (M. Bieb.) Cavara & Grande) (30) (16) (3) (50)
period. Invasion stages are not labeled categorically as is done in other studies (Radosevich 2007) but can be thought of in terms of severity where greater numbers represent a greater degree of invasion (Guo et al. 2015). The product of the estimated county-level presence probability and mean cover rate (%) of NNIPs in a group of FIA plots as a measure of “invaded area” or inva-sion severity can be generated for individual species or all NNIPs (Table 2), making the analysis applicable to any spatial scale (Moser et al. 2016). Moody and Mack (1988) show that the area invaded is a non-linear func-tion of time if there are multiple foci for invasion and the invaded area is a linear function of time if there is a single focus of the invasion. Here, if we treat the es-timated cover rate as a proxy for the infested area and the estimated presence probability by invasion stage as a proxy for the infested time, then the non-linear re-lationship between the two variables (Figure 4 A and B) for multiflora rose and nonnative bush honeysuckles is consistent with the dispersal characteristics of most NNIPs: a mixture of long-distance dispersal (e.g., birds) and short-distance dispersal (e.g., through runoff, mam-mals). Evidently, both species had multiple (>3) foci for regional dispersion and spread (Figure 6). In con-trast, the linear relationship between the estimated cover rate and presence probability for common buckthorn and garlic mustard (Figure 4 C and D) coincided with one focus for regional spread (Figure 6). Classification of invasion stage is an important component for the deter-mination of any impacts invasions may have on native plants in an area. Presence and cover rate have been utilized to determine the effect of invasive plants on na-tives Pearson et al. 2016). The use of the product of presence probability and mean cover rate, compared to either of both, allows for a more accurate estimation of invasion severity of an area occupied by an NNIP
(Yu 2011), which provides resource managers a method for prioritizing mitigation efforts based upon invasion stage. This would allow for both limiting foci for fur-ther invasion of NNIPs and minimize the local effects, or degree of invasion (Guo et al. 2015) on native species (Pearson et al. 2016).
The ECDF curve (Figure 3C) ranked the 649 Mid-west counties based on the product of county-level pres-ence probability and mean cover rate of an invasive plant species (the x-axis) and reported the cumulative proba-bilities (the y-axis) of a county corresponding to a value of this product. The counties that have low product val-ues and cumulative probabilities are lightly invaded and are located in the left section (labelled as invasion stage I), followed by moderately invaded counties (labelled as II and III), and highly invaded counties (labelled as IV). Since the ECDF curve describes the change of the prod-uct of presence probability (abundance) and mean cover rate (dominance) of an invasive species, its shape is pri-marily related to the number of foci for invasion/spread, rate of spread and growth rate in focal environment. We found the shape of the ECDF curve is related to the inva-siveness with less invasive species such as multiflora rose (having minimal slope, Figure 5) having a gentle slope of ECDF curve, while highly invasive species (large slope, Figure 5) have a steeply increased ECDF curves.
Figure 4. The relationship between the estimated county-level presence probability (pp)
and mean cover rate (%) of (A) multiflora rose, (B) nonnative bush honeysuckles, (C)
common buckthorn, and (D) garlic mustard by the invasion stage (pstage) classified by
the CART model in the Upper Midwest counties.
Figure 4: The relationship between the estimated county-level presence probability (pp) and mean cover rate (%) of (A) multiflora rose, (B) nonnative bush honeysuckles, (C) common buckthorn, and (D) garlic mustard by the invasion stage (pstage) classified by the CART model in the Upper Midwest counties.
that NNIPs were first introduced to the central ties and then gradually spread to surrounding coun-ties; the highest category of invasion stage serves as a source region for the spread of NNIPs (Moser et al. 2009, Moser et al. 2016, Fan et al. 2013). The county maps of invasion stage give resource managers a tool to locate target counties and evaluate the severity of NNIPs to al-locate resources for the control and mitigation of NNIPs. The use of single-measurement data provides objective criteria for determining areas of most-severe invasion by NNIPs and provides for the development of a more rapid response. The delineated invasion stage maps (Fig-ure 6) provide more accurate information than separate smoothed maps of either presence probability or cover rate of NNIPs in previous studies (Moser et al. 2016, Fan et al. 2013), and can serve as baseline informa-tion for the NNIP’s current condiinforma-tion and allow resource
managers to develop timely plans for investigation, con-trol, or eradication of threats posed by the plants. The data utilized in developing the invasion stage classifica-tions was from the 2005-2006 inventory cycle. Further analysis will incorporate the subsequent inventory data and use to further refine models based on any newly de-tected presence or spread of these NNIPs in the region.
Figure 6. Regression lines showing the increase of the mean cover rate (%) with presence
probability across classified invasion stages for four selected IPs. The numbers in the plot
are the estimated regression coefficients and standard errors (in parentheses) for slope, a
quantitative measure of the invasiveness of IPs for corresponding forest type groups.
Figure 5: Regression lines showing the increase of the mean cover rate (%) with presence probability across classified invasion stages for four selected NNIPs. The numbers in the plot are the estimated regression coefficients and standard errors (in parentheses) for slope, a quantitative measure of the invasiveness of NNIPs for corresponding forest type groups.
4.2 Invasiveness of NNIPs
Invasiveness is illustrated by plotting the regression lines for the three assessed forest types (Figure 5). Two of the invasive shrubs, nonnative bush honeysuckles and common buckthorn, had a higher level of invasiveness in elm-ash-cottonwood forests than in maple-beech-birch forests and oak-hickory forests, as indicated by the slope of the regression line (steepest for elm-ash-cottonwood forests), but the difference was not statistically signif-icant due to large variations in the data. Garlic mus-tard as an invasive herbaceous species had higher inva-siveness in oak-hickory forests and elm-ash-cottonwood forests than in maple-beech-birch forests, but this differ-ence was not statistically significant. Multiflora rose had nearly identical invasiveness levels in three forest-type groups (Figure 5). Generally, invasiveness decreases as
the forest types progress toward later successional or at least more shade-tolerant species, although as Mar-tin et al. (2008) point out, slow-invading shade-tolerant species can have dire negative consequences for late-successional forest systems. Following European settle-ment, anthropogenic influence has resulted in an increas-ingly fragmented landscape, leading to early- and mid-successional communities. In these communities, NNIPs can establish and spread, including communities of oak, birch, and aspen (Populus spp.) (Dieser and Ek 2016) While NNIPs may not readily invade mature, closed-canopy systems, disturbance may allow them to infil-trate an area where they outcompete native vegetation (Gilliam 2007).
Figure 6: The spatial representation of invasion stages of selected NNIPs in the Upper Midwest counties.
growing space available for NNIPs. This is problematic for shade-intolerant species (i.e. cottonwood) that oc-cupy growing space, particularly in open disturbed sites, into which NNIPs can establish (Van Haverbeke 1990). Late-successional forests, such as maple-beech-birch, forests, are generally comprised of shade-tolerant species (e.g., sugar maple [Acer saccharum Marsh] (Delcourt and Delcourt 2000); the niche space is occupied by these species and the greater leaf area reduces light availability and is not conducive to the establishment of NNIPs (Guo et al. 2015).
The balance of late-successional forests or the lack of NNIPs in early- and mid-successional forests can be in-fluenced greatly by disturbance (e.g., wind-throw, har-vest). Canopy reduction through wind-throw, etc. can disrupt species dominance (Oliver 1996) and create niche space for NNIPs, from which they can expand through-out the ecosystem (Frelich and Reich 1995). With new inventory data, the invasiveness of NNIPs and their im-pact on recipient ecosystems can be further evaluated using mapped invasion stages.
5
Conclusions
Procedures have been developed that can be used to clas-sify the invasion stages of invasive plants based on
esti-mated county-level presence probability and mean cover rate. This provides a method of classification without reliance on data collected over long intervals of time, allowing for a more timely deployment of monitoring and control measures for NNIPs. However, the coarse data of cover rate may influence the reliability and ac-curacy of the classification. We recommend that future research explore any potential impacts on the accuracy of maps that classify objective invasion stages. Only then might researchers and managers be able to evalu-ate the efficacy of a more detailed and comprehensive invasion stage and barrier model, such as that posited by Blackburn et al. (2011), in helping them achieve their resource management goals.
The results support the classification of the invasion process into various discrete stages. This practice is dif-ferent from previous studies in that these classification procedures, based on information on occupancy (pres-ence or abs(pres-ence) and abundance of NNIPs, do not re-quire knowledge about the life-history and genetic traits of invasive plants and about environmental factors.
The invasion stage for a variety of NNIPs as well as the invasiveness (susceptibility to invasion) of major forest types has been shown. The invasiveness of four primary NNIPs that effect Midwestern forests have been mapped. The prevalence of multiflora rose led to it being the dom-inant NNIP. However, the results of this analysis show common buckthorn, honeysuckle, and garlic mustard to all be more invasive in Midwestern forests. If fragmen-tation and disturbance continue with no feasible control, these species will continue to spread throughout the re-gion. Forested areas, particularly those with disturbed patches, should be monitored for the establishment of NNIPs. This is of greatest significance in those commu-nities with earlier successional species. Where NNIPs are detected, steps should immediately be taken to re-move them before they become established.
Acknowledgments
Dr. Mark D. Nelson, U.S. Forest Service, Northern Re-search Station, Forest Inventory and Analysis Program, provided valuable assistance with spatially joining FIA plots and other features. The authors gratefully ac-knowledge the input of anonymous reviewers on earlier versions of this manuscript for their valuable comments and suggestions.
Mississippi State University for their support of this study.
Availability of Data and Materials: All data used in this study came from the Forest Inventory and Anal-ysis National Program – United States Department of Agriculture, Forest Service (https://www.fia.fs.fed.us/), particularly the Northern Research Station FIA Pro-gram (https://www.nrs.fs.fed.us/fia/).
References
Anderson, M.P. & Crosby, M.K. 2018. An assessment of invasive plants on Shorter Universitys campus. Math. Comput. For. & Nat. Res. Sci. (MCFNS), 10(1): 24–29. Retrieved from: http://mcfns.net/index.php/-Journal/article/view/10.6/2018.
Andersen, O., Crow, T.R., Lietz, S.M., & Stearns, F. 1996. Transformation of a landscape in the upper mid-west, USA: the history of the lower St. Croix river valley, 1830 to present. Landsc. Urban Plan. 35: 247– 267.
Becker, R.H., Zmijewski, K.A., & Crail, T. 2012. Seeing the forest for the invasives: mapping buckthorn in oak openings. Biological Invasions 15(2): 315–326.
Blackburn, T.M., Pyˇsek, P., Bacher, S., Carlton, J.T., Duncan, R.P., Jaroˇs´ık, V., Wilson, J.R.U., & Richard-son, D.M. 2011. A proposed unified framework for bi-ological invasions. Trends Ecol. & Evol. 26: 333–339.
Breiman, L., Friedman, J.H., Olshen, R.A., & Stone, C.J. 1984. Classification and regression trees. Wadsworth: Belmont, California.
Catford, J.A., Vesk, P.A., Richardson, D.M., & Pysek, P. 2012. Quantifying levels of biological invasion: to-wards the objective classification of invaded and inva-sible ecosystems. Global Change Biology. 18: 44–62.
Davis, M.A. 2009. Invasion biology. Oxford University Press: Oxford, UK.
Delcourt, H.R., & Delcourt, P.A. 2000. Eastern decidu-ous forests. In: Barbour MG, Billings WD (eds) North American terrestrial vegetation, Cambridge Univer-sity Press: New York. pp. 357–395.
Dieser, P.J., & Ek, A.R. 2011. Cloquet Forestry enter continuous forest inventory for 2000: analysis and in-tegration with the historical database. Department of Forest Resources, University of Minnesota, St. Paul, MN. Staff Paper Series No. 214.
Eviner, V.T., Garbach, K., Baty, J.H., & Hoskinson, S.A. 2012. Measuring the effects of invasive plants on
ecosystem services: challenges and prospects. Invasive Plant Science and Management. 5: 125–136.
Fan, Z., Moser, W.K., Hansen, M.H., & Nelson, M.D. 2013. Regional patterns of major nonnative inva-sive plants and associated factors in upper Midwest forests. For. Sci. 59: 38–49.
Frelich, L.E., & Reich, P.B. 1995. Neighborhood effects, disturbance, and succession in forests of the Western Great Lakes region. Ecoscience. 2:148–158.
Gilliam, F.S. 2007. The ecological significance of the herbaceous layer in temperate forest ecosystems. Bio-Science. 57: 845–858.
Guo, Q., Fei, S., Duke, J.S., Oswalt, C.M., Iannone III, B.V., & Potter, K.M. 2015. A unified approach for quantifying invisibility and degree of invasion. Ecol-ogy. 96: 2613–2621.
Henderson, S., Dawson, T.P., & Whittaker, R.J. 2006. Progress in invasive plants research. Prog. Phys. Geog. 30: 25–46.
Hobbs, R. J., & Humphries, S.E. 1995. An integrated approach to the ecology and management of plant in-vasions. Conservation Biology. 9: 761–770.
John, M., & John, B. 2003. Data analysis and graph-ics using R: an example-based approach. Cambridge University Press, Cambridge, UK.
Macdonald, I.A.W. 1994. Global change and alien inva-sions: implications for biodiversity and protected area management, In: Solbrig OT, van Emden PG, van Oordt WJ (eds) Biodiversity and global change. CAB International, Wallingford-Oxon, UK. pp 197–207.
Maindonald, J., & Braun, J. 2007. Data analysis and graphics using R: an example-based approach, Cam-bridge University Press, CamCam-bridge, UK.
Martin, P.H., Canham, C.D., & Marks, P.L. 2008. Why forests appear resistant to exotic plant invasions: in-tentional introductions, stand dynamics, and the role of shade tolerance. Front. Ecol. Environ. 7(3):142–149.
McRoberts, R.E. 1999. Joint annual forest inventory and monitoring system: the North Central perspective. J. For. 97:27–31.
Moody, M.E., & Mack, R.N. 1988. Controlling the spread of plant invasions: the importance of nascent foci. J. Appl. Ecol. 25:1009–1021.
in the forests of the upper midwest of the United States. In: Kohli RK, Jose S, Singh HP, Batish DR (eds) Invasive plants and forest ecosystems. CRC Press, Boca Raton, FL, pp 29–58.
Moser, W.K., Fan, Z., Hansen, M.H., Crosby, M.K., & Fan, S.X. 2016. Invasibility of three major nonnative shrubs and associated factors in Upper Midwest U.S. forest lands. For. Ecol. Manag. 379:195–205.
Oliver, C.D., & Larson, B.C. 1996. Forest stand dynam-ics, update edn. Wiley, New York.
Pearson, D. E., Ortega, Y.K., Eren, Q., & Hierro, J.L. 2016. Quantifying “apparent” impact and distinguish-ing impact from invasiveness in multispecies plant in-vasions. Ecological Applications. 26: 162–173.
Pimentel, D., Zuniga, R., & Morrison, D. 2005. Update on the environmental and economic costs associated with alien-invasive species in the United States. Ecol. Econ. 52: 273–288.
R Development Core Team. 2011. R: A language and environment for statistical computing. R Foundation for Statistical Computing, Vienna, Austria: 2011, http://www.R-project.org/
Radosevich, S.R. 2007. Plant invasions and their management. Chapter 3 in: Center for Invasive Plant Management (ed.) Invasive plant manage-ment: CIPM online textbook. Center for Invasive Plant Management, Bozeman, MT. Available online: http://www.weedcenter.org/textbook/index.html Accessed 18 October 2008.
Richardson, D.M., Pyˇsek, P., Rejmanek, M., Barbour, M.G., Panetta, F.D., & West, C.J. 2000. Naturaliza-tion and invasion of alien plants: concepts and defini-tions. Diversity & Distrib. 6: 93–107.
Sander, I.L., & Clark, F.B. 1971. Reproduction of up-land hardwood forests in the central states. Agric
Handb 405. U.S. Department of Agriculture, Forest Service, Washington, DC.
Soucy, R.D., Heitzman, E., & Spetich, M.A. 2005. The establishment and development of oak forests in the Ozark Mountains of Arkansas. Can. J. For. Res. 35: 1790–1797.
Theoharides, K.A., & Dukes, J.S. 2007. Plant invasion across space and time: factors affecting nonindige-nous species success during four stages of invasion. New Phytol. 176: 256–273.
Therneau, T.M., & Atkinson, E.J. 2012. An intro-duction to recursive partitioning using the rpart routine. http://citeseerx.ist.psu.edu/viewdoc/down-load?doi=10.1.1.304.3759&rep=rep1&type=pdf Ac-cessed 14 May 2018.
Van Haverbeke, D.F. 1990. Populus deltoides var. oc-cidentalis Rybd. Plains cottonwood. In: Burns RM, Honkala BH (tech coords) Silvics of North America, Volume 2, Hardwoods. Agric Handb 654. US Depart-ment of Agriculture, Forest Service, Washington DC. pp 537–543.
Webster, C.R., Jenkins, M.A., & Jose, S. 2006. Woody invaders and the challenges they pose to forest ecosys-tems in the eastern United States. J. For. 104: 366– 374.
Williamson, M., & Fitter, A. 1996. The varying success of invaders. Ecology. 77: 1661–1666.
Woudenberg, S.W., Conkling, B.L., O’Connell, B.M., LaPoint, E.B., Turner, J.A., & Waddell, K.L. 2010. The Forest Inventory and Analysis database: Database description and users manual version 4.0 for Phase 2. Gen. Tech. Rep. RMRS-GTR-245. U.S. De-partment of Agriculture, Forest Service, Rocky Moun-tain Research Station, Fort Collins, CO.