Comparing learners’ ConstruCts
using “soCio-nets”: an appliCation
of repertory grid analysis
Thomas J.J. McCloughlin
st. patrick’s College, (a college of dublin City university), dublin, ireland e-mail: [email protected]
Philip S.C. Matthews
trinity College, university of dublin, dublin, ireland e-mail: [email protected]
Abstract
Repertory grid analysis was employed as a means of constructing representations of learners concep-tions of living things (described in previous work). Experts in biology and secondary school science learners were probed for their representations of living things. Clearly, a theory is at work in the mind of the experts. The question now is: how many of the students share this theory? A record of commonality is required, and for that a social network framework is necessary. Therefore, representations were com-pared using the SOCIO program which measures the similarity between individuals and a visual network produced for the groups studied. This work is part of an overall project examining the learners’ innate
ability to classify and categorize living things. Classification and categorization are neglected in science
curricula which has implications with respect to the renewed emphasis in education on learning about biodiversity. It was found that whereas there is a commonality with respect to learners’ conceptions, the
commonality is measurable and that learners often operate within a ‘pre-scientific’ or folk-biological
mode, experts operate within a highly formalized mode based on their training, and that notwithstanding such a difference in modes, there remains a degree of commonality between learners and experts.
Key words: repertory grid analysis, socionets.
Introduction
“Human life is social life” (müller, carpendale, budwig, & sokol, 2008, p. 1)
in-Volume 25, 2010
88 ternal elucidation, it behoves the educational researcher to seek an overall social aspect, since, as part of the social-constructivist (leach & scott, 2008) project, the social aspect of learning is important and much learning takes place within a social context such as schooling. this ul-timately derives from Vygotsky’s (1978) sociocultural view of learning that high level mental functioning in the individual is a component of the social life of the individual. as berger and Luckmann (1966, p. 49) stated, as soon as one observes phenomena that are specifically human, one enters the realm of the social. social construction is one of the ‘five pillars of wisdom’ of the cognitive acceleration through science education (case) project which seeks to combine the social constructivist approaches of Jean piaget and lev Vygotsky. for the biology educator and learner, constructivist approaches to learning about living things can be problematic. according to von Glasersfeld (1995) learning is not a process of acquiring ready made entities of knowl-edge and that purely objective knowlknowl-edge does not exist fully formed external to the learner, rather “knowledge is […] actively built up by the cognizing subject” and “the function of cogni-tion is adaptive; and serves the organizacogni-tion of the experiential world, not the discovery of on-tological reality”. human knowledge of living things is constructed, and highly personalized, and whereas there are biological facts which exist about living things external to the learner the present work seeks to acknowledge that rather than giving learners questions and examining them on whether they are ‘right’ or ‘wrong’, the professional educator will rather examine the measurable quality of similarity between the learners constructs and the teacher’s. only then can informed and evidenced-based remediations take place, otherwise the learner continues to be blamed for any shortcomings in their knowledge and the onus wholly on them to improve.
Volume 25, 2010 89
be used as an assessment item. mccloughlin & matthews (2006) examined similarity of grids within large groups of students in terms of taking the simple matrices or grids and subtracting them – a simple function of matrical arithmetic which would be sufficient on an individual basis of determining the ‘distance’ between a teacher’s conception and a single student’s. averaging whole class groups’ sets of grids was also done to consider the combined mental structure of the class group. such a combined mental structure is a construct of the mathematics of the program used to carry out this feature. in this present work, we examine whole class groups and measure the similarity between each person in the group and plot these similarities as links on a web diagram with each participant as a node on the web.
Methodology of Research
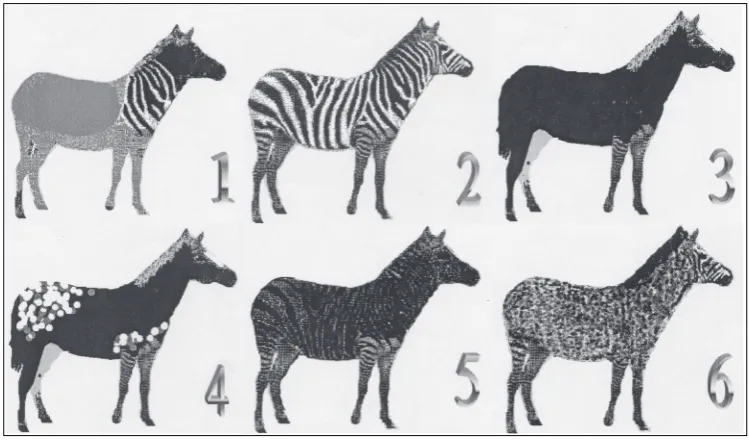
two sets of six equid images (figures 1 and 2) were presented to secondary school students (N=110) over five year groups out of six in a large community school in Ireland. A community school is an inclusive non-denominational and mixed gender school. secondary schooling in ireland is from 12 until 18 years. the equines that were chosen were a mixture of familiar, less familiar and fictitious taxa. They were quagga, zebra, horse, the appaloosa breed of horse, the melanic zebra and the speckled zebra in the first set (Figure 1); and melanic zebra, dartmoor pony, mountain zebra, mesohippus, quagga and eohippus in the second set (figure 2). the shape, size and habit (i.e., poise) were factors, which were kept constant; in fact, all of the equines were produced from an altered ‘bitmap’ of the zebra. the key features and rationale for inclusion of the specific examples are given in Table 1. An exhaustive list of features was pre-sented to the subjects who had to choose a feature that best described the first animal; another feature that best described the second and so on. they then had to rank each feature in turn with each animal thus again producing a matrix of six columns by six rows. the investigator entered all the grids obtained into repGrid 2.1 (shaw, 2009) manually.
Figure 1. The first set of equids.
Volume 25, 2010 90
Figure 2. The second set of equids.
Table 1. Descriptions of the images in the equid study.
Set English Name Latin Binomial Graphic Style Rationale for inclusion
First Horse Equus caballus bitmap this is a stereotype of an equid, a basic example but with stripes on its leg
First &
Second Melanic zebra Equus burchelli bitmap & cartoon
a rare form of plains zebra resulting from a genetic state which caused a large deposition of melanin in the coat of this individual.
First Speckledzebra not applicable bitmap an imaginary equid
First Plains zebra Equus burchelli bitmap this is a stereotype zebra, the common image of a zebra
First &
Second Quagga Equus burchelli quagga bitma & cartoon
a subspecies of the plains zebra. It is extinct at present but attempts are being made to ‘resurrect’ this subspecies.
First Appoloosa Equus caballus bitmap this is a north American breed or horse with distinctive coat markings that appears counter intuitive to Europeans
Second Dartmoor Equus caballus cartoon
an ancient breed of horse of a shape and habit that humans would have been more accustomed to than ‘modern’ thorough-bred types
Second Mountain zebra Equus zebra cartoon a zebra that appears to the untrained eye to have extra stripes
Second Eohippus Hyracotherium cartoon extinct, a small horse like animal with multiple toes about the size of a large dog
Volume 25, 2010 91
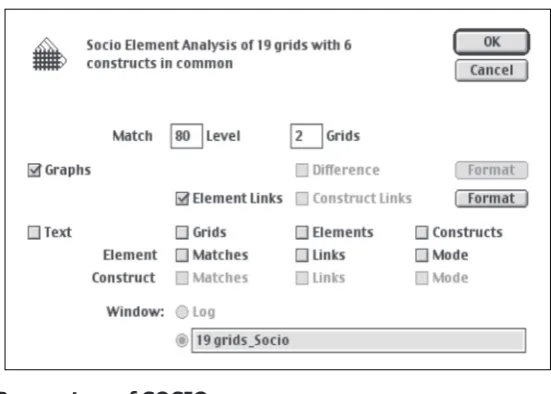
a sequence of socio-metric diagrams called socionets in the part of repGrid 2.1 called socio are produced from the matrix of similarity measures between pairs of individual grids. the highest related pair is picked out initially as a sub-group, followed by the sub-groups de-fined by the rank ordering of all similarity measures. A number of choices must be made with socio, not least whether the user wishes to view the output of the comparison in a textual or graphical format. in the textual format, a number of criteria for the comparison can be checked, and in this thesis, the author consistently checked the boxes, ‘grids’ and ‘links’. once the re-quired grids are opened and have been selected, similarity can be calculated between any two grids at a specifiable level of match. For much of the example described later, a match level of 80% was chosen, i.e., the percentage of the total maximum match was 80%. this value was chosen because experience showed that at lower levels, the number of links proliferated ad absurdum. the user has a choice of whether to have the output represented in a graphical (so-cionet) form or a text format. there are a number of options in the text based format: checking the ‘grids’ option leads to the output which is in effect a list of the input data.
Figure 3. Parameters of SOCIO.
Volume 25, 2010
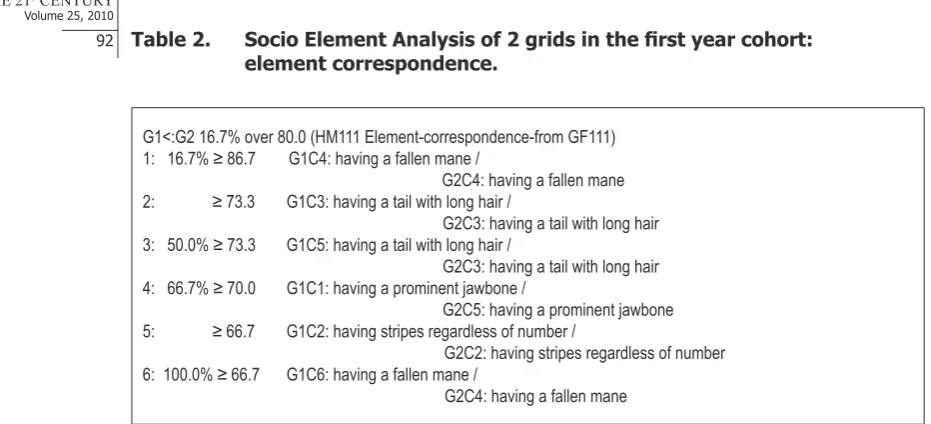
92 Table 2. Socio Element Analysis of 2 grids in the first year cohort:
element correspondence.
G1<:G2 16.7% over 80.0 (HM111 Element-correspondence-from GF111) 1: 16.7% ≥ 86.7 G1C4: having a fallen mane /
G2C4: having a fallen mane 2: ≥ 73.3 G1C3: having a tail with long hair /
G2C3: having a tail with long hair 3: 50.0% ≥ 73.3 G1C5: having a tail with long hair /
G2C3: having a tail with long hair 4: 66.7% ≥ 70.0 G1C1: having a prominent jawbone /
G2C5: having a prominent jawbone 5: ≥ 66.7 G1C2: having stripes regardless of number /
G2C2: having stripes regardless of number 6: 100.0% ≥ 66.7 G1C6: having a fallen mane /
G2C4: having a fallen mane
each pair of grids is compared in turn, construct by construct. for example one pair is G1 and G2; the comparison is not merely checking the occurrence of elements chosen in each grid but rather the ranks of each grid for this element. construct 6 in each grid (speckled zebra) shows a very low similarity at 16.7% at a level of 93.3 because they do not have the same ele-ments except two (having a horizontal body and having no mane at all) but with the same rank with the first element. In the G1C4 (appoloosa) to G2C2 (zebra) comparison, different con-structs have the same element but it has been ranked ‘2’ in the appoloosa and ‘1’ in the zebra, thus this gains a similarity score of 50% at level 73.3. in the G1c1 to G2c1 (both of which are quagga) comparison, they have two elements the same, one with the same rank which ‘earns’ 100% similarity at a relatively low level of 66.7. the program calculates an overall similarity at the specified level (80) which in this case was 33.3%. The information from the comparisons can be represented in a graphical form known as a socionet. this demonstrates in a simple way where the links between constructs exist by plotting the subjects as equidistant points in a poly-gon (where the number of apices equals the number of grids) and drawing a vector between the grids represented as points where a link exists at a specified level. The user selects this option on the socio parameter window (figure 3) by checking the graph rather than text option. if the level chosen is too high, there will not be many links made, and the converse is therefore true, too low a level and so many links are made to make the graphic unreadable.
Results of Research
The first years, 12 – 13 year olds
Volume 25, 2010 93
was lowered to 70.0 to attempt to see if a more open structure emerged, however, it did not until an even lower level was used, so low in fact that the percentage similarity was in effect a poor match level. the second set of pictures was certainly processed by the students differently than the first set.
Element Links (at least 70% over 80.0)
SH1 PK111 PH111 PF111 NF111 MKJ111 MJ111 KD111 JL111 JG111 HM111 GF111a EK111 DG111 DF111 COB111 CM111 CF111 AN111 CJB1+ expert1
Element Links (at least 100% over 100.0)
SK122 SH122 RL122 PK122 PH122 PF122 NF122 KD122 JL122 JH122 JG122 HM122 GK122 EK122 DG122 DF122 COB122 CM122 CF122 AK122 expert2 CJB2+
The second years, 13–14 year olds
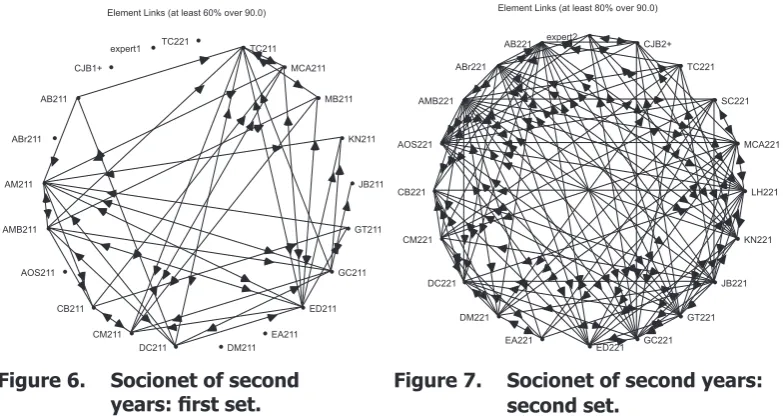
the second year results (figures 6 and 7) showed a high degree of consensus. in the 60% at level 90 socionet, a number of individuals had no connections with anyone else. abr211 for some reason omitted one of the constructs, and used one of the elements twice. thus, abr211 may not have understood the task set, and ea211 had only two connections. ed211 and am211 appear to be the stereotype for this group, because they have the greatest number of links (n=9). note that both experts (‘cJb’ and ‘expert1’) are isolates.
Element Links (at least 60% over 90.0)
TC221 TC211 MCA211 MB211 KN211 JB211 GT211 GC211 ED211 EA211 DM211 DC211 CM211 CB211 AOS211 AMB211 AM211 ABr211 AB211 CJB1+ expert1
Element Links (at least 80% over 90.0)
expert2 CJB2+ TC221 SC221 MCA221 LH221 KN221 JB221 GT221 GC221 ED221 EA221 DM221 DC221 CM221 CB221 AOS221 AMB221 ABr221 AB221
if we compare the sets of the second year students (figure 6 and 7), the second set show a higher degree of consensus. We might assume that when a group of individuals cannot
Figure 4. Socionet of first years:
first set. Figure 5. Socionet of first years:second set.
Figure 6. Socionet of second
Volume 25, 2010
94 achieve consensus “easily”, then the stimuli must be creating some cognitive conflict as indeed they were designed to do. the value of the repertory grid analysis is that it can detect such conflict within a class group and then the educator can refer back to the original grids or plots to determine the source of the conflict. In the second set (Figure 7) KN222 (whom is the same as Kn221) appears to the stereotype.
Third years, 14–15 year olds
Element Links (at least 90% over 90.0)
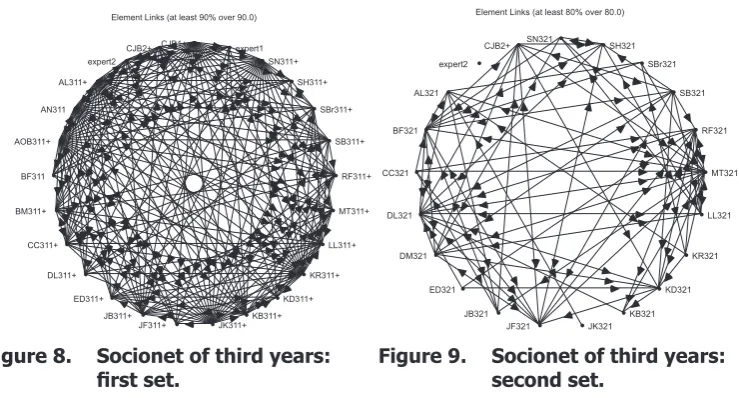
CJB1+ expert1 SN311+ SH311+ SBr311+ SB311+ RF311+ MT311+ LL311+ KR311+ KD311+ KB311+ JK311+ JF311+ JB311+ ED311+ DL311+ CC311+ BM311+ BF311 AOB311+ AN311 AL311+ expert2 CJB2+
Element Links (at least 80% over 80.0)
SN321 SH321 SBr321 SB321 RF321 MT321 LL321 KR321 KD321 KB321 JK321 JF321 JB321 ED321 DM321 DL321 CC321 BF321 AL321 expert2 CJB2+
In the third year group, in the first set (Figure 8), a high degree of linkage was achieved at a relatively low set of constraint compared to the second set (figure 9). this was also true for the fourth years (figure 10) but it was even more marked that at a wide range of parameters, “confluent” (that is, it appeared that all students were linked to all others) linkage occurred indicating an almost uncanny similarity between the grids of the fourth year students. note that ‘expert 2’ (the first expert) is an isolate also.
The Fourth Years, 15 - 16 year olds (elective)
Element Links (at least 80% over 90.0)
TC411 SH411 SE411 RP411 RM411 RG411 PC411 NK411 NC411 MD411 KM411 KC411 JBK411 JB412 EF411 DK411 BF411 AT411 AMA412 AM411 expert1 CJB1+
Element Links (at least 90% over 90.0)
KC422 NC422 NK422 RP422 PC422 TC422 SE422 JB422 ER422 EF422 DK422 CF422 BF422 AT422 expert2 CJB2+
Figure 8. Socionet of third years:
first set. Figure 9. Socionet of third years:second set.
Figure 10. Socionet of fourth years:
Volume 25, 2010 95
In the fourth year group, there is an almost identical perceived similarity of the first set of equids as evidenced by the same result over a number of parameters, (figure 10). this not the case with the second set where a wide variety of interpretations exists among the students, hence a ‘disparate’ socionet at the lower set of parameters (figure 11), however, relatively speaking there remains a high degree of commonality.
The Fifth years, 15 – 17 year olds
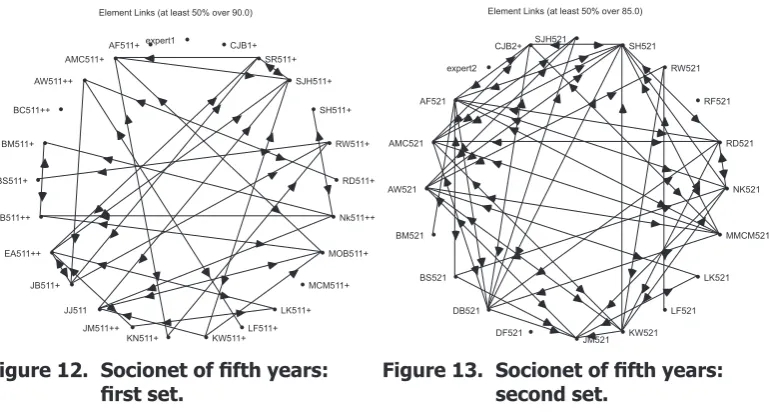
Element Links (at least 50% over 90.0)
expert1 CJB1+
SR511+
SJH511+
SH511+
RW511+
RD511+
Nk511++
MOB511+
MCM511+
LK511+ LF511+ KW511+ KN511+
JM511++ JJ511 JB511+ EA511++ DB511++
BS511+ BM511+
BC511++ AW511++
AMC511+ AF511+
Element Links (at least 50% over 85.0)
SJH521
SH521
RW521
RF521
RD521
NK521
MMCM521
LK521
LF521
KW521 JM521 DF521
DB521 BS521 BM521 AW521 AMC521
AF521 expert2
CJB2+
Here, we observe that the fifth years have a disparate understanding or perception of both sets of equids. it may be conjectured that whereas the second set of equids has caused a naïve theory to emerge since many of the pictures were of unfamiliar creatures, the fifth years now also seem to be individuating naïve theories concerning the first set of equids. Why this might be the case is unclear, however some peer influence may be at work.
Discussion
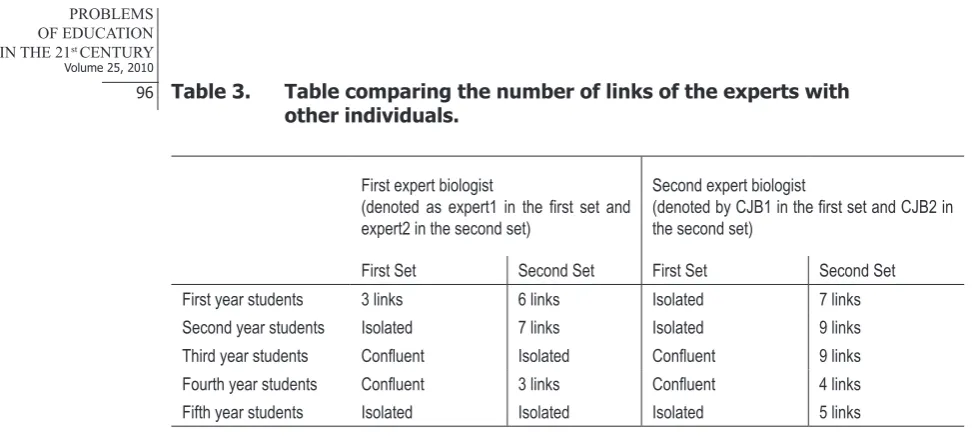
When educators teach, and learners learn, there is a need to examine the closeness of fit of the outcomes of both activities. The conception that the educator has constructed in their teaching should be replicated in the mind of the learner as a learned entity. taking our cue from biological theory and informatics, measures of similarity between these two entities within groups of students were made and represented as socionets. throughout the preceding socionet diagrams the experts were represented. We can tabulate the links (and thus similarities of a par-ticular ‘strength’ and table 3. shows the number of links that the experts share with the students. no developmental trend was evident: the experts did not appear to share much understanding of the constructs with the second and fifth year students as evidenced by the experts forming isolates at a relatively low socionet parameters. Whereas, the experts shared the same con-struct representations with the third and fourth year students’ concon-structs in the first set of visual stimuli denoted in Table 3. as ‘confluent’. Otherwise the experts did have a modest number of links in the remaining socionets, in general, during the administration of the second set of visual stimuli. Further research is necessary to establish why the fifth year students individuate more than, say, the third and fourth year students.
Figure 12. Socionet of fifth years:
Volume 25, 2010
96 Table 3. Table comparing the number of links of the experts with
other individuals.
First expert biologist
(denoted as expert1 in the first set and expert2 in the second set)
Second expert biologist
(denoted by CJB1 in the first set and CJB2 in the second set)
First Set Second Set First Set Second Set
First year students 3 links 6 links Isolated 7 links
Second year students Isolated 7 links Isolated 9 links
Third year students Confluent Isolated Confluent 9 links
Fourth year students Confluent 3 links Confluent 4 links
Fifth year students Isolated Isolated Isolated 5 links
When a socionet is produced for a class group at the end of a learning sequence, its use lies in the comparison provided of comparing the teacher’s conception with the students’. this creates the unusual, in some contexts, situation whereby the teacher would complete the assessment task alongside their students. When the teacher’s conception appears isolated from most or all the students (see for example figure 6 and 12), the educator should consider that the lesson has not gone well. When the teacher’s conception appears part of a confluent linkage within a socionet (see for example Figure 10), the teacher can be satisfied that their instruction has resulted in a convergence of conceptions.
the fact that groups of students emerge as sharing an alternative conception and that the groups are defined by a calculated similarity, subjectivity is reduced in assessing the perform-ance of both teacher and student. the teacher can hone in a particular group to examine why their conceptions are different and counsel the students in their work. such a honing will require revisiting the original repGrids of those students who demonstrate a low similarity with the teacher and identifying the specific point on which they differ.
even when remediation work has been conducted to bring the learner’s and the teacher’s conceptions closer in similarity, the socio program can be run again to determine the degree of improvement, since the parameters of similarity can be set differently. this post-remediation run of the socio program does not have to involve all the students in the class but rather only the ‘targeted’ students, thus using socio can help to monitor the progress of students.
Conclusions
this work demonstrates that similarity per se can be a useful tool in monitoring teaching and learning. the similarity between a teacher’s and each of the students in a class group can be determined using the socio program and displayed graphically at a range of parameters.
the use of socionets within a learning environment assists teachers observe whether stu-dents may individuate their conceptions and diverge from either their teacher or their peers; or, whether the students form clusters showing up alternative conceptions that form within a social context – as opposed to individuations. monitoring remediation becomes possible therefore as part of an overall measurable objective assessment of student learning.
Volume 25, 2010 97
relatively simple and to be commended to educators who wish to instill a certain level of meas-urable objective monitoring of small-scale learning at the conceptual level.
the socionets produced showed a relatively high degree of commonality and the rela-tionship of the learners` conceptions could be investigated. coupled with the original matrices of scores produced from the original instrument provides a set of powerful tools for the educa-tor in investigating conceptual change / development.
References
atran, s. (1999). itzaj maya folkbiological taxonomy: cognitive universals and cultural particulars. in d. l. medin & s. atran (eds.), Folkbiology. cambridge, mass: mit press.
behne, t., carpenter, m., Gräfenhain, m., liebal, K., liskowski, u., moll, h., et al. (2008). cultural learning and cultural creation. in u. müller, J. i. m. carpendale, n. budwig & b. sokol (eds.), Social life and social knowledge: toward a process account of development. new york: lawrence erlbum as-sociates.
berger, p. l., & luckmann, t. (1966). The social construction of reality. Garden city, ny: doubleday. berlin, b. (1992). Ethnobiological classification: principles of categorization of plants and animals in
traditional societies. oxford: princeton university press.
berlin, b. (1999). how a folkbotanical system can be both natural and comprehensive: one maya indian’s view of the plant world. in d. l. medin & s. atran (eds.), Folkbiology. cambridge, mass: mit press. berlin, b., breedlove, d. e., & raven, p. (1974). Principles of Tzeltal plant classification. new york: academic press.
Gelman, s. a., & markham, e. m. (1987). young children’s inductions from natural kinds: the role of categories and appearances. Child Development, 38, 213–244.
Kelly, G. (1969). a mathematical approach to psychology. in b. maher (ed.), Clinical psychology and personality: the selected papers of George Kelly. new york: Wiley.
Kelly, G. (1992). The psychology of personal constructs: volume one – a theory of constructs (2nd ed.). london: routledge.
leach, J. t., & scott, p. h. (2008). teaching for conceptual understanding: an approach drawing on individual and sociocultural perspectives. in s. Vosniadou (ed.), International handbook of research on conceptual change. new york: taylor and francis.
mccloughlin, t. J. J., & matthews, p. s. c. (2006). Repertory grid technique in science education re-search. paper presented at the proceedings of the north american, european, and south american (nae-sa) conference: science and technology literacy in the 21st century, lefkosia, cyprus.
mccloughlin, t. J. J., & matthews, p. s. c. (2009). examining the structures of students’ concepts using repertory grid analysis. Problems of Education in the 21st Century, 18(18), 102–114.
medin, d. l., & atran, s. (eds.). (1999). Folkbiology. cambridge, mass: mit press.
müller, u., carpendale, J. i. m., budwig, n., & sokol, b. (2008). developmental relations between forms of social interaction and forms of thought: an introduction. in u. müller, J. i. m. carpendale, n. budwig & b. sokol (eds.), Social life and social knowledge: toward a process account of development. new york: lawrence erlbum associates.
shaw, m. l. G. (1980). On becoming a personal scientist: interactive computer elicitation of personal models of the world. london: academic press.
Volume 25, 2010
98 shaw, m. l. G., & Gaines, b. r. (1995, 4th august). Kelly’s geometry of psychological space and its significance for cognitive modelling. Retrieved 13th June, 1997, from http://ksi.cpsc.ucalgary.ca/arti-cles/newpsych92/references
slater, p. (1972). the measurement of consistency in repertory grids. British Journal of Psychiatry, 121, 45–51.
slater, p. (ed.). (1977). The measurement of intrapersonal space by grid technique: dimensions of intrap-ersonal space (Vol. 2). london: Wiley.
von Glasersfeld, e. (1995). Radical Constructivism: A Way of Knowing and Learning. london: the falm-er press.
Vygotsky, l. s. (1978). Mind in society: the development of higher psychological processes. cambridge, ma: harvard university press.
Adviced by Hugh Gash, St. Patrick’s College, Dublin, Ireland
Thomas J.J. McCloughlin Dr., Lecturer in Education, Education Department, St. Patrick’s College, (a college of Dublin City University), Drumcondra, Dublin 9, Ireland. E-mail: [email protected]
Website: http://homepage.mac.com/mccloughlin/buneolaiocht/buneolaiocht.html
Philip S.C. Matthews Dr., Senior Lecturer in Education, School of Education, Trinity College, University of Dublin, College Green, Dublin 2, Ireland.