An Effective Image Fusion Technique based on Multiresolution
Singular Value Decomposition
SONAMGAUTAM1
MANOJKUMAR2
1,2Department of Computer Science, 1,2Babasaheb Bhimrao Ambedkar University, Vidya Vihar, Raebareli Road, Lucknow (U.P.), India.
Abstract. The main objective of image fusion is to combine the multiple images of same scene into a single image having more information and better visual appearance, without introducing any artifacts. In this paper, a new multifocus and multisensor image fusion scheme based on Multiresolution Singular Value Decomposition (MSVD) and gradient based sharpness approach using Discrete Wavelet Transform (DWT) is proposed. The proposed scheme is conducted into two parts. In first part, each of the source images is decomposed using DWT and high frequency DWT coefficients are directly fused by gradient based sharpness method. In second part, low frequency DWT coefficients are further decomposed using MSVD and fused by averaging and maximum methods. To reconstruct the final fused image, inverse DWT is performed. The resultant fused image is enhanced and complete as compared to any of the source images. The experimental results obtained by proposed scheme are compared with the existing schemes. The experimental results and comparison demonstrate the effectiveness of proposed scheme.
Keywords: Discrete wavelet transform, multiresolution singular value decomposition, peak-signal-to-noise-ratio, correlation coefficients, standard deviation.
(Received October 8th, 2015 / Accepted February 4th, 2016)
1 Introduction
In the recent development of technologies, image fusion has become an important and useful application for im-age analysis, imim-age enhancement and computer vision [1]. Image fusion is the process of integrating all sig-nificant information from two or more images of same scene into a single composite image. The main objec-tive of image fusion is to make the fused image more informative with better visual appearance. In image fu-sion, it is tried to obtain fused image without any dis-tortion and loss of information. Image fusion has been successfully used in various fields such as remote sens-ing, military, medical diagnosis, robotics, surveillance, etc. Generally, a single image of complex scene does not contain enough information for appropriate
analy-sis of the scene. If one image is focused on object and other is out-of-focus, then to get entire scene in focus in a single image is a difficult task. Although, com-bining the details of the source images appropriately, a single image with more information can be obtained. The process of combining the details of different focus-ing target images into a sfocus-ingle image with entire scene in focus is known as the multi-focus image fusion.
If the images of same scene are taken by different sensors then, each of the source images gives some rel-evant information according to its sensor ability. To improve the quality and information of images, the in-formation of different sensor images is combined us-ing fusion process. For example, CT (Computed To-mography) and MRI (Magnetic Resonance Imaging)
images are captured by different sensors to diagnose the diseases. CT images are best suited for viewing the information of bone, blood vessels and soft tissues, whereas MRI suited for viewing much more informa-tion of soft tissues. Individually, these source images may not give sufficient information for a single body part having bones and tissues. Therefore, the details of CT and MRI are combined to achieve a single fused image with all relevant information of the part. This kind of fusion process is known as multi-sensor image fusion.
Image fusion algorithms are broadly classified into three categories: pixel level, feature level and deci-sion level. Pixel level fudeci-sion defines the process to combine relevant information from each source images pixel by pixel into a single composite image contain-ing more source details. Pixel level fusion is the low-est level of image fusion. It is easy to implement and time efficient, therefore most of the image fusion tech-niques are based on pixel level method [2]. In feature level fusion, by extracting the features such as color, edges and texture from all source images, fusion is performed based on features with some certain selec-tion criteria [3]. Decision level fusion is the highest level of image fusion. It combines the results from multiple algorithms to provide a final decision for fu-sion [4]. Fufu-sion techniques are generally performed in two domains: spatial and transform [5]. In spatial do-main, pixel by pixel fusion is performed over the all source images and a single fused image is achieved. Some spatial domain techniques of fusion are: av-erage method [6] [7], Principal Component Analysis (PCA) method [8] [9], Intensity-Hue-Saturation (IHS) method [10] [11], High Pass Filter (HPF) [12], etc. Generally, spatial domain methods produce several un-desired effects, such as distortion and reduced con-trast. To overcome these problems, transform domain approaches were proposed, which provide directional information in all decomposition and contain unique information at different resolutions. Various kind of multi-resolution transform approaches have been pro-posed for image fusion, including DWT [13], Station-ary Wavelet Transform (SWT) [33], Curvelet form (CVT) [30], Nonsubsampled Contourlet Trans-form (NSCT) [31], etc. In [22], the perTrans-formances of image fusion algorithms using multi-resolution trans-forms are compared with CVT and contourlet to ob-tain better fusion results. Another, multifocus image fusion technique is given using Dual-Channel Pulse Coupled Neural Networks (Dual-Channel PCNN) [23] which incorporates focus measure of source images to compute weighted coefficients. In [24], multifocus
im-age fusion and restoration is presented using sparse-representation. In this method, sparse coefficients are calculated from the source images and these coefficients are combined using maximum fusion rule. Similarly, another sparse representation image fusion technique [25] has been proposed based on overlapping patches instead of the whole image and simultaneously the or-thogonal matching pursuit technique is used which de-composes the source images into the same subset of dic-tionary bases. Image fusion based on contourlet packet is introduced followed by a Nonsubsampled Directional Filter Bank (NSDFB) [26] which provides a more ac-curate fused image than wavelet packet method. The new multifocus image fusion based on sharpness cri-terion [27] is given to enhance the sharp information and remove blur details of the images. In [28], mul-tisensor image fusion in remote sensing is presented, it describes mainly pixel based image fusion of Earth observation satellite data. A multi-resolution image fu-sion [29] based approach is proposed to combine the high and low resolution images data by adding some wavelet planes to the low resolution intensity compo-nent and obtained a better fused image. DWT based fu-sion [13] is proposed, in which the maximum selection rule is used. This simple scheme just selects the largest absolute wavelet coefficients at each location from the input images. Similarly, another fusion technique is in-troduced based on wavelets and principal component analysis [9]. In which source images are decomposed into low and high frequency subbands using DWT and obtained coefficients are transformed into uncorrelated coefficient and the eigenvalues are evaluated from prin-cipal components (PCs). The scheme selects two high-est principal components and represent these as weights for fusion rule. Finally, inverse DWT is performed to achieve a final fused image.
In [14], a multiresolution singular value decomposi-tion based scheme is proposed which gives better re-sults than DWT based scheme [13] both in terms of quality and execution time. In this scheme, maximum selection rule is performed over detailed coefficients and averaging is performed over approximation coef-ficients to get the final fused image. In DWT, mul-tiresolution decomposition is based on low and high pass filters. Low pass filters outputs to approxima-tion part which contains most of the informaapproxima-tion of im-age whereas, high pass filter outputs to detailed sub-bands which contain directional (horizontal, vertical and diagonal) information. However, on the other hand, the decomposition in MSVD is based on singu-lar/eigenvalues. Here, the approximation part is cor-responding to larger eigenvalues and contains most of
Gautam and Kumar An Effective Image Fusion Technique based on Multiresolution Singular Value Decomposition 33
the information whereas, the detailed coefficient cor-respond to edges, texture, boundaries and other sharp changes in image [14]. With this motivation, we pro-pose a new image fusion scheme using DWT and MSVD. In this scheme, the DWT is applied on both the source images and approximation and detailed com-ponents are obtained. Since the detailed comcom-ponents contain directional information therefore it is quite log-ical to apply the gradient based fusion rule directly on the detailed coefficients of both the images. However, the obtained approximation part is further decomposed into low and high frequency coefficients using MSVD. Again, the obtained low frequency coefficients contain the most of the average information, therefore the aver-aging method is the best suited for fusion, whereas the detailed coefficients are responsible for sharper changes and the maximum selection method is quite appropri-ate to fuse the detailed coefficients. Finally, the inverse MSVD and inverse DWT is performed on fused coeffi-cients to get the fused image.
The remainder of the paper is organized as follows: basic theory of DWT and MSVD is discussed in Section 2. Proposed scheme of image fusion is introduced in Section 3. Experimental results followed by discussion are given in Section 4. Finally, concluding remarks are presented in Section 5.
2 Basic theory of DWT and MSVD
In this paper, discrete wavelet transform and multires-olution singular value decomposition are used for mul-tifocus and multisensor image fusion. In this section, basic theories of DWT and MSVD are discussed.
2.1 Discrete Wavelet Transform (DWT)
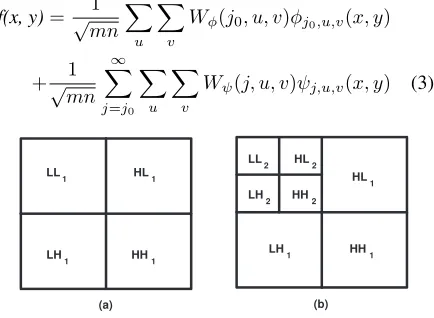
Due to the multiresolution property, discrete wavelet transform is widely used in image processing [13]. DWT is a technique, which converts an image from spa-tial domain to frequency domain. It is used to analyze an image at different resolutions. We can obtain hori-zontal, vertical and diagonal information of the images using DWT. At first level decomposition, DWT decom-poses the image into two parts: approximation and de-tailed parts. Approximation part contains one low fre-quency subband (LL) and detailed parts contain three high frequency subbands (LH, HL and HH), as shown in Fig. 1(a). Most of the information of image is con-tained in approximation part. For second level decom-position, approximation part is further decomposed into four frequency subbands, as shown in Fig. 1(b). The de-composition levels can be increased as per the require-ment.
2-D DWT [19] for imagef(x, y)of size m×n is defined as
Wφ(j0, u, v) =
1
√ mn
m−1
X
x=0 n−1
X
y=0
f(x, y)φj0,u,v(x, y) (1)
Wψ(j, u, v) =
1
√ mn
m−1
X
x=0 n−1
X
y=0
f(x, y)ψj,u,v(x, y) (2)
where, Eqs. (1) and (2) are respectively approxima-tion and detailed coefficients of imagef(x, y). Finally, inverse DWT is used to reconstruct the image. For the above given Eqs. (1) and (2), the inverse DWT is given as
f(x, y)= √1 mn
X
u
X
v
Wφ(j0, u, v)φj0,u,v(x, y)
+√1 mn
∞
X
j=j0
X
u
X
v
Wψ(j, u, v)ψj,u,v(x, y) (3)
LL
2 HL2
HL
1
LH
2 HH2
LH
1 HH1
LL
1 HL1
LH
1 HH1
(a) (b)
Figure 1:(a) First level 2-D DWT decomposition; (b) second level 2-D DWT decomposition.
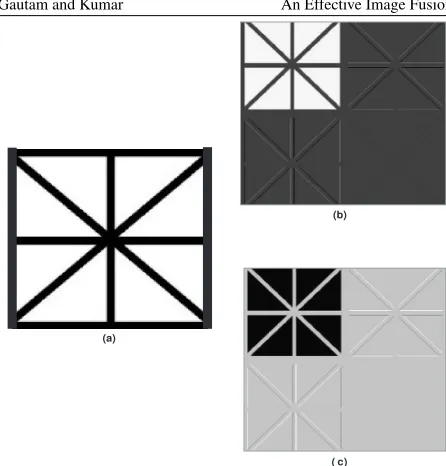
Fig. 2(a) shows the original synthetic image and Fig. 2(b) shows its first level decomposition using DWT. The directional information (HL, LH and HH) is more clear in detailed subbands in DWT based de-composition.
2.2 Multiresolution Singular Value Decomposition
(MSVD)
A singular value decomposition [15, 16, 17] of a matrix Aof sizem×ncan be written as:A=U SVT, whereU andVareleftandright singular vectorsof sizem×m
andn×nrespectively.UandVareorthogonalmatrices andS is a diagonal matrix of size m×ncontaining eigenvalues in non-increasing order.
For a matrixA of size m×n the MSVD [18] is computed as follows:
1. Divide the matrixA into non-overlapping blocks of sizek×land write each block in the form of a vector.
(a)
(b)
( c)
Figure 2:(a) Original image; (b) first level DWT decomposition; (c) first level MSVD decomposition.
2. Stack the vectors in columns and form the matrix
A1of sizekl×mn/kl.
3. Compute the scatter matrix,T1 = ¯A1A¯1 T
of size
kl×kl.
4. Find the orthogonal matrixU1 for scatter matrix
T1.
5. Compute the diagonal matrix S1 containing the squares of eigenvalues in decreasing order as,
S12=U1TT U1.
6. Construct matrixAˆ=U1TA¯1.
ˆ
Acontains approximation and detailed parts. First row of Aˆ is considered as approximation part containing larger singular values. Similarly, the remaining rows of
ˆ
Aare regarded as the detailed parts containing remain-ing sremain-ingular values, i.e.Φ1= ˆA(1,:)andΨi1= ˆA(i,:), where,Ψi1is theithdetailed subbands at level 1. The first level MSVD decomposition of a synthetic image is shown in Fig. 2(c). Here, the decomposition is based on eigenvalues.
3 Proposed Scheme
In this section, the proposed scheme is described in brief. In the proposed scheme, two less informative (multifocus and multisensor) images are used to obtain a fused image having more information. For multifo-cus and multisensor image fusion, two multifomultifo-cus and
multisensor images are considered as source images. In the proposed work, DWT is applied uptol-levelover the source imagesX andY, as given in Fig. 3, which decomposes each of the source images into low (LLX l andLLYl ) and high frequency subbands ((HLXl , LHlX
andHHlX) and (HLYl , LHlY andHHlY)) respectively, as discussed in Section 2.1.
Over the low frequency subbands (LLX
l andLLYl ) of both of the transformed images, MSVD is per-formed. When MSVD is applied, LLX
l and LLYl of both of the transformed images are further de-composed into low frequency (ΦLLl X andΦLLl Y) and high frequency subbands ((ΨHLX
l ,Ψ LHX
l ,Ψ HHX
l ) and
(ΨHLY l ,ΨLH
Y
l ,ΨHH
Y
l )) respectively, as discussed in Section 2.2. Low frequency subbands refers to ap-proximation part and high frequency subbands treated as detailed parts. Obtained low frequency coefficients (ΦLLl X,ΦLLl Y) of both of the transformed images are fused using pixel averaging method. In pixel averag-ing fusion method, average pixel values from both of the transformed images are selected to fuse. Whereas, high frequency coefficients (ΨHLX
l ,Ψ LHX l ,Ψ
HHX
l )
and (ΨHLY l ,ΨLH
Y
l ,ΨHH
Y
l ) of both of the transformed images are combined using maximum method. In max-imum method, corresponding maxmax-imum values from both of the transformed images are selected to fuse. Ob-tained orthogonal matricesUlX andUlY, as discussed in Section 2.2 are fused using averaging fusion method. Further, over the obtained fused coefficients from low and high frequency subbands, an inverse MSVD is per-formed and set of new fused coefficient is obtained and represented asωa.
Remaining high frequency coefficients
(HLXl , LHlX, HHlX) and (HLYl , LHlY, HHlY), as given in Fig. 3 of both of the transformed images are fused using gradient based sharpness focus method [20] [21]. The gradient coefficients are computed as follows:
∇G(z) = [∇Gp(z)2+∇Gq(z)2]1/2 (4)
where,∇Gp(z),∇Gq(z)can be defined as:
∇Gp(z) =
(
−D(p−1, q−1, r, s)−2D(p−1, q, r, s)
−D(p−1, q+ 1, r, s) +D(p+ 1, q−1, r, s)
+2D(p+ 1, q, r, s) +D(p+ 1, q+ 1, r, s)
)
Gautam and Kumar An Effective Image Fusion Technique based on Multiresolution Singular Value Decomposition 35
Low frequency coefficients
Pixel averaging method
Fused image
Source imageY
Source imageX
averaging
Low frequency coefficients High frequency
coefficients
High frequency coefficients
Low frequency
coefficients maximum
method High frequency
coefficients
High frequency coefficients Low frequency coefficients
Uxl
UYl
Gradient based fusion
Figure 3:Block diagram of proposed scheme
∇Gq(z) =
(
D(p−1, q−1, r, s) + 2D(p, q−1, r, s)
+D(p+ 1, q−1, r, s)−D(p−1, q+ 1, r, s)
−2D(p, q+ 1, r, s)−D(p+ 1, q+ 1, r, s)
)
In this method, letz = (p, q, r, s)be represent the index of a particular multiscale decomposition coeffi-cient, where (p,q) represents the spatial position,r de-composition level and sfrequency band of multiscale decomposition.
Obtained gradient coefficients of both of the transformed images are fused using pixel averaging method and new fused coefficients (ωh, ωvandωd) are obtained. Finally, to reconstruct the final fused image
(If), inverse DWT is performed over the obtained all fused coefficients (ωa, ωh, ωv andωd). The block diagram of the proposed scheme is given in Fig. 3. The algorithm is summarized in the following steps:
Algorithm:
1. Take two source imagesXandY.
2. Apply DWT over the source images, which de-composes each of the images into four sub-bands: (LLXl , HLXl , LHlX and HHlX) and (LLYl , HLYl , LHlY andHHlY).
3. Perform MSVD on approximation part
(LLX l , LL
Y
l ) of both of the transformed
im-ages and obtain approximation (ΦLLX
l andΦLL
Y
l ) and detailed parts ((ΨHLl X,ΨLHl X,ΨHHl X) and (ΨHLY
l ,Ψ LHY
l ,Ψ HHY
l )) (given in Section 2.2).
4. Apply pixel averaging method on ΦLLl X and
ΦLLY
l of both of the transformed images
and maximum method on high frequency
coefficients (ΨHLX l ,ΨLH
X
l ,ΨHH
X
l ) and
(ΨHLl Y,ΨLHl Y,ΨHHl Y).
5. Apply averaging method on UX
l and UlY (dis-cussed in Section 2.2).
6. Apply inverse MSVD on fused coefficients and ob-tain fused coefficientωa.
7. Apply gradient based fusion on detailed parts (HLX
l , LH X
l and HH X
l ) and (HL Y l , LH
Y l and
HHY
l ) using averaging method and obtain fused coefficients (ωh, ωv, ωd).
8. Perform inverse DWT, over the all fused coef-ficients (ωa, ωh, ωv, ωd) to reconstruct the final fused image(If).
4 Experimental results
The proposed scheme is tested on several test images of size512×512shown in Fig. 4(a), 5(a), 6(a), 7(a) and also of size 256×256 shown in Fig. 8(a) and 9(a). All these images are considered as reference images
(Ir). In the proposed work, DWT method with Haar as the wavelet basis is used. Before applying DWT, each of the reference images in Fig. 4(a), 5(a), 8(a) and 9(a) are convolved by a gaussian blurring of 13×13
window with standard deviations σ = 5 and multi-focus(defocus) source images X and Y are obtained. Fig. 6(a), 6(b), 6(c) are considered as dataset1 source images and 7(a) and 7(b) are FLIR and LLTV source images as dataset2 [14]. Fig. 8(a) and 9(a) are the TNO’s UN camp and head monument visual images, which are online available athttp://www.deakin.edu.
au/~mhossny/fusion/.
Fig. 4(b), 8(b) and 9(b) are blurred on left part, whereas Fig. 4(c), 8(c) and 9(c) are blurred on right part. Fig. 5(b), 6(b) are upper side blurred images and Fig. 5(c), 6(c) are lower side blurred images, respec-tively. The results of our proposed scheme is compared with DWT [13], DWT with PCA [9], MSVD [14], SWT [33], CVT [30], NSCT [31] based fusion methods. The results of the respective existing schemes are shown in Fig. 4(d-i), 5(d-i), 6(d-i), 7(d-i), 8(d-i), and 9(d-i).
Results obtained by our proposed scheme are given in Fig. 4(j), 5(j), 6(j), 7(j), 8(j), and 9(j). It can be visually seen that the resultant images from proposed scheme contain better information than other existing schemes. But only visual inspection is not sufficient to measure the quality of images. To measure the quality of fused images quantitatively some parameters are used such as PSNR, correlation coefficients (C.C.), mean, standard deviation (S.D.), mutual information (MI),Q0, QW, QE andQAB/F. The higher values of these parameters stand for better fusion result. The su-periority of the results is highlighted by bold letters and shown in Table 1. It is clear that in most of the cases, results by the proposed scheme are better as compared to other existing schemes.
The above metrics are defined as follows:
1. PSNR [34] quantitatively evaluates the error be-tween one of the reference and fused images. MSE indicates how much error fused image conveyed in the reference image.
P SN R= 10 log10
2552
M SE
(5)
where, MSE is defined as:
M SE= 1
mn
m−1
X
i=0 n−1
X
j=0
[Ir(i, j)−If(i, j)]2
where, Ir and If denote the ideal reference im-age and fused imim-age. PSNR values of proposed
scheme and existing schemes for various test im-ages are calculated. Higher PSNR values indicate better visual quality. From Table 1, it is evident that the proposed scheme is achieved better PSNR results with good visual information as compari-son to other existing schemes.
2. The correlation coefficient [34] measures the de-gree in which two variables are linearly related. The value of correlation coefficient lying between
[0,1]. Correlation coefficient between m×n is defined as: ρ= s Pm i=1 Pn
j=1[Ir(i, j)−If(i, j)]2
mn (6)
Correlation coefficient values for proposed scheme and existing schemes are calculated between the reference and fused images. The correlation coef-ficient values near to 1 indicates the reference im-age and fused imim-age contain almost similar infor-mation. It is observed from Table 1 that the pro-posed scheme has scored better correlation result.
3. The mean and standard deviation [34] are defined as:
ˆ
µ= 1
mn m X i=1 n X j=1
If(i, j) (7)
σ= v u u t 1
mn−1
m X i=1 n X j=1
(If(i, j)−µˆ)2 (8)
For various test images, standard deviation is cal-culated for proposed and existing schemes. Higher standard deviation value indicate high contrast im-age. Hence, it is observed from Table 1 that the proposed scheme provides better results in com-parison to others.
4. Mutual information(MI)[22] is a metric measure reflects that the total amount of information that the fused image contains of source images. It is defined as the sum of mutual information between each source image and the fused image. The mu-tual informationIX,If between sourceXand fused
imageIfis given as follows:
IX,If = X
i,j
hX,If(i, j) log
hX,If(i, j) hX(i)hIf(j)
(9)
Gautam and Kumar An Effective Image Fusion Technique based on Multiresolution Singular Value Decomposition 37
(a) (b) ( c) (d) (e)
( f) ( g) (h) ( i) ( j )
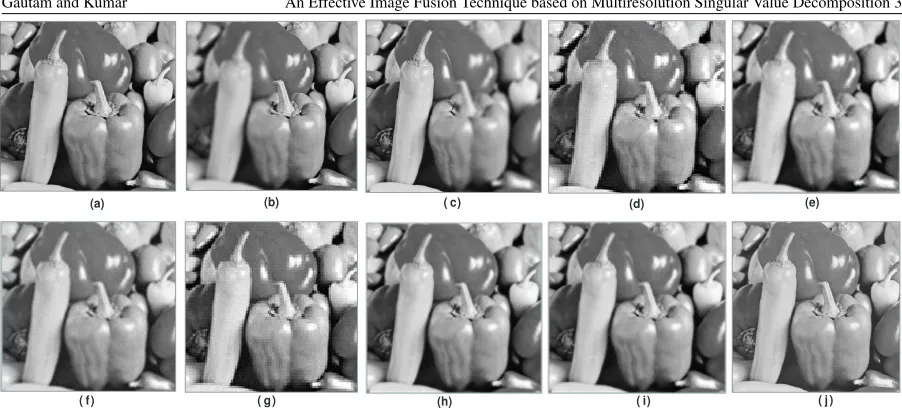
Figure 4:Fusion results for pepper image: (a) Reference image (original image); (b) image blurred on the left; (c) image blurred on the right; (d) fused image by DWT; (e) fused image by DWT + PCA; (f) fused image by MSVD; (g) fused image by SWT; (h) fused image by CVT; (i) fused image by NSCT; (j) fused image by proposed scheme.
(a) (b) ( c) (d) (e)
( f) ( g) (h) ( i) ( j )
Figure 5:Fusion results for lena image: (a) Reference image (original image); (b) blurred on upper part; (c) blurred on lower part; (d) fused image by DWT; (e) fused image by DWT + PCA; (f) fused image by MSVD; (g) fused image by SWT; (h) fused image by CVT; (i) fused image by NSCT; (j) fused image by proposed scheme.
respectively. Similarly, IY,If represents the
mu-tual information between other source imageYand fused image If. Hence, the total mutual infor-mation(MI)between the source imagesX, Y and fused imageIf is given as:
M I=IX,If +IY,If (10)
The largerMIvalue represents better fusion result. From Table 1, it is observed that the results ob-tained from proposed scheme are better than
oth-ers.
5. The metric Q0 [22] measures distortion of the fused image, it is a combination of three compo-nents as correlation, luminance and contrast [32]. The metricQ0between the source imageXand the fused imageIfis defined as follows:
Q0(X, If) =
4σij¯i¯j
(σ2 i +σ
2
j)(¯i2+ ¯j2)
(11)
(a) (b) ( c) (d) (e)
( f) ( g) (h) ( i) ( j)
Figure 6:(a) Reference image (original image); (b) blurred on upper part; (c) blurred on lower part; (d) fused image by DWT; (e) fused image by DWT + PCA; (f) fused image by MSVD; (g) fused image by SWT; (h) fused image by CVT; (i) fused image by NSCT; (j) fused image by proposed scheme.
(a) (b) ( c) (d)
(e) ( f) ( g) (h) ( i)
Figure 7:(a) FLIR image; (b) LLTV image; (c) fused image by DWT; (d) fused image by DWT + PCA; (e) fused image by MSVD; (f) fused image by SWT; (g) fused image by CVT; (h) fused image by NSCT; (i) fused image by proposed scheme.
Gautam and Kumar An Effective Image Fusion Technique based on Multiresolution Singular Value Decomposition 39
(a) (b) ( c) (d) (e)
( f) ( g) (h) ( i) ( j )
Figure 8:Fusion results for TNO’s UN camp image: (a) Reference image (original image); (b) blurred on left part; (c) blurred on right part; (d) fused image by DWT; (e) fused image by DWT + PCA; (f) fused image by MSVD; (g) fused image by SWT; (h) fused image by CVT; (i) fused image by NSCT; (j) fused image by proposed scheme.
(a) (b) ( c) (d) (e)
( f) ( g) (h) ( i) ( j )
Figure 9:Fusion results for head monument image: (a) Reference image (original image); (b) blurred on left part; (c) blurred on right part; (d) fused image by DWT; (e) fused image by DWT + PCA; (f) fused image by MSVD; (g) fused image by SWT; (h) fused image by CVT; (i) fused image by NSCT; (j) fused image by proposed scheme.
where, σij denotes the covariance, σi2, σ2j rep-resent the variance and ¯i,¯j denote mean value of source image X and fused image If, respec-tively. Q0(X, Y, If)represents the average value between Q0(X, If) andQ0(Y, If), as given be-low:
Q0(X, Y, If) =
Q0(X, If) +Q0(Y, If)
2 (12)
The value ofQ0lies between[−1,1]and it should
be almost near to 1 for better quality. The resul-tant value ofQ0between source and fused images for proposed scheme are shown in Table 1. It is observed from proposed schemes that the values of Q0 are almost close to 1, which represent the effectiveness of the proposed scheme.
6. The metricQW [9, 25] between source imagesX,Y
Table 1:Comparison of image fusion performance of proposed scheme against 6 existing schemes
Source Evaluation DWT DWT + PCA MSVD SWT CVT NSCT Proposed Images indices [13] [9] [14] [33] [30] [31] scheme
PSNR 36.0793 36.0791 35.3424 35.5148 35.5214 35.8210 36.5174 C.C. 0.9898 0.9898 0.9875 0.9805 0.9762 0.9889 0.9905 Pepper Mean 119.1555 119.1555 119.1555 119.1555 119.1562 119.1555 119.1655
S.D. 50.8323 50.8325 50.9791 50.9519 51.2063 51.3940 51.4211 MI 1.2101 1.1998 1.2768 1.3006 1.2920 1.3010 1.3018
Q0 0.6832 0.6925 0.6953 0.6128 0.6872 0.6957 0.6872 QW 0.8264 0.8098 0.8295 0.8716 0.8752 0.8836 0.8765 QE 0.6164 0.6112 0.6268 0.6241 0.6105 0.6254 0.6321 QAB/F 0.5347 0.5329 0.5630 0.5436 0.5421 0.5384 0.5437
PSNR 34.1621 34.1847 32.3791 34.8267 34.8694 34.8945 34.9193 C.C. 0.9887 0.9888 0.9822 0.9801 0.9877 0.9827 0.9902 Lena Mean 121.6091 121.6083 121.6090 121.6093 121.5089 121.6978 121.6094
S.D. 60.3515 60.3597 60.1866 60.5962 60.9821 60.7543 61.1822 MI 1.2458 1.2450 1.2416 1.2844 1.2759 1.2089 1.2271
Q0 0.8645 0.8598 0.8591 0.9331 0.9289 0.9367 0.9414 QW 0.7562 0.7512 0.7591 0.8767 0.8541 0.8793 0.8811 QE 0.6378 0.6351 0.6435 0.6421 0.6492 0.6487 0.6460 QAB/F 0.4362 0.4355 0.4731 0.4531 0.4803 0.4989 0.5613
PSNR 36.7513 36.8220 38.8281 37.7920 38.7982 38.8724 38.9818 C.C. 0.9847 0.9854 0.9871 0.9876 0.9758 0.9849 0.9882 Dataset1 Mean 227.6663 227.8712 227.6663 227.6663 227.5684 227.8259 227.6663
S.D. 45.8628 45.9310 46.3967 46.1644 46.5231 46.7903 46.8027 MI 1.4331 1.4068 1.4291 1.4319 1.4297 1.4367 1.4373
Q0 0.3543 0.3532 0.3734 0.3745 0.3758 0.3428 0.3797 QW 0.4353 0.4216 0.4437 0.4528 0.4376 0.4392 0.4439 QE 0.3201 0.3254 0.3633 0.3096 0.3257 0.3467 0.3581 QAB/F 0.5634 0.5207 0.5553 0.5126 0.5167 0.5948 0.6277
PSNR − − − − − − −
C.C. − − − − − − −
Mean 84.3786 84.3786 84.3786 84.3786 84.3773 84.4671 84.8658 S.D. 47.3890 47.3890 49.1255 48.8580 48.5708 49.7903 49.2007 Dataset2 MI 1.3965 1.3018 1.3520 1.3991 1.4071 1.4023 1.4080
Q0 0.3967 0.3807 0.3862 0.3831 0.3810 0.3806 0.3826 QW 0.4325 0.4336 0.4381 0.4310 0.4326 0.4374 0.4307 QE 0.3029 0.3031 0.3047 0.3051 0.3068 0.3073 0.3082 QAB/F 0.5528 0.5541 0.5520 0.5516 0.5529 0.5574 0.5519
PSNR 34.8460 34.8562 34.8844 35.7054 35.8325 35.9077 35.9116 C.C. 0.9931 0.9931 0.9930 0.9943 0.9758 0.9849 0.9914 TNO Mean 87.3152 87.3154 87.3153 87.3152 87.5621 87.5639 87.6153
S.D. 36.5409 36.5431 36.7410 36.7115 36.6742 36.7309 36.9588 MI 1.3295 1.3295 1.3479 1.3596 1.3498 1.3671 1.3450
Q0 0.8497 0.8497 0.8137 0.8276 0.8420 0.8437 0.8542 QW 0.9315 0.9315 0.9494 0.9559 0.9576 0.9792 0.9752 QE 0.5721 0.5692 0.5771 0.5748 0.5622 0.5767 0.5782 QAB/F 0.6856 0.6857 0.6803 0.7033 0.6841 0.6948 0.7313
PSNR 33.3781 33.8152 34.6210 34.5709 35.5421 35.5714 35.6509 C.C. 0.9973 0.9905 0.9898 0.9976 0.9922 0.9959 0.9982 Head Mean 126.8768 126.8727 127.3763 127.8391 127.8653 127.6759 127.8937
S.D. 73.6487 73.5140 73.5871 73.4594 73.5291 73.5933 73.6107 MI 1.4179 1.4140 1.4276 1.4273 1.4297 1.4266 1.4313
Q0 0.8437 0.8250 0.8374 0.8405 0.8354 0.8420 0.8531 QW 0.7187 0.7189 0.7270 0.7123 0.7296 0.7232 0.7203 QE 0.5520 0.5429 0.5593 0.5297 0.5487 0.5447 0.5481 QAB/F 0.7187 0.7172 0.7205 0.7124 0.7287 0.7248 0.7236
∗
For the dataset2 original images are not available to compare our results, it is indicated by0−0in Table 1.
Gautam and Kumar An Effective Image Fusion Technique based on Multiresolution Singular Value Decomposition 41
and fused imageIfis defined as:
QW(X, Y, If) =
X
wW
c(w)(λ(w)Q0(X, If|w) +
(1−λ(w))Q0(Y, If|w)) (13)
where,λ(w)is defined as:
λ(w) = σ
2 X
σ2 X+σY2
λ(w)denotes the relative salience ofXcompared toYin the same windowwandc(w)indicates the normalized salience of the windowC(w)which is defined as:
C(w) =max(σX2, σ2Y)
TheQW contains the salience of information into account. The range of QW is 0 to 1. One indi-cates the fused image retain all information from the source images. It is observed from Table 1 that the value ofQW between source and fused images are achieve almost close to 1.
7. The metricQE[22] is defined as follows:
QE(X, Y, If) =
QW(X, Y, If).QW(X0, Y0, If0) α
(14)
where,X0, Y0 andIf are the corresponding edge images ofX, Y, If, respectively. Parameterα re-flects the contribution of the edge images com-pared to the original images which is set to 1.QE retains visual and edge information. The larger value ofQEdenotes the better fusion result. Most of the result of proposed scheme provides better fusion result as shown in Table 1.
8. The metricQAB/F [25] measures the amount of edge information transferred from source images to the fused images.QAB/F is defined as:
QAB/F =
PN
n=1
PM
m=1(xx.wx+yy.wy)
PN
n=1
PM
m=1(wx+wy)
(15)
where xx = QXIf(n, m), yy = QY If(n, m), wx=wX(n, m)andwy=wY(n, m).
xxdenotes the edge strength and orientation val-ues andwxis the influence parameter ofxx. Sim-ilarly,yyis taken. n, mdenote the image location andN, Mare the size of images, respectively. The value ofQAB/F near to 1 denotes better quality. From Table 1, the proposed scheme gives value al-most close to 1.
5 Conclusions
In this paper, a fusion scheme based on multiresolution singular value decomposition and gradient based sharpness approach is proposed. The experimental results of proposed scheme are performed on several pairs of multifocus and multisensor images which demonstrate that the proposed scheme preserves more significant details, provides sharp details, rich texture and also improves the visual quality of the fused image than other fusion schemes. Apart from qualitative mea-surement the values of other quantitative meamea-surement metrics such as PSNR, correlation coefficients, mean, standard deviation, mutual information, Q0, QW, QE andQAB/F are also better in most of the cases. The proposed scheme can be used to fuse the multifocus and multisensor images. However, the proposed scheme is slightly more time consuming.
Acknowledgement
We are gratefully acknowledge the support by Dr. V.P.S. Naidu for providing us images of the dataset1 and dataset2 which are used in this paper.
References
[1] Hall, David L., Llinas, J. An introduction to mul-tisensor data fusion, Proc. IEEE, 85 (1), p.6-23, 1997.
[2] Mitianoudis, N., Stathaki, T. Pixel-based and region-based image fusion schemes using ICA bases, Inf. Fusion, 8 (2), p.131-42, 2007.
[3] M, Sasikala., N, Kumaravel. A comparative analy-sis of feature-based image fusion method, Inf. Tech. J., 6 (8), p.1224-1230, 2007.
[4] Tao, Q., Veldhuis, R. Threshold-optimized decision-level fusion and its application to bio-metrics, Pattern Recogn, 42 (5), p.823-836, 2009.
[5] Goshtasby, A.A., S, Niklov. Guest editorial: Image fusion: advances in the state of the art, Inf. Fusion, 8 (2), p.114-118, 2007.
[6] T, Pu., G, Ni. Contrast based image fusion using the discrete wavelet transform, Opt. Eng., 39 (8), p.2075-2082, 2000.
[7] Pajaes, G., Cruz, J. A wavelet-based image fusion tutorial, Pattern Recognition, 37 (9), p.1855-72, 2004.
[8] Senthil Kumar, S., Mahesh Bharath, K., Muttan, S. Implementation of Max principle with PCA in im-age fusion for surveillance and navigation applica-tion, Electron Lett Comput Vis Image Anal, 10 (1), p.1-10, 2011.
[9] Naidu, V.P.S., Raol, J.R. Pixel-level image fusion using wavelets and principle component analysis, Defence Science Journal, 58 (3), p.338-352, 2008.
[10] Koutsias, N., Karteris, M., Chuvieco, E. The use of intensity-Hue-Saturation transform of Landsat-5 mapper data for burned land mapping, Pho-togramm. Eng. Remote Sens., 66 (7), p.829-839, 2000.
[11] Z, Wang., D, Ziou., C, Armenakis., D, Li., Q, Li. A Comparative Analysis of Image Fusion Meth-ods, IEEE transactions on Geoscience and Remote Sensing, 43 (6), p.1391-1402, 2005.
[12] Chavez, P.S., Sides, S.C., Anderson, J.A. Compar-ison of three different methods to merge multires-olution and multispectral data: Landsat TM and SPOT panchromatic, Photogrammetric Engineer-ing and Remote SensEngineer-ing, 57 (3), p.295-303, 1991.
[13] H, Li., B.S., Manjunath., S.K., Mitra. Multisensor image fusion using the wavelet transform, Graph-ical Models and Image Processing, 57 (3), p.235-245, 1995.
[14] Naidu, V.P.S. Image fusion technique using multi-resolution singular value decomposition, Defence Sci. J., 61 (5), p.479-484, 2011.
[15] Kakarala, R., P.O., Ogunbona. Signal analysis us-ing a multiresolution form of the sus-ingular value de-composition, IEEE Trans. Image Process., 10 (5), p.724-735, 2001.
[16] Bhatnagar, G., Saha, A., Wu, Q.M.J., Atrey, P.K. Analysis and extension of multiresolution singu-lar value decomposition, Inf. Sciences, 277, p.247-262, 2014.
[17] Golub, G.H., Reinsch, C. Singular value decom-position and least squares solutions, Numer. Math, 14 (5), p.403-420, 1970 .
[18] Zhao, X., Ye, B., Chen, T. Theory of multi-resolution singular value decomposition and its ap-plication to signal processing and fault diagnosis, J. Mech.Eng. 46 (20), p.64-75, 2010.
[19] Gonzalez, R.C., Woods, R.E. Digital Image Pro-cessing, third edition, Pearson Education, 2013.
[20] Yang, Y., Huang, S., Gao, J., Qian, Z. Multi-focus image fusion using an effective discrete wavelet transform based algorithm, Measurement science review, 14 (2), p.102-108, 2014.
[21] Yang, Y. A novel DWT based multi-focus image fusion method, Procedia Eng., 24, p.177-181, 2011.
[22] Li, Shutao., Yang, Bin., Hu, Jianwen. Perfor-mance comparison of different multi-resolution transforms for image fusion, Inf. Fusion, 12 (2), p.74-84, 2011.
[23] Wang, Zhaobin., Ma, Yide., Gu, Jason. Multi-focus image fusion using PCNN, Pattern Recogn, 43 (6), p.2003-2016, 2010.
[24] Yang, Bin., Li, Shutao. Multifocus Image Fusion and Restoration With Sparse Representation, IEEE Trans. on Instrumentation and Measurement, 59 (4), p.884-892, 2010.
[25] Yang, Bin., Li, Shutao. Pixel-level image fu-sion with simultaneous orthogonal matching pur-suit, Inf. Fusion, 13 (1), p.10-19, 2012.
[26] Yang, Shuyuan., Wang, Min., Jiao, Licheng. Im-age fusion based on a new contourlet packet, Inf. Fusion, 11 (2), p.78-84, 2010.
[27] Tian, Jing., Chen, Li., Ma, Lihong. Multi-focus image fusion using a bilateral gradient-based sharp-ness criterion, Opt. Comm., 284 (1), p.80-87, 2011.
[28] Pohl, C., Van Genderen, JL. Multisensor image fusion in remote sensing: concepts, methods and applications, International Journal of Remote Sens-ing, 19 (5), p.823-854, 1998.
[29] Nunez, J., Otazu, X., Fors, O. Multiresolution-based image fusion with additive wavelet decom-position, IEEE Trans. on Geoscience and Remote Sensing, 37 (3), p.1204-1211, 1999.
[30] Ali, F.E., Dokany, I.M., Saad, A.A., Abd El-Samie, F.E. A curvelet transform approach for the fusion of MR and CT images, Journal of Mod-ern Optics, Taylor and Francis. 57 (4), p.273-286, 2010.
[31] Zang, Q., Guo, B.L. Multifocus image fusion us-ing the nonsubsampled contourlet transform, Sig-nal Processing, 89, p.1334-1346, 2009.
[32] Wang, Z., Bovik, A.C. A universal Image Quality Index, IEEE Signal Process. Lett. 9 (3), p.81-84, 2002.
Gautam and Kumar An Effective Image Fusion Technique based on Multiresolution Singular Value Decomposition 43
[33] Huafeng, Li., Shanbi, W., Chai, Yi. Multifocus image fusion scheme based on feature contrast in the lifting stationary wavelet domain, EURASIP Journal on Advances in Signal Processing. 39, p.1-16, 2012.
[34] Bhatnagar, G., Raman B. A new image fusion technique based on directive contrast, Electronic letters on computer vision and image analysis, 8 (2), p.18-38, 2009.