SIMULATIONS OF THE INFLUENCE OF CHANGES IN WASTE COMPOSITION
ON THEIR ENERGETIC PROPERTIES
Halina Marczak1
1 Mechanical Engineering Faculty, Lublin Technology University, Nadbystrzycka 36, 20-618 Lublin, Poland, e-mail: [email protected]
INTRODUCTION
The regulations implemented in the area of municipal waste management are aimed at in-creasing their economic use, and in the case of disposing waste in a landfill, at minimizing their impact on the environment.
It is a legal requirement that municipalities take action to increase the level of recycling and reprocessing of raw fraction of municipal waste by the end of 2020: paper, plastic, glass and met-als by a minimum of 50% by weight [Resolu-tion… Dz. U. 2013]. In fulfilling this obligation a special role is attributed to selective collection of recyclable waste fractions, while mechanical and biological processing plants (MBP) of mixed waste may only be a supplementary solution.
The laws also oblige for use in waste man-agement solutions that reduce to an acceptable minimum fraction of organic biodegradable mu-nicipal waste disposed of by landfill. To achieve the quantitative requirements in this area may be helpful in backyard composting method of or-ganic waste and the existing and built installations for composting or fermentation of biodegradable waste installations MBP preparing mixed munici-Volume 15, No. 4, Oct. 2014, pages 90–97
DOI: 10.12911/22998993.1125462 Research Article
ABSTRACT
The objective to obtain the recommended (at least 50% by weight) level of recycled and reprocessed raw fractions of municipal waste in the perspective of 2020 might in turn contribute to the deterioration of the fuel properties of waste stream that is intended for incineration. In order to avoid oversizing heat recovery plants their con -struction should be based on well-defined properties of the waste fuel. The author carried out simulation calculations of the impact of changes in the composition of municipal waste on their energetic properties. The calculations of the calorific value of the waste fraction (so called combustible fraction) with the potential to be used as an alternative fuel were done.
Keywords: waste management, municipal waste, recycling, calorific value of waste. Received: 2014.07.07
Accepted: 2014.08.05 Published: 2014.10.07
pal waste to the processing and biochemical plants thermal treatment of mixed municipal waste.
Designing the installations of thermal treat-ment of waste, such parameters as the amount and characteristics of waste fuel are taken into ac-count. In particular, the characteristics of waste fuel determine the authothermicity of thermal treatment process of waste and the cost of func-tioning the installations. Waste fuel properties de-termine the justifiability of subjecting them to a process of thermal treatment. Reducing the share of plastic and paper waste stream may affect the deterioration of calorific value of waste.
The change of morphological composition of combustible fraction of mixed municipal waste may also affect the calorific value of the alterna-tive fuel produced from waste. For example, a reduction of plastic fraction in the waste stream will contribute to lowering the fuel properties of the waste.
91
treatment processes. This applies in particular tothe existing plants and the construction of waste thermal treatment, as complying with the afore-mentioned legal requirement may worsen fuel properties of the waste stream intended for in-cineration.
The work contained calculations to illustrate the effect of reducing the share of paper and plas-tic waste stream on the properties of energy waste intended for incineration. The calculation results indicate that it may be necessary to take action to increase the calorific value of the waste directed to the combustion process. Waste fuel properties can be corrected by adding fuels to them, e.g. fu-els formed, but keep in mind the adverse impact of such actions on the financial results of compa -nies waste incineration.
GENERAL ASSUMPTIONS OF WASTE
MANAGEMENT IN LUBELSKIE
VOIVODESHIP
Currently, the system of municipal waste management in Lubelskie Voivodeship includes selective waste collection, waste treatment in order to prepare them for reuse or safe storage and disposal of unprocessed waste in a landfill. Waste processing is carried out in the so-called segregation installations, so called dry waste frac-tion in installafrac-tions for mechanical treatment of mixed waste in composting anaerobic facilities for waste treatment. In some installations, me-chanical treatment of mixed municipal waste is focused on the production of alternative fuel with simultaneous production of the organic fraction directed to composting. To increase the level of waste recovery, works aimed at the expansion of existing and construction of new installations for this type of waste are carried out. Moreover, in the municipality of Lublin there are plans to build an incineration plant and the construction of MBP [Szyszkowski et al. 2012], which according to the assumptions, will play an important role, along-side selective collection, in fulfilling the obliga -tion to obtain level of recycling and prepara-tion for reusing paper, cardboard, plastics, glass and metals by at least 50% by weight by the end of 2020. To fulfil this obligation, it is equally nec -essary to implement efficient sorting installa -tions for separately collected waste frac-tions to ensure the acquisition of high quality, mainly for recycling and to run the installations which will
implement the recycling processes. It is believed that the MBP installations for mixed waste will be of limited importance in achieving the required level of recycling and preparation for reusing such material fractions, such as paper, glass, plas-tics and metals. The materials separated in the re-cycling systems are inferior in quality, compared to the collected selectively. Consequently, there can be problems in their disposal or recycling due to higher costs as a result of having to undergo an additional treatment such as cleaning. In turn, MBP plants may be important in the production of alternative fuel from waste, currently used in the cement industry. The technological process of the production of alternative fuels from waste should ensure that you obtain the fuel quality pa-rameters which meet customers’ requirements. An important parameter is the calorific value of waste, which should be about 20 MJ/kg for ap-plications in the cement industry.
The increase in the selective collection of pa-per and plastic factions “at source” will reduce the amount of other types of waste, and this in turn can help to reduce the calorific value of the waste [Skowron 2006]. In order to avoid oversiz -ing heat recovery plants, they should be based on well-defined properties of the waste.
Limiting the share of combustible components, plastics in particular, may reduce the calorific value of the fuel. In this regard, paper and cardboard are less significant, as in comparison to plastics they are less calories and more hygroscopic.
When selecting waste treatment techniques and technologies, in addition to the composition and properties of the waste one should consider, the purpose of the processing, the requirements of entrepreneurs involved in recovering the materi-als obtained in the treatment processes, the eco-nomics of the solutions and legal requirements [Marczak 2013].
Based on the data on the amount of municipal waste in Lubelskie Voivodeship, the calculations of the impact of changes in the composition of waste on their energetic properties was made.
EXPERIMENTAL PART
Characteristics of the material337 kg per capita per year (kg/M/year) for the ar -eas of large cities (more than 50 thousand inhab-itants), 333 kg/M/year for small cities (up to 50 thousand residents) and 181 kg/M/year for rural areas. The values of total waste generation and different material fractions were adopted from the document „Plan gospodarki odpadami dla województwa lubelskiego 2017” [Szyszkowski et al. 2012].
The estimated share of paper and cardboard in the stream of the generated waste mass was ap-prox. 11%, while the plastic was apap-prox. 12.2% (Figure 1). Municipal waste collected (including the gathered waste) in Lubelskie Voivodeship in 2012, accounted for approximately 346600
Mg [CSO 2013]. Table 2 shows the data on the amount of municipal waste collected in 2012 [CSO 2013].
Based on the data contained in Tables 1 and 2, the amount of waste taken into account in fur-ther analysis was estimated. It was determined by subtracting the weight of separately collected waste from the mass of waste generated in 2012, the quantities of waste analysed are presented in Table 3. For ease of calculations the waste was divided into four groups. Group I includes paper, cardboard, glass, metals, plastics, mineral waste, textiles, wood, multi-material waste, hazardous waste, other waste categories. Group II is kitchen wastes. Group III is a waste of grain size <10 mm, Table 1. Municipal waste generated in Lubelskie Voivodeship in 2012 (own calculations in the basis of [Szysz
-kowski et al. 2012])
Waste fraction
Waste generation index [kg/M/year] Amount of waste [Mg] Cities above
50 000 Cities below50 000 Rural areas Cities above50 000 Cities below50 000 areasRural [Mg]Total [%]
Paper and cardboard 64 32 9 34 374 15 117 10 642 60 133 11
Glass 33 34 18 17 780 15 896 21 128 54 804 10
Metal 9 5 4 4742 2338 5104 12 183 2.2
Plastics 51 37 19 27 432 17 299 21 969 66 699 12.2
Multi-material waste 8 13 8 4403 6234 8726 19 363 3.5
Kitchen and garden waste 95 121 60 51 137 56 416 69 500 177 053 32.4
Mineral waste 10 10 11 5588 4519 13 302 23 409 4.3
Fraction < 10 mm 14 23 31 7281 10 597 35 489 53 368 9.8
Textiles 8 14 4 4064 6390 4546 14 999 2.7
Wood 1 1 1 508 468 1397 2372 0.4
Hazardous waste 3 2 2 1355 1091 1742 4188 0.8
Other categories 11 15 9 5926 7169 10 530 23 625 4.3
Bulky waste 9 9 2 4742 4052 2716 11 509 2.1
Green waste 22 18 3 11 706 8260 3250 23 215 4.2
Total 337 333 181 181 036 155 844 210 040 546 921 100
Number of inhabitants (according to Central
Statistical Office - Lublin) 537 200 468 000 1 160 444
Figure 1. Estimated share of waste fractions in the stream of the generated waste mass
93
while the fourth group is bulky waste and greenwaste. The masses of individual plastics fractions were determined following Jaglarz [2014] that in the municipal waste stream the share of PE is 27%, PP 6%, and the proportion of PS and PET are 10% and 57%, respectively.
Table 3 shows the moisture content, combus -tible and non-combus-tible components in speci-fied fractions. The values of these parameters for waste classified as group IV (including bulky
waste and green waste) were not included. This group of waste was not considered in the calcula-tion of the calorific value, since it was assumed that green waste is directed to a biochemical conver-sion (composting process), while the bulky waste is treated in order to recover recyclable materials which are then passed on to authorized recipients.
Multi-material waste include, among others, packaging and non-packaging composites. For these wastes approximated values of moisture Table 2. Amount of waste in Lubelskie Voivodeship in 2012
No Item Collected waste [Mg] Share [%]
1. Municipal waste (segregated and selectively collected):
1.1 paper and cardboard 6063.60 1.75
1.2 glass 11693 3.37
1.3 textiles 1947.20 0.56
1.4 hazardous 53.8 0.02
1.5 plastics 5331.50 1.54
1.6 metal 714.90 0.21
1.7 electronic and electric appliances 1395.2 0.40
2. Waste from parks and gardens:
2.1 biodegradable 7357.7 2.12
3. Other municipal waste:
3.1 mixed 310 545.87 89.60
3.2 bulky waste 1474.5 0.43
4. Total collected waste 346 577.27 100
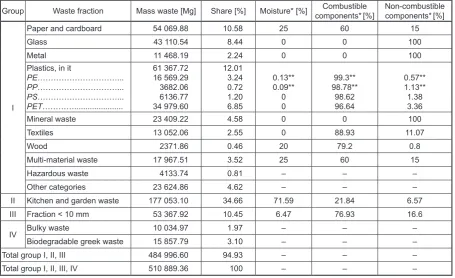
Table 3. Amounts, composition and characteristics of analysed waste
Group Waste fraction Mass waste [Mg] Share [%] Moisture* [%] components*Combustible [%] Non-combustible components*[%]
I
Paper and cardboard 54 069.88 10.58 25 60 15
Glass 43 110.54 8.44 0 0 100
Metal 11 468.19 2.24 0 0 100
Plastics, in it
PE………...
PP………...
PS………...
PET…………...
61 367.72 16 569.29 3682.06 6136.77 34 979.60
12.01 3.24 0.72 1.20 6.85
0.13** 0.09**
0 0
99.3** 98.78**
98.62 96.64
0.57** 1.13** 1.38 3.36
Mineral waste 23 409.22 4.58 0 0 100
Textiles 13 052.06 2.55 0 88.93 11.07
Wood 2371.86 0.46 20 79.2 0.8
Multi-material waste 17 967.51 3.52 25 60 15
Hazardous waste 4133.74 0.81 – – –
Other categories 23 624.86 4.62 – – –
II Kitchen and garden waste 177 053.10 34.66 71.59 21.84 6.57
III Fraction < 10 mm 53 367.92 10.45 6.47 76.93 16.6
IV Bulky waste 10 034.97 1.97 – – –
Biodegradable greek waste 15 857.79 3.10 – – –
Total group I, II, III 484 996.60 94.93 – – –
Total group I, II, III, IV 510 889.36 100 – – –
94
content, combustible and non-combustible com-ponents were adopted, as for paper and cardboard. Due to lack of data, Table 3 does not indicate the characteristics of hazardous waste and fractions: other categories of waste.
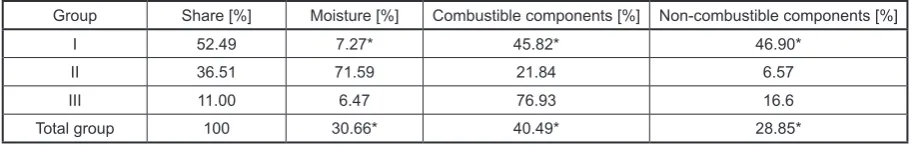
Table 4 shows the characteristics of the three groups of waste which are included in the calculations of the calorific value. Moisture content of combus -tible and non-combus-tible components of the waste in Group I were calculated as weighted averages of the values of these parameters given in Table 3.
Calculations of calorific values of the stream of mixed municipal waste
There is a relationship between calorific value
Qi and the heat of combustion Qs:
Qi = Qs – r(Wr +8.94Hr), kJ/kg (1)
where: r – heat of water evaporation; r = 2442 kJ/kg
Wr, Hr – accordingly the content (mass) of
moisture and hydrogen in the waste in the operational state, expressed as a decimal fraction (8.94 is the conversion rate of hy -drogen to water).
Heat of combustion was determined with Du-long’s formula [Chudzinski et al. 1974]:
where: r –heat of water evaporation; r = 2442 kJ/kg
Wr, Hr - accordingly the content (mass) of moisture and hydrogen in the waste in the operational state, expressed as a decimal fraction (8.94 is the conversion rate of hydrogen to water).
Heat of combustion was determined with Dulong’s formula [Chudzinski et al. 1974]:
H O
kJ kgC
Q r r r
s 32800 120040 8 , / (2)
where Cr, Hr, Or - respectively the content (mass fraction) of carbon, hydrogen, oxygen in the waste in the operational state, expressed as a decimal fraction.
To convert the contents of individual elements in the waste from the dry to the operating status the following relationship was used:
100 r
/100s
r P W
P (3)
where: Pr - the content of carbon, hydrogen, oxygen in the waste in the operational state, % Ps - the content of carbon, hydrogen, oxygen in the waste in the operational state, % Wr– moisture content in waste, %.
The content of carbon, hydrogen, oxygen in the dry mass of the waste was estimated using the following formula:
n i i s i s P u P1
(4)
where: Pis - the content of carbon, hydrogen, oxygen and in different material fractions i ui - shares of individual material fractions in the total mass of waste
n – the number of material fractions.
Based on the chemical formulas of the fractions, the content of carbon, hydrogen and oxygen were estimated (Table 5). For textiles a simplifying assumption was taken that they are composed of polyester, and the fraction of <10 mm was described in the chemical formula (C6H10O5)n.
Table 5. Content of carbon (Cs), hydrogen (Hs) and oxygen (Os) in the fractions of waste in the dry state
Waste fraction Chemical formula Cis His Ois Paper and
cardboard (C6H10O5)n 0.444 0.062 0.494 PE (C2H4)n 0.857 0.143 0 PP (C3H6)n 0.857 0.143 0
(2) where: Cr, Hr, Or – respectively the content (mass
fraction) of carbon, hydrogen, oxygen in the waste in the operational state, ex-pressed as a decimal fraction.
To convert the contents of individual ele -ments in the waste from the dry to the operating status the following relationship was used:
(
100
r)
/
100
sr
P
W
P
=
−
(3)where: Pr – the content of carbon, hydrogen,
oxy-gen in the waste in the operational state, %
Ps – the content of carbon, hydrogen,
oxy-gen in the waste in the operational state, %
Wr – moisture content in waste, %.
The content of carbon, hydrogen, oxygen in the dry mass of the waste was estimated using the following formula:
∑
==
n i i s is
P
u
P
1
(4)
where: Pis – the content of carbon, hydrogen,
ox-ygen and in different material fractions i,
ui – shares of individual material fractions in the total mass of waste,
n – the number of material fractions. Based on the chemical formulas of the frac-tions, the content of carbon, hydrogen and oxygen were estimated (Table 5). For textiles a simplify-ing assumption was taken that they are composed of polyester, and the fraction of <10 mm was de-scribed in the chemical formula (C6H10O5)n. Table 6 shows the shares of carbon, hydrogen and oxy-gen throughout the waste in the dry state and the operational state calculated according to the equa-tion (3) and (4) taking into account the data given in Table 5. The calculated heat of combustion is:
Textiles (C2O3R)n 0.333 0 0.667
Wood (C6H10O5)n 0.444 0.062 0.494
Multi-material
waste (C6H10O5)n 0.444 0.062 0.494
Kitchen and garden
waste (C6H10O5)n 0.444 0.062 0.494
Fraction < 10 mm (C6H10O5)n 0.444 0.062 0.494
Table 6 shows the shares of carbon, hydrogen and oxygen throughout the waste in the dry state and the operational state calculated according to the equation (3) and (4) taking into account the data given in Table 5.
Table 6. The share of carbon, hydrogen and oxygen in the waste
Chemical element
Share
Dry state Operational state
C 0.381 0.245
H 0.049 0.030
O 0.352 0.201
The calculated heat of combustion is:
kJ kgQs 328000.245120040 0.0300.2018 8621.2 /
The calorific value of the waste with calculated moisture 30.66% (Table 4) is:
kJ kgQi 8147.724420.30668.940.03 7217.5 /
The amount of obtainable heat energy Et from waste can be determined from the relationship:
i
t M uQ
E (5)
where: M– waste mass
η - efficiency of electricity production in cogeneration
u - share of thermal energy in total energy production in cogeneration.
The projected amount of thermal energy that may be acquired from the waste stream with a mass of 484997 Mg/year (Table 3) and the calorific value of 7217.5 kJ/kg and assuming
η= 85% and u = 75% is 2231.5 TJ/year.
Simulation calculations of calorific value of waste with consideration to legal requirements
For visualizing the effect of reduced share of the following fractions in waste: paper and cardboard, metal, glass, plastic, on the calorific value, the calculations (variant 2)
= 8621.2 kJ/kg
The calorific value of the waste with calcu -lated moisture 30.66% (Table 4) is:
Textiles (C2O3R)n 0.333 0 0.667
Wood (C6H10O5)n 0.444 0.062 0.494
Multi-material
waste (C6H10O5)n 0.444 0.062 0.494
Kitchen and garden
waste (C6H10O5)n 0.444 0.062 0.494
Fraction < 10 mm (C6H10O5)n 0.444 0.062 0.494
Table 6 shows the shares of carbon, hydrogen and oxygen throughout the waste in the dry state and the operational state calculated according to the equation (3) and (4) taking into account the data given in Table 5.
Table 6. The share of carbon, hydrogen and oxygen in the waste
Chemical element
Share
Dry state Operational state
C 0.381 0.245
H 0.049 0.030
O 0.352 0.201
The calculated heat of combustion is:
kJ kgQs 328000.245120040 0.0300.2018 8621.2 /
The calorific value of the waste with calculated moisture 30.66% (Table 4) is:
kJ kgQi 8147.724420.30668.940.03 7217.5 /
The amount of obtainable heat energy Et from waste can be determined from the relationship:
i
t M uQ
E (5)
where: M– waste mass
η - efficiency of electricity production in cogeneration
u - share of thermal energy in total energy production in cogeneration.
The projected amount of thermal energy that may be acquired from the waste stream with a mass of 484997 Mg/year (Table 3) and the calorific value of 7217.5 kJ/kg and assuming
η= 85% and u = 75% is 2231.5 TJ/year.
Simulation calculations of calorific value of waste with consideration to legal requirements
For visualizing the effect of reduced share of the following fractions in waste: paper and cardboard, metal, glass, plastic, on the calorific value, the calculations (variant 2)
= 7217.5 kJ/kg
The amount of obtainable heat energy Et from waste can be determined from the relationship:
Textiles (C2O3R)n 0.333 0 0.667
Wood (C6H10O5)n 0.444 0.062 0.494
Multi-material
waste (C6H10O5)n 0.444 0.062 0.494
Kitchen and garden
waste (C6H10O5)n 0.444 0.062 0.494
Fraction < 10 mm (C6H10O5)n 0.444 0.062 0.494
Table 6 shows the shares of carbon, hydrogen and oxygen throughout the waste in the dry state and the operational state calculated according to the equation (3) and (4) taking into account the data given in Table 5.
Table 6. The share of carbon, hydrogen and oxygen in the waste
Chemical element
Share
Dry state Operational state
C 0.381 0.245
H 0.049 0.030
O 0.352 0.201
The calculated heat of combustion is:
kJ kgQs 328000.245120040 0.0300.2018 8621.2 /
The calorific value of the waste with calculated moisture 30.66% (Table 4) is:
kJ kgQi 8147.724420.30668.940.03 7217.5 /
The amount of obtainable heat energy Et from waste can be determined from the relationship:
i
t M uQ
E (5)
where: M– waste mass
η - efficiency of electricity production in cogeneration
u - share of thermal energy in total energy production in cogeneration.
The projected amount of thermal energy that may be acquired from the waste stream with a mass of 484997 Mg/year (Table 3) and the calorific value of 7217.5 kJ/kg and assuming
η = 85% and u = 75% is 2231.5 TJ/year.
Simulation calculations of calorific value of waste with consideration to legal requirements
For visualizing the effect of reduced share of the following fractions in waste: paper and cardboard, metal, glass, plastic, on the calorific value, the calculations (variant 2)
(5) where: M – waste mass,
η – efficiency of electricity production in cogeneration,
u – share of thermal energy in total energy production in cogeneration.
The projected amount of thermal energy that may be acquired from the waste stream with a mass of 484997 Mg/year (Table 3) and the calo -rific value of 7217.5 kJ/kg and assuming η= 85% and u = 75% is 2231.5 TJ/year.
Group Share [%] Moisture [%] Combustible components [%] Non-combustible components [%]
I 52.49 7.27* 45.82* 46.90*
II 36.51 71.59 21.84 6.57
III 11.00 6.47 76.93 16.6
Total group 100 30.66* 40.49* 28.85*
* – Weighted average.
95
Simulation calculations of calorific valueof waste with consideration to legal requirements
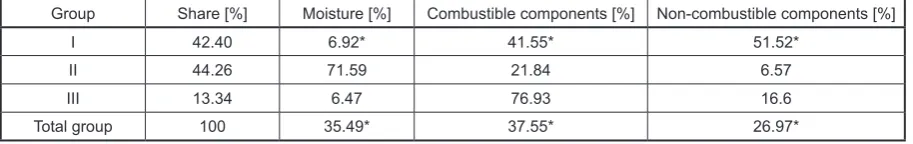
For visualizing the effect of reduced share of the following fractions in waste: paper and card-board, metal, glass, plastic, on the calorific value, the calculations (variant 2) assuming that 50% of each of these fractions is removed from the waste. Consequently, (compared to the previous calcula-tion) the mass of these fractions in waste destined for processing will be reduced by half. Moisture content of combustible and non-combustible components of waste mass (after removal of the four waste fractions) are summarized in Table 7.
The shares of carbon, hydrogen and oxygen in the waste in the dry state and the actual state (operating) are given in Table 8.
The calorific value of the waste with moisture of 35.49% (Table 7), estimated from equation (1) is: Qi = 5874.34 kJ/kg. To ensure autothermic
-Table 5. Content of carbon (Cs), hydrogen (Hs) and oxygen (Os) in the fractions of waste in the dry state
Waste fraction Chemical formula Cis His Ois
Paper and cardboard (C6H10O5)n 0.444 0.062 0.494
PE (C2H4)n 0.857 0.143 0
PP (C3H6)n 0.857 0.143 0
PS (C8H8)n 0.923 0.077 0
PET (C10H8O4)n 0.625 0.042 0.333
Textiles (C2O3R)n 0.333 0 0.667
Wood (C6H10O5)n 0.444 0.062 0.494
Multi-material waste (C6H10O5)n 0.444 0.062 0.494
Kitchen and garden waste (C6H10O5)n 0.444 0.062 0.494
Fraction < 10 mm (C6H10O5)n 0.444 0.062 0.494
Table 6. The share of carbon, hydrogen and oxygen in the waste
Chemical element
Share
dry state operational state
C 0.381 0.245
H 0.049 0.030
O 0.352 0.201
Table 7. Characteristics of waste for the second variant of calculations
Group Share [%] Moisture [%] Combustible components [%] Non-combustible components [%]
I 42.40 6.92* 41.55* 51.52*
II 44.26 71.59 21.84 6.57
III 13.34 6.47 76.93 16.6
Total group 100 35.49* 37.55* 26.97*
* – Weighted average.
Table 8. The share of carbon, hydrogen and oxygen in the waste calculations for the second variant
Chemical element
Share
dry state operational state
C 0.376 0.218
H 0.049 0.027
O 0.379 0.204
ity of waste combustion with the above calorific values it will be necessary to improve the energy characteristics of waste. Improved characteristics of waste fuel can be obtained by adding external fuel e.g. alternative fuel. Such an action will in-crease the operating costs of waste incineration plants. The results for two variants are presented in Table 9.
vari-Table 9. The results of calculations
Item 2012 the amount Reducing of materials by 50% Amount of recyclable
waste [Mg/year] 484 997 399 988 Paper and cardboard
[Mg/year] 54 069.88 27 034.94 Glass [Mg/year] 43 110.54 21 555.27 Metal [Mg/year] 11 468.19 5734.10 Plastics [Mg/year] 61 367.72 30 683.86
Moisture [%] 30.66 35.49
Combustible components
[%] 40.49 37.55
Non-combustible
components [%] 28.85 26.97
Calorific value [MJ/kg] 7.217 5.874 Heat energy from waste
combustion [TJ/year] 2231.5 1497.9
ant, the calculation assumes that the waste from group II and group III (Table 3) are separated in a mechanical process. The combustible fraction will be constituted from mechanically separated waste classified as Group I: paper and cardboard, plastics, textiles, wood, multi-material packaging waste. The combustible mass fraction was deter-mined by subtracting the mass of glass, metal, hazardous waste, mineral waste and fractions waste: other categories of waste from the mass of the I group waste groups in the second vari-ant. The results of calculations are given in Table 10. The estimated calorific value of combustible waste fraction is 14747.74 kJ/kg.
SUMMARY
The amendment to the Polish law in the area of municipal waste management requires increas-ing the level of recyclincreas-ing and reprocessincreas-ing waste useable fractions. The fulfilment of legal require -ments will affect the properties of mixed waste to be processed.
In the case of Lubelskie Voivodeship seg-regation of 50% of the waste feedstock, i.e. 17.52% of waste (included in the categories I – III; Table 3) generated in 2012 will reduce the stream of waste for thermal treatment, which should be taken into account in the design of the intended incineration plant.
The decrease of each fraction by 50% of weight will lower the calorific value of the waste from 7.217 MJ/kg to 5.874 MJ/kg. As a conse
-quence, the amount of energy obtainable from the incineration of waste will reduce, which may af-fect the profitability of the planned project – the construction of a waste incineration plant.
To ensure autothermicity of the incineration process it will probably be necessary to use addi-tional fuel – formed fuel or fossil fuels. Such actions will have an adverse impact on economic profitabil -ity of the waste incineration plant. This may affect the price of collecting waste to such installations.
An alternative to incineration of the mixed waste combustion processing is the mechani-cal-biological treatment. The calculated calo-rific value of the combustible fraction of the waste obtained after eliminating 50% of frac-tions is 14.747 MJ/kg. Alternative fuel from the combustible fraction of waste is currently used in the cement industry, and its further use in the en-ergy sector is now debated.
REFERENCES
1. Central Statistical Office. Environment 2013. Mu
-nicipal waste in 2012. ZWS Warszawa.
2. Chudzinski J. et al. 1974. Poradnik termoener
-getyka. Praca zbiorowa – 2nd edition, revised and
updated. WNT Warszawa.
3. Czop M. 2013. Badania podstawowych właściwo
-ści paliwowych odpadów poliolefinowych. Archi
-wum Gospodarki Odpadami i Ochrony Środowi
-ska, 15(3), 71–80.
4. Jaglarz G. 2014. Symulacja zmian parametrów energetycznych odpadów komunalnych w wyniku
Table 10. Summary of the results of calculations of
the calorific value of the combustible fraction of waste
Item Value
Stream of waste mass to be processed
in MBP installation [Mg/year] 399 988
Combustible fraction
Amount in the stream of waste [Mg/year] 91 110.23 Share in mass of waste to be processed [%] 22.78
Moisture [%] 12.88
Combustible components [%] 77.34 Non-combustible components [%] 9.78
C [%] Dry state 0.525
Operational state 0.467
H [%] Dry state 0.058
Operational state 0.05
O [%] Dry state 0.416
Operational state 0.352
97
budowy systemu gospodarki odpadami w nowychramach prawnych. Archiwum Gospodarki
Odpa-dami i Ochrony Srodowiska, 16, 11–20.
5. Marczak H. 2013. Ecological and economically opti -mal management of waste from healthcare facilities.
Journal of Ecological Engineering 14(2), 43–48.
6. Resolution of the Polish Parliament Chairman of
13 September 2013 on unified version of the Bill on cleanness in municipalities Dz.U. 2013 nr 0 poz. 1399.
7. Skowron H. 2006. Optymalne rozwiązania w dzie
-dzinie termicznego przekształcania odpadów ko -munalnych. Katowice; www.ietu.katowice/aktual/
Debata_spoleczna/ prezentacje/Termiczne_prze
-ksztalcanie_odpadow_optymalne_rozwiązania.pdf 8. Szyszkowski P., Kobiela K., Moczulski M. at al. 2012. Plan gospodarki odpadami dla wojewódz
-twa lubelskiego 2017. Załącznik do uchwały nr XXIV/396/2012 Sejmiku Województwa Lubel