DR. JATINDERKUMAR R. SAINI1 DR. APURVA A. DESAI2
1
Narmada College of Computer Application, Bharuch, Gujarat, India.
2
Department of Computer Science, Veer Narmad South Gujarat University,
Surat, Gujarat, India. [email protected]
Abstract. Email has become an important means of electronic communication but the viability of its usage is marred by Un-solicited Bulk Email (UBE) messages. UBE poses technical and socio-economic challenges to usage of emails. Besides, the definition and understanding of UBE differs from one person to another. To meet these challenges and combat this menace, we need to understand UBE. Towards this end, this paper proposes a classifier for UBE documents. Technically, this is an application of un-structured document classification using text content analysis and we approach it using supervised machine learning technique. Our experiments show the success rate of proposed classifier is 98.50%. This is the first formal attempt to provide a novel tool for UBE classification and the empirical results show that the tool is strong enough to be implemented in real world.
Keywords:Unsolicited Bulk Email (UBE), Unstructured Document, Tokenization, Vector Space Document Model (VSDM), Feature Extraction, Supervised Machine Learning
(Received December 29, 2009 / Accepted September 15, 2010)
1 Introduction
With the increase in usage and availability of Internet, there has been a tremendous increase in usage of e-mail. It has proved to be an important medium of cheap and fast electronic communication. But the same thing that has increased its popularity as a communication medium has also proved to be a source of non-personal, non-time critical, multiple, similar and un-solicited messages received in bulk. This type of message is called Unsolicited Bulk Email (UBE) and is known by various other names like Spam Email, Junk Email and Unsolicited Commercial Email (UCE). The spread of UBE has posed not only technical problems but has also posed major socio-economic threats. Also, the definition of spam email is ‘relative’ [5, 9, 12]. This
means to say that all emails going to spam folder may not be spam for a person – same as all emails going to inbox may not be ham emails. The present work aims to introduce a ‘spam email classification system’ to solve this kind of problem. Further, all spam email is not harmful, some is just annoying [2, 7, 10]. Some like ‘get-rich-quick’ email is very harmful to innocent persons who may get engulfed in the network of greedy people. UBE incidences range from fake job offers and fake medicines to pornography.
[15] and in this paper we target content-based classification of un-structured UBE documents. The basic structure of spam email message is same as of ham email, consisting of ‘header’ and ‘body’ parts. In this paper, we have treated spam email as un-structured because in addition to consideration of contents of structured ‘header’ part, we propose content analysis of ‘body’ part also. The structure of ‘body’ part is not fixed with respect to number of words, lines, format, etc. and hence we treat UBE as an un-structured document. From a technical perspective UBE classification is a document classification task and we propose to solve it using supervised machine learning approach.
Our aim of proposing UBE classifier is to provide UBE categories, UBE classification and treat each category of UBE individually, instead of treating the entire collection of spam emails, as a single unit. This is to say that instead of choosing ‘Delete All Spam on
Arrival’ it is desirable to let user say ‘Delete X Category of Spam on Arrival’, so that important email (according to importance criteria decided by this user) is not deleted. Moving on this line, we can prevent children from specifically the Pornographic spam, sick people from fake medicines, job-seekers specifically from fraudulent jobs and so forth.
2 Related literature survey
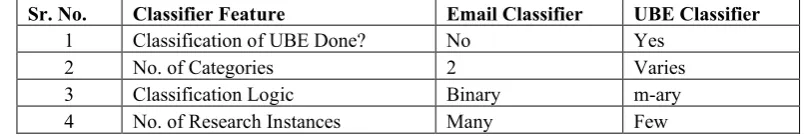
As far as, our study of past and contemporary literature for this field is concerned, this is the first formal attempt to develop an algorithm for a system that is trained to provide a classification of UBE. The survey of related work shows that the researchers have made many attempts to classify emails into ham and spam groups but the number of attempts targeted towards classification of spam emails is very scarce, per se. The main differences between these two classifications are summarized in Table 1.
Sr. No. Classifier Feature Email Classifier UBE Classifier
1 Classification of UBE Done? No Yes
2 No. of Categories 2 Varies
3 Classification Logic Binary m-ary
4 No. of Research Instances Many Few
Table 1Differentiation of Email and UBE Classifiers For our work, we selected 36 instances of research
works of UBE classifications from literature. The analysis of these works provided us with a list of 252 UBE categories, for all analyzed works. Removal of duplicated entries from this list yielded 187 unique categories of UBE. Based on the analytic review of these past research works, we derived the various points as discussed here forth.
Descriptive, dedicated and formal classification of UBE does not exist in past works. For many research works, even the important categories of UBE are not included in the classification list. For instance, Sophos Inc. [16] and Zahren [19] have not included fake offers of ‘lotteries’ in any category in their classifications. Through this paper we have attempted to propose a classifier for consistent UBE classification and which is not void of important UBE categories. Stephenson [17] has treated spam fighting as similar to anti-virus technique. We propose that these two are different areas and so, should be dealt with differently. We are of the further opinion that ‘virus containing spam email’ is just one kind of UBE.
Security Software Zone Inc. [14] has proposed ‘Dictionary Spam’ as a category for UBE classification. Using ‘Dictionary Spam’ is a common spamming technique in which the spammer creates a list of email addresses using common English words from dictionary. We believe that approach of spammer is not more important than content of spam for UBE classification. This means to say that past research works exhibit ambiguity as far as classification of UBE is based on two related but different criteria. In this paper, we have made an explicit attempt to provide content-based UBE classifier. We believe that for UBE classification, content of UBE is more significant than mechanism used for delivering it.
vacation invitation is just bait for this. McAfee has provided a UBE classification in which Russian Spam, Chinese Spam and Adult Services are treated as different spam categories [11]. We propose that language-wise spam email classification should not be confused with spam email classification based on intent and content of spam email. This is so because, for instance, Russian Spam implicitly includes Adult Services in Russian language. In this paper, we propose UBE classification based on English language but the categories proposed in this paper are equally applicable to classification of UBE in any other language as well.
The analysis of past works shows that there is a complete dearth of a common definition for UBE categorization. For instance, a lot of ambiguity exists in research arena regarding classification of UBE to ‘Adult’, ‘Porn’, ‘Financial’ and ‘Illegal’ categories. As an example of this let us classify ‘Porn’ UBE as ‘Adult’. But for a person less than age of 18 (or whatever age is permitted by laws of a country), this is ‘Illegal’. Similarly, entering financial transactions of millions of US Dollars through ‘next-of-kin’ UBE is also eligible to be classified as ‘Illegal’ as well as ‘Financial’ UBE. We believe that the proper UBE classification is also important form the perspective of legislation. This is so because in absence of proper, definite and descriptive UBE classification, the law enforcing agency can not decide the gravity and extent of crime, to prosecute a culprit or acquit an innocent person.
Summarizing, this paper attempts to provide an alternative way of classification for a few categories of UBE, which are often classified into one or the other category by different research groups with an inherent factor of ambivalence. Another example in this respect is classifying UBE containing text ‘Viagra for ...’ in ‘Porn’ category [15] or ‘Adult’ category [4]; instead of putting it in ‘Medicinal Advertisement’ in both cases. Most of the researchers in past works have not attempted to classify UBE; instead have just created adhoc groups of similar emails found in the ‘inbox’ or ‘spam-box’ of email users.
3 Problem solving methodology
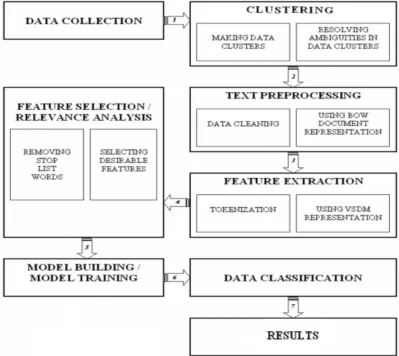
To identify categories of UBE and classify a given UBE document in a correct category was the main motive of our work. Towards this end, we designed an algorithm for UBE classifier. The broad outline of methodology of proposed algorithm is given below, followed by its
description in the form of pseudo-algorithm for problem solving.
A. Data Collection & Clustering B. Data Pre-processing
C. Feature Extraction & Feature Selection D. Model Building / Model Training E. Data Classification
A. Data Collection & Clustering:
1. {Data Collection} We first collected various UBE documents of all types together. We used 40 email addresses for collecting the required data. Another 18 websites providing online archives of UBE were also used for data collection. This formed a text corpus amounting to approx. 1.5 GB of data-size and consisted of 30074 UBE documents. To prevent the data from ‘contributor bias’ [3], it was sourced from different locations and at different times from email addresses owned different persons.
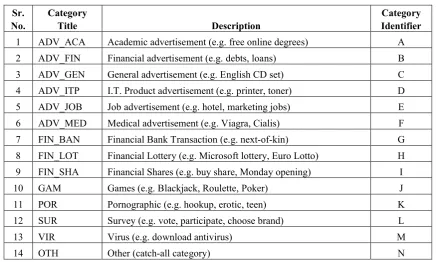
2. {Clustering} As a next step, we identified the data clusters. For this, we used hierarchical divisive clustering approach in which initially all the UBE documents formed one text corpus of a single cluster. This text corpus was then passed through an evolutionary process of mergers and divisions before finally yielding 14 clusters. These 14 clusters are listed in Table 2.
Sr. No.
Category
Title Description
Category Identifier 1 ADV_ACA Academic advertisement (e.g. free online degrees) A
2 ADV_FIN Financial advertisement (e.g. debts, loans) B
3 ADV_GEN General advertisement (e.g. English CD set) C
4 ADV_ITP I.T. Product advertisement (e.g. printer, toner) D
5 ADV_JOB Job advertisement (e.g. hotel, marketing jobs) E
6 ADV_MED Medical advertisement (e.g. Viagra, Cialis) F
7 FIN_BAN Financial Bank Transaction (e.g. next-of-kin) G
8 FIN_LOT Financial Lottery (e.g. Microsoft lottery, Euro Lotto) H
9 FIN_SHA Financial Shares (e.g. buy share, Monday opening) I
10 GAM Games (e.g. Blackjack, Roulette, Poker) J
11 POR Pornographic (e.g. hookup, erotic, teen) K
12 SUR Survey (e.g. vote, participate, choose brand) L
13 VIR Virus (e.g. download antivirus) M
14 OTH Other (catch-all category) N
Table 2List of Proposed UBE Categories
B. Data Pre-processing:
3. {Data Cleaning; Text Pre-processing} At this stage, we pre-processed the collected text-files in the UBE corpora by removing ‘obvious noise’ from them and converting them in a common format. By ‘obvious noise’, we mean the location and site specific data slipped into the UBE documents when sourced from different locations, e.g. website name. This data-cleaning is also required for making the data ready for further processing – specifically, easing the subsequent phase of feature extraction.
C. Feature Extraction & Feature Selection:
4. {Sentence Splitting; BOW} For each UBE of first category, we performed sentence splitting by treating it as a Bag Of Words (BOW).
5. {Syntactic Text Analysis, Parsing, Tokenization} We then performed Syntactic Text Analysis by Parsing the UBE document, for extraction of Tokens. This is easy to do as the document is already treated as BOW.
6. {VSDM} The tokenization of UBE resulted in each document being represented as sub-set of Vector Space Document Model (VSDM). A vector corresponding to each UBE in this model is 2-dimensional, consisting of unique tokens/terms/words and their frequency and is sorted on frequency column in descending order. Let us call this vector C1 for first category.
7. {Stop-list} The UBE vectors are designed not to include stop-words, except for the first iteration of the system when the stop-list will be empty. The stop-list considered by us consists of following four types of stop-words:
a. HTML stop-words e.g. html, body, img
b. Generic stop-words e.g. his, thus, hence
c. Noise stop-words e.g. isdfalj, asdfwg d. Domain stop-words e.g. salary,
academy, phone
stop-list with the words designated and selected as stop-words from the UBE vectors.
9. Next, we repeated steps 4 to 8 for each of remaining 13 categories.
10. At this stage, we had 14 vectors from C1 to C14.
11. {Domain Stop Words} We processed all 14 vectors to find words which are common to all 14 categories, appended those words to stop-list and repeated steps 5 to 7 for all categories, one by one.
12. {Feature Selection} At end of step 11, we had 14 2-dimensional vectors without stop-words of any type. We also obtained another set of 14 2-dimensional vectors which contained just the stop-words extracted from a category. These 28 2-dimensional vectors collectively formed the extracted feature set. The experimental results showed that the later vector set was not of statistical significance, and so was ignored. During feature selection, we also ignored words of length greater than 30, as they did not appeared to be of statistical relevance. The remaing set of 14 2-dimensional vectors not containing the stop-words formed formed the Selected Feature Set. This set constituted the Training Data.
D. Model Building / Model Training:
13. Using the training set of 14 2-dimensional vectors, we created a 3-dimensional vector containing category-identifier, words in that category and weight. We called this vector Weighted Term Vector (WTV). This vector is sorted on category-identifier in ascending order, on weight in descending order and finally on words in ascending order, necessarily in this sequence and order. WTV is the list of tokens with which the proposed system has learned and is aware of classifying any UBE containing token sub-set from WTV.
14. The weight of the words in WTV is calculated using the formula given in (1). The right hand side of formula (1) depicts addition of two terms. The first of these emphasizes the rank/position of the word in the sorted vector (discussed in Step 15) while the second term emphasizes the frequency of the word with respect to number of UBE documents present in this category (discussed in Step 16).
15. For each category, a 2-dimensional vector is maintained with unique tokens and their frequency, sorted on frequency in descending order. This creates a ranked token list.
16. Another 2-dimensional vector is created to contain category identifiers and total number of UBE documents in each of 14 categories.
17. Training is complete here.
Legend:
1. Wic �Weight of ithword in cthcategory
2. ns(N) �count of N for values smaller than N; i.e. number of words with frequency smaller than
(frequency of ithword in cthcategory)
(frequency of ithword in cthcategory)
4. N �same as described for n(Tic)
5. n(Dc) �count of Documents in cthcategory; i.e. total number of Documents in cthcategory
6. Tic �ithTerm/Word in cthcategory
7. n(Tic) �count of ithword in cthcategory; i.e. frequency of ithword in cthcategory
8. n(N) �count of N; i.e. total number of terms/words
E. Data Classification 18. Testing starts now.
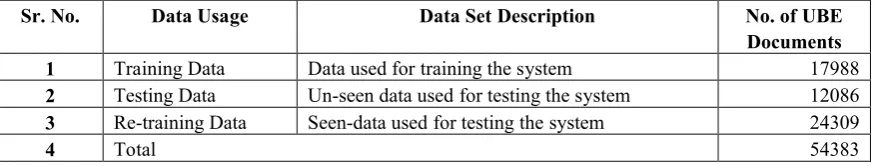
19. Out of a total of 30074 UBE documents collected during the data collection phase, 17988 UBE documents were used as Training
Data whereas the remaining 12086 UBE documents, i.e. unseen data were used as Testing Data. The training data, i.e. seen data was also used for testing the system and we call this type of data as ‘Re-training data’. The statistics of training, testing and re-training data usage is depicted in Table 3.
Sr. No. Data Usage Data Set Description No. of UBE
Documents
1 Training Data Data used for training the system 17988
2 Testing Data Un-seen data used for testing the system 12086 3 Re-training Data Seen-data used for testing the system 24309
4 Total 54383
Table 3Data Usage Statistics Re-training the system means the system is fed
with the same data as input that it has seen before. This is beneficial because,
a. it checks whether UBE documents previously classified correctly are still correctly classified
b. it checks whether system efficiency is improving or not
c. it helps in increasing weightage of good features
20. For tesing purpose, the UBE under question has to undergo the same sequence of data cleaning, sentence splitting, stop-words removal and VSDM representation. Finally, a 2-dimensional vector consisting of unique words and their frequency is created for each UBE in each category.
21. A Category Weight List (CWL) for each file in each category is created. CWL is a
2-dimensional vector containing category-identifiers and corresponding weights and is sorted on category-weight in descending order. The weight for a particular category-identifier is derived by summing the weights of all words found in that category. For finding word in a category and its corresponding weight, we use WTV.
22. {Classification} UBE, under question is said to belong to the category with highest ranking in CWL.
23. {Results} Statistical details as to number of files classified successfully, unsuccessfully, etc. are recorded for each category as well as for the overall efficiency of the system.
Fig. 1Block Diagram for Proposed Algorithm 4 Results and findings
For obtaining the experimental results, the system was passed through 16 trials (Ti), wherein each trial posed the system with a set of UBE documents to be classified. The system was designed to provide an ordered list of three classification categories of the UBE under question. The order of list was significant because first category in the list shows maximum empirical probability of the UBE belonging-ness to this category, second category in the list shows the next-highest empirically predicted probability of the UBE belonging-ness to this category, and so forth. Based on the first three ‘predicted categories’, we calculated the results for three ‘positions’. Results at first position indicate that UBE belongs to first predicted category, results at second position show that UBE could belong to either first category or second category predicted by the
system and results at third position indicate that UBE could belong to any of the first three categories predicted by the system. For simplicity, we denote first position results by 1PCC to indicate 1st Predicted Classification Category. Similarly, 2PCC stands for 2nd Predicted Classification Category and 3PCC stands for 3rdPredicted Classification Category. Also, in order to differentiate the results of Seen Data from Un-seen Data, the later is represented with shaded background, wherever possible.
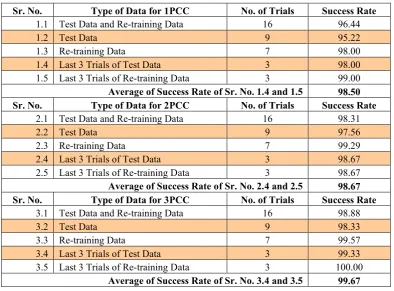
4.1 Summarized view of system efficiency Table 4 gives the summary of various statistical results on the efficiency of the system. The details of Table 4 like success rate (in %) of first three predicted classification categories corresponding to each trial are provided in Table 5.
Sr. No. Type of Data for 1PCC No. of Trials Success Rate
1.1 Test Data and Re-training Data 16 96.44
1.2 Test Data 9 95.22
1.3 Re-training Data 7 98.00
1.4 Last 3 Trials of Test Data 3 98.00
1.5 Last 3 Trials of Re-training Data 3 99.00
Average of Success Rate of Sr. No. 1.4 and 1.5 98.50 Sr. No. Type of Data for 2PCC No. of Trials Success Rate
2.1 Test Data and Re-training Data 16 98.31
2.2 Test Data 9 97.56
2.3 Re-training Data 7 99.29
2.4 Last 3 Trials of Test Data 3 98.67
2.5 Last 3 Trials of Re-training Data 3 98.67
Average of Success Rate of Sr. No. 2.4 and 2.5 98.67 Sr. No. Type of Data for 3PCC No. of Trials Success Rate
3.1 Test Data and Re-training Data 16 98.88
3.2 Test Data 9 98.33
3.3 Re-training Data 7 99.57
3.4 Last 3 Trials of Test Data 3 99.33
3.5 Last 3 Trials of Re-training Data 3 100.00
Average of Success Rate of Sr. No. 3.4 and 3.5 99.67 Table 4Summarized View of System Efficiency
Table 4 presents results for all 16 trials, 9 trials of Test Data and 7 trials of Re-training Data. But most significant results are for the last 3 trials of the system, each for Test Data and Re-training data. The average of last 6 trials helped us obtain the success rate of 98.50% for first position classification of the UBE. The results obtained for second and third positions were 98.67% and 99.67%, respectively. We considered only first three classification results because as the category classification position increases, there is sharp decrease in its statistical significance.
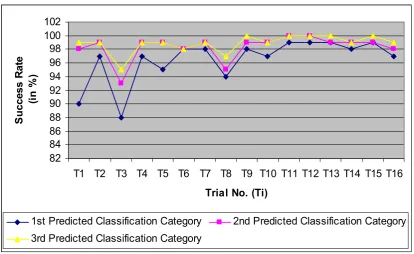
4.2 Success rate (in %) of first three predicted classification categories
Table 5 shows the success rate of first three predicted classification categories. The interpretation of column titled ‘T1’ of Table 5 is as follows. For the ordered list of three predicted categories, it was 90% success rate that system correctly predicted the belonging-ness of the UBE, under test, to category at first position. Similarly, it was 98% success rate that system correctly predicted the belonging-ness of the UBE to either of the first two predicted categories, in the ordered list of three predicted categories. Further, it was 99% success rate
that system correctly predicted the belonging-ness of the UBE to any of the three categories, in the empirically predicted ordered list of three categories.
Ti T1 T2 T3 T4 T5 T6 T7 T8
1PCC 90 97 88 97 95 98 98 94
2PCC 98 99 93 99 99 98 99 95
3PCC 99 99 95 99 99 98 99 97
Ti T9 T10 T11 T12 T13 T14 T15 T16
1PCC 98 97 99 99 99 98 99 97
2PCC 99 99 100 100 99 99 99 98
3PCC 100 99 100 100 100 99 100 99
Table 5Success Rate (in %) of First Three Predicted Classification Categories
82 84 86 88 90 92 94 96 98 100 102
T1 T2 T3 T4 T5 T6 T7 T8 T9 T10 T11 T12 T13 T14 T15 T16 Trial No. (Ti)
S
u
cc
es
s
R
at
e
(i
n
%
)
1st Predicted Classification Category 2nd Predicted Classification Category 3rd Predicted Classification Category
Chart 4.1Success Rate (in %) of First Three Predicted Classification Categories 4.3 Results of category-wise classification of
UBE documents
Corresponding to the 1PCC, the statistical data of success rate (in %) of category-wise classifications of UBE documents is presented in Table 6.
Sr.
No. Ti Average�� Average��
Average F-measure
1 T1 91.59 91.26 90.53
2 T2 97.49 93.56 94.78
3 T3 91.97 87.91 87.71
4 T4 97.51 94.63 95.71
5 T5 97.14 95.04 95.82
6 T6 97.7 98.16 97.79
7 T7 98.63 99.14 98.85
8 T8 95.47 94.17 94.29
9 T9 98.31 98.42 98.33
10 T10 97.87 97.38 97.54
11 T11 100 99.24 99.61
12 T12 99.92 99.87 99.89
13 T13 99.82 99.63 99.72
14 T14 98.73 98.99 98.84
15 T15 99.12 98.24 98.65
16 T16 95.06 98.58 96.05
Table 7 Average Values for Precision, Recall and F-measure for 16 Trials
4.4 Results on most confused and least confused categories
When UBE under test is miss-classified then there is difference between the theoretical and empirical results for the category of the UBE document. For the 16 trials that we had conducted for testing the system, we collected data on miss-classifications and found that ADV_MED was the most confused category. This was derived from the fact that for majority of the cases, a file belonging to a different category was classified in ADV_MED or a file belonging to category ADV_MED was classified in a different category
To a decreasing degree, the other most confused categories included FIN_SHA and SUR. Moving on same lines, we also found that the categories FIN_BAN, FIN_LOT and POR were least confused categories.
calculated on basis of precision and recall. Further, based on the data presented in Table 7, we calculated the average values of Precision, Recall and F-measure
for different types of data-sets. This data is presented in Table 8.
Sr. No.
Type of Data for Average Value No. of Trials
�� �� F-measure
1 Test Data and Re-training Data 16 97.27 96.51 96.51
2 Test Data 9 96.16 95.72 95.39
3 Re-training Data 7 98.70 97.53 97.94
4 Last 3 Trials of Test Data 3 97.64 98.60 97.85
5 Last 3 Trials of Re-training Data 3 99.91 99.58 99.74 Average of Success Rates of Sr. No. 4 and 5 98.78 99.09 98.79 Table 8Summary of Average Values for Precision, Recall and F-measure These average values provided us with the
summarized data, which is another parameter for measuring the efficiency of the proposed system. The F-measure value of 98.79% corresponding to the average of last 6 trials of Test Data and Re-training Data is a good support for proving our system worthy enough for implementation purpose.
5 Conclusions
We feel that there is need of a UBE classifier for better understanding, tackling, fighting the problem of UBE and to the least – providing an ease for email management. Unlike most past research works, we did not work towards classification of emails into spam and non-spam ones, per se; instead, we have provided a novel tool for consistent and un-ambiguous classification of UBE documents into 14 categories.
We designed the system to predict the classification category of the given UBE under question. We considered only first three classification results because as the category classification position increases, its statistical significance decreases. We were able to obtain an average success rate of 98.50% for classification of UBE documents. Also, as the size of training data set increased, there was an increase in the category-wise success rate as well as the overall efficiency of the system. The classic precision, recall and F-measure values for the system are 98.78%, 99.09% and 98.79%, respectively.
We feel that content based text analysis of documents is a subjective area and classification based on this being a fuzzy process can not be done with certainty. However we have endeavored to put forward an analytic look into the world of spam emails and our results and findings support the strength of the system
for its deployment for purpose of UBE classification. Finally this is an attempt to contribute to the field of document classification from perspective of a naïve classification of un-structured web documents. Our work does not intend to propose a dominant algorithm over others but is best reported on the test collection used and approaches real-world manual classifiers accuracy.
References
1. Anonymous Categorizing junk eMail http://www.knujon.com/categories.html, 2008 2. Berry, R. The 100 Most Annoying Things of
2003,
http://www.retrocrush.buzznet.com/archive200 4/annoying2003/, January 18, 2004
3. Castillo, C., Donato, D., Becchetti, L., Boldi, P., Leonardi, S., Santini, M., Vigna, S.-A.
Reference Collection for Web Spam, ACM
SIGIR Forum, v. 40, n. 2, p. 11-24, December 2006, ISSN: 0163-5840
4. Cranor, L.-F., LaMacchia, B.-A. Spam!, Communications of the ACM, v. 41, n. 8, p. 74-83, 1998
5. Crucial Web Hosting Ltd. How Consumers
Define Spam,
http://www.crucialwebost.com/blog/how-consumers-define-spam/, March 06, 2007 6. Federal Trade Commission. False Claims in
Spam, A report by the United States FTC
Division of Marketing Practices, April 30, 2003
7. Frederic, E. Text Mining Applied to Spam
Detection,
20Filtering.pdf, Presentation given at University of Geneva on January 24, 2007 8. Gyongyi, Z., Garcia-Molina, H. Web Spam
Taxonomy, First International Workshop on
Adversarial Information Retrieval on the Web (AIRWeb, 2005), Chiba, Japan, April 2005 9. Infinite Monkeys & Co. Spam Defined,
http://www.monkeys.com/spam-defined/definition.shtml, 2008
10. Lambert, A.Analysis of Spam,Dissertation for Degree of Master of Science in Computer Science, Department of Computer Science, University of Dublin, Trinity College September 2003
11. McAfee Inc. Current Spam Categories, http://www.mcafee.com/us/threat_center/anti_s pam/spam_categories.html, December 23, 2008
12. Roth, W. Spam? Its All Relative, http://www.imediaconnection.com/content/758 1.asp, Published online on December 19, 2005 13. Sebastiani, F. Text Categorization, Alessandro
Zanasi (ed.), Text Mining and its Applications, WIT Press, Southampton, UK, 2005, Pages 109-129
14. Security Software Zone Inc. Types of Spam, http://www.securitysoftwarezone.com/reviews-spam-blocker-4.html, August 2006
15. Sen, P. Types of Spam,
http://ciadvertising.org/sa/fall_04/
adv391k/paroma/spam/types_of_spam.htm, Interactive Advertising, Fall 2004
16. Sophos Inc. Sophos identifies the most
prevalent spam categories of 2005,
http://www.sophos.com/pressoffice/news/articl es/2005/08/pr_uk_20050803topfive-cats.html, August 3, 2005
17. Stephenson, P. Email Content Management, http://www.scmagazineuk.com/Email-content-management-2008/GroupTest/129/, SC Magazine for IT Security Professionals, UK June 02, 2008
18. Youn, S., McLeod, D. Spam Email
Classification using an Adaptive Ontology,
Institute of Electrical and Electronics Engineers (IEEE) Journal of Software, April 2007