Analysis of Interrelationships Among
Application Popularity, Application Stability,
and Potential Risk in e-WOM
Umesha Perera
Charolina Ventiana Dewi
Mutiara Dian Sari
Ushio Sumita
Graduate School of Systems and Information Engineering University of Tsukuba
1-1-1 Tennodai, Tsukuba, Ibaraki, Japan
ABSTRACT
International Journal of Business and Information based on a set of real use data provided by an Android application software company named Fuller, Inc., combined with reviews and permission data of Android applications collected from GooglePlay.com and AppBrain.com. For our methodology, we used a text-mining approach in conjunction with correlation analysis. We found that behavioral targeting could enhance both application popularity and application stability.
Keywords: e-WOM, application popularity, application stability, potential risk, behavioral targeting
1. INTRODUCTION
One of the most significant impacts of the Internet on marketing is the emergence of one-to-one marketing. Before the advent of the Internet, the major focus was on mass marketing through TV, radio, newspapers, journals, and other media, directed one way from the medium to customers. By utilizing e-mail capabilities, the Internet has made it possible to conduct one-to-one marketing in an extensive manner, with speed and cost-performance efficiency. The importance of e-marketing is now clear. It enables one to combine mass marketing and one-to-one marketing, wherein corporations and customers exchange information valuable to one another through bi-directional communications. Furthermore, electronic word of mouth (e-WOM) has drawn much attention from practitioners and researchers, because information exchanged among indefinite consumers through social networks affects one another significantly.
software or data for security purposes. Because of the complexity of the permission systems installed in Android, users cannot understand it easily. Accordingly, Android users face the potential risk of downloading and installing bad applications on their devices. In the third area, “behavioral targeting,” individual consumers are targeted in e-marketing, based on personal information collected from e-WOM and other sources on the Internet.
Although literature already exists providing insight on e-WOM from the perspectives of popularity, potential risk, and behavioral targeting, little research has been done (to the best of our knowledge) on the interrelationship among application popularity, application stability, potential risk, and behavioral targeting. This paper, with its focus on Android applications, aims to fill this gap by analyzing the correlation structure of the four factors, based on a set of real use data provided by Fuller, Inc. (an Android application software company), combined with reviews and permission data of Android applications collected from GooglePlay.com and AppBrain.com. For our methodology, we used a text-mining approach, in conjunction with correlation analysis.
The structure of this paper is as follows. In Section 2, we present the literature review. In Section 3, our discussion of application popularity introduces four popularity score functions; namely, a review popularity function, a popularity group function, a device popularity function, and a voting popularity function. Section 3 also introduces the concept of application stability, with a newly developed stability score function.
In Section 4, we structure potential risk by collecting permission data from AppBrain.com. Having assumed the Bernoulli structure for each application having certain permissions, we use the probabilistic Naïve Bayesian approach to estimate the underlying Bernoulli parameters. This step enabled us to compute the relative risk score associated with an application.
International Journal of Business and Information Given the set of keywords judged to be acceptable, the weight of keywords associated with device d can be computed, yielding the weight vectors associated with device d over different keywords . Based on such weight vectors, we decompose the set of devices into a set of clusters through the K-means method. These clusters represent customer segments, providing a basis for behavioral targeting.
Section 6 presents data used in our study and provides numerical results. In Section 7, we offer concluding remarks.
2. LITERATURE REVIEW
which the negativity effect is either likely to emerge or less likely to occur. In [8], machine-learning techniques were used to predict the popularity of online- distributed applications, based on the data collected from iTunes App Store. A Conformer-Maverick Model was proposed by [26] to rank top-k potentially popular items, based on the early votes of consumers via simulation.
In [6], a methodology was developed to empirically analyze permission-based security models by modifying the Self-Organizing Map of [16]. To help Android users better understand the trustworthiness degree of each application, [11] proposed a multi-criteria evaluation scheme of Android applications. In [20], the notion of risk scoring and risk ranking for Android applications was introduced and probabilistic generative models were developed to rank the risks of Android applications.
In [9], the effectiveness of user-consent permission systems was examined through a large-scale data collection of Facebook applications, Chrome extensions, and Android applications. The paper confirmed that the current forms of community ratings were not reliable indicators of the privacy risks of individual applications. In this regard, it was suggested by [2] that permissions should be divided into four categories depending on the level of the protection: normal, dangerous, signature, and signature or system.
International Journal of Business and Information Using the historical browsing session information, [15] proposed a Bayesian approach to specify the most suitable display advertisement option for each user. The Unified Theory of Acceptance (UTA) approach, combined with a survey, was used by [17] to assess the factors that would affect the use of smartphone applications. In [18], key factors were discussed that would influence the effects of e-WOM, including using experience, credibility, and susceptibility.
The literature described above provides insight into e-WOM from the perspectives of behavioral targeting, popularity, and potential risk. However, to the best of our knowledge, little research has been done on the interrelationship among application popularity, application stability, potential risk, and behavioral targeting. This paper, with its focus on Android applications, aims to fill this gap by analyzing the correlation structure of the four factors, based on a set of real use data, combined with reviews and permission data of Android applications collected from Googleplay.com and AppBrain.com. For our methodology, we used a text-mining approach in conjunction with correlation analysis. The results show that behavioral targeting could enhance both application popularity and application stability.
3. APPLICATION POPULARITY
AND APPLICATION STABILITY
voting data in the third data set. Fourth, as discussed in [9], application popularity can be defined in terms of the number of devices that downloaded that application.
To facilitate our analysis, we introduce the following notation. Let
A,
D,
R,
and
V
be the set of applications, the set of associated devices, the set
of reviews for those applications in
A,
and the set of votes for those
applications, respectively. Let
I
, ,
-
be the set of the popularity
groups, where “ ”, “ ”, and “
” represent positive, neutral, and negative,
respectively. For notational convenience, we define
.
and the associated vector is written as
The set of devices associated with application is then defined by
. .
The cardinality of a set X is denoted by . The number of devices in is then written as
.
We next classify reviews associated with application
For
this purpose, the following review indicator function of application
a
is
introduced:
International Journal of Business and Information
In the study, the process for determining was done by four different people, with decisions based on the unanimous agreement achieved through discussions. The set of reviews associated with having the popularity group I can then be defined as:
The corresponding cardinality is denoted by
.
We also define:
∈ .
In parallel with the above, we consider the following vote indicator function of
application
.
As for (3.6) through (3.8), we define:
I ;
∪
.
We are now in a position to introduce the following four popularity functions. In order to control these popularity functions better, we define to be the weight associated with the popularity group ∈ .
∈
Here, represents the average difference between the impact of the positive comments and that of negative comments per review, whereas describes the popularity group of application a, which achieves the largest impact among the three popularity groups for application a. For popularity in terms of user votes to determine the ranking, we define as in [26]. measures popularity in terms of the number of
devices having installed application a, as discussed in [9].
International Journal of Business and Information devices associated with application , formally defined as:
Application stability may then be defined as follows:
4. POTENTIAL RISK
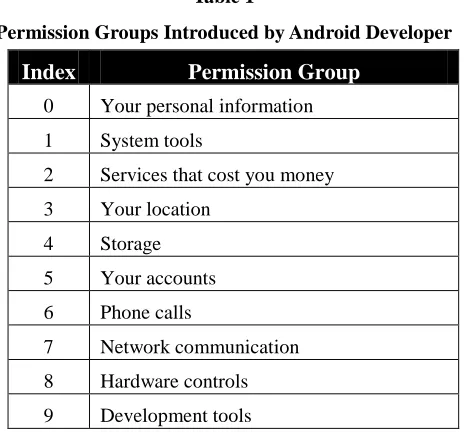
A mobile application may be malicious, a possibility that could impose potential risks for its users. To provide users of mobile applications with some guidance for assessing such potential risks, Android Developer introduces Permission Groups, as shown in Table 1, which defines the types of transactions to be involved in a mobile application. Protection levels defined by Android Developer are shown in Table 2.
Table 1
Permission Groups Introduced by Android Developer
Index Permission Group
0 Your personal information 1 System tools
2 Services that cost you money 3 Your location
4 Storage 5 Your accounts 6 Phone calls
International Journal of Business and Information
In addition to defining permission groups and protection levels, Android Developer defines a set of 137 types of permission, such as “Read your contacts,” “Read your Web bookmarks and history,” “Read sensitive log data,” “Take pictures and videos,” and the like, each of which dictates how an application can function in the Android environment. For each permission, a combination of permission group and protection level would be assigned. When an application developer wishes to introduce application , the developer would apply for permission, using his or her understanding of the permission group − protection level structure to the extent made open to application developers. Typically, one application has multiple permissions. Users can also know the permission and the protection level associated with each application to the extent made open to them. In [11], the potential risks arising from malicious mobile applications were classified into three categories: privacy risk, system risk, and money risk. The authors then assigned three risk scores for the three categories to each of 120 Android permissions, where each risk score is between 0 (no risk) and 1 (the highest risk). In this paper, we deal with all 137 permissions provided by Android Developer, rather than just the 120 incorporated in [11]. Furthermore, in contrast to the three risk scores assigned subjectively and manually by [11] for each permission, we define two risk functions involving the three categories of risks, permission group and protection level. The two risk functions enable one to construct a unified risk value to individual applications, as we will see.
Let A be the set of mobile applications for the current study, and define
to be the elements of permission group and protection level, respectively. Given x PG, y PL, and a A, we introduce the indicator function given by:
International Journal of Business and Information The number of permissions associated with application can then be obtained as
(4.2)
We also define the set of combinations of permission group and protection level associated with application by
.
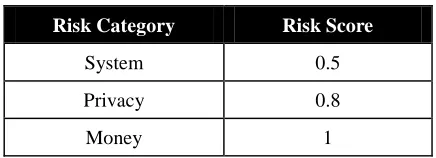
Of interest is to construct a unified risk score for application . For this purpose, we first assign a risk score to each of the three risk categories shown in Table 3.
Table 3
Risk Score for Each Risk Category
We perceive that the money risk and privacy risk categories should have higher risk scores than system risk. Money risk and privacy risk can directly affect the user’s life, whereas system risk will affect only the functioning of the user’s mobile device. The effect of money risk is more immediate and tangible than the effect of privacy risk. Therefore, we assign money risk the highest risk score (1). Then, we assign system risk a score that is half (0.5) that of money risk. Privacy risk is given a risk score (0.8) between that of money risk and system risk.
Risk Category Risk Score
System 0.5
Privacy 0.8
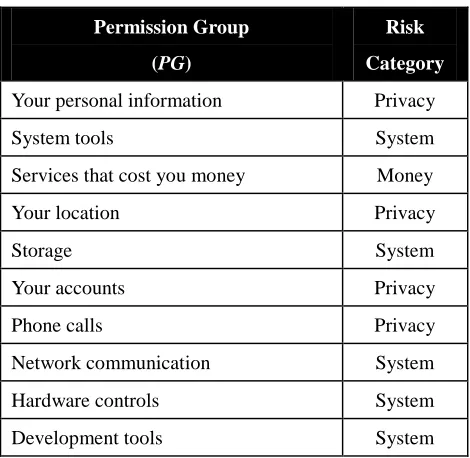
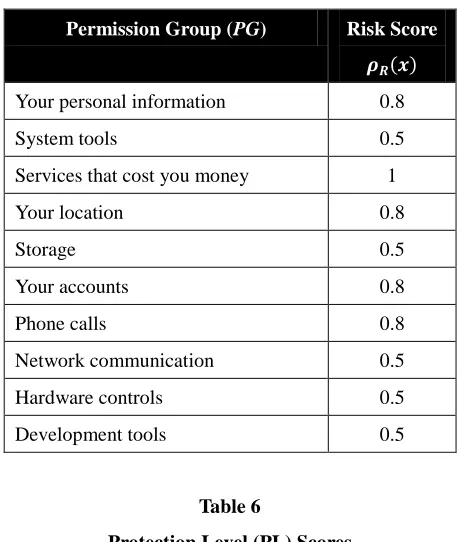
In Table 4, we define the risk category of each permission group. By combining tables 3 and 4, one can construct a risk score function defined on PG, as shown in Table 5. For protection level, we define a score function shown in Table 6.
Table 4
Risk Category of Each Permission Group (PG)
We are now in a position to construct a unified risk score
for
application
. Namely, we define
(4.4)
.
Permission Group
(PG)
Risk
Category
Your personal information Privacy
System tools System
Services that cost you money Money
Your location Privacy
Storage System
Your accounts Privacy
Phone calls Privacy
Network communication System
Hardware controls System
International Journal of Business and Information Table 5
Risk Score Functions
Table 6
Protection Level (PL) Scores
Protection Level (PL) Protection Score
Normal 0
Dangerous 1
Signature 2
Signature/System 3
We next classify an application based on its unified risk score . An application having an lower than is classified as “low-risk.” An application having an in the interval 4 to 7 is classified as “moderate to
Permission Group (PG) Risk Score
Your personal information 0.8
System tools 0.5
Services that cost you money 1
Your location 0.8
Storage 0.5
Your accounts 0.8
Phone calls 0.8
Network communication 0.5
Hardware controls 0.5
high-risk.” An application with an higher than 7 is classified as “extremely critical.”
As an alternative approach for assessing potential risks associated with mobile applications, [20] proposed to introduce a risk score function of an application relative to the potential risks of other applications, based on the probabilistic Naïve Bayesian model. In this paper, we follow this approach. More specifically, let be the set of applications having permissions with x PG, y PL; that is,
.
The number of applications in is denoted by
.
We assume that is a Bernoulli random variable with success parameter that is,
.
Let be the probability resulting from a random sampling of
. One then sees that
.
The total score can then be obtained based on in (4.10) over x
PG, y PL. More specifically, we define
International Journal of Business and Information The final risk score associated with application may then be constructed as
(4.10) ( ) .
In order to estimate , we follow [20], where depends on only x PG and y PL and is independent of , with its maximum a posteriori (MAP) estimation given by
As in [20], we assume that = 1 for all x PG and y PL, =1,
=N, and = = 2N for all x P.
5. IMPACT OF BEHAVIORAL TARGETING
ON APPLICATION POPULARITY AND STABILITY
In the previous sections, we discussed how to quantify application popularity and application stability. The purpose of this section is to examine how behavior targeting would affect application popularity and application stability. We focus on those devices with more than two applications in A, so as to facilitate the behavioral targeting. The resulting subset of D is denoted by DBT. A set of keywords, denoted by , is first extracted from R by using text-mining techniques. The validity of for the purpose of behavioral targeting is then tested, based on [25]. The impact of a keyword associated with a device is then evaluated, which is denoted by
. This, in turn, yields a vector .
clusters represent separate behavioral targets. For each cluster , the values of and are evaluated in parallel with the discussions in sections 3 and 4 of this paper. By comparing these values across different clusters, one can assess the impact of behavioral targeting on application popularity and application stability.
The first step in our analysis is to extract keywords from the set of reviews R by using the Text Mining Studio, a commercial software package for text mining. As in [25], for the purpose of behavioral targeting, we selected only those keywords used in a positive or neutral context. The study of application popularity was done by four different people, with decisions based on the unanimous agreement achieved through discussions. Let the result in a set of keywords be denoted by
In order to establish the validity of for the purpose of behavioral targeting, we follow the approach presented in [25]. In this regard, we restrict ourselves to those devices that qualify to be considered for behavioral targeting in two regards: those having sufficiently numerous applications, and those that are continuously active up to the present for at least one application in A. More specifically, let be the set of devices in having at least four applications in A, and define to be the set of devices in having the use vector given in (3.2) of the form [000001], [000011], [000111], [001111], [011111], or [111111], and let be the number of reviews with reference to application containing the keyword For each , we use to test the validity of . Then, we define:
International Journal of Business and Information Given , , and , let the indicator function
be defined by
We then define the following vector for each pair of and .
.
The validity of can now be tested based on the cosine similarities among . More specifically, given two N-dimensional vectors , let the cosine similarity between be defined by
,
where and .
We measure the similarity of across different devices and the similarity between and by
(5.6)
(5.7)
Let be defined by
The set of keywords is then judged to be appropriate if the average value of over all combinations of and is greater than 1. Otherwise, the set should be modified by eliminating a keyword. This process should be continued until the average value becomes greater than 1. Assuming that the set of keywords has passed the validity test above, we are now in a position to proceed to behavioral targeting. Let be the number of months in which device had application , and let be the number of reviews with reference to application containing the keyword . Namely, we def
ine
The weight vector associated with , denoted by , can then be defined as
International Journal of Business and Information Using in (5.10), we now decompose into a set of mutually exclusive and exhaustive subsets, each of which represent a segment of users sharing similar use behaviors. For this purpose, one of the most prevalent clustering algorithms, called the K-means method, is used. Through this procedure, suppose that is decomposed into L segments; that is,
(5.11)
Let be the set of applications owned by a device in in at least one of the six months. More formally, we define
We also define The review popularity function associated with may then be defined as
Similarly, the stability function associated with may also be defined by
In order to assess the impact of behavioral targeting on application popularity and application stability, we compare the maximum of and that of with in (3.13) and in (3.18), respectively. We say that behavioral targeting is effective with respect to application popularity at the level of C> 0, if
where Similarly, we say that behavioral targeting is effective with respect to application stability at the level of C > 0, if
where
6. NUMERICAL EXAMPLE
International Journal of Business and Information Because of the massive amount of data, we focus on the application category of free games, which has six sub-categories: Arcade, Brain, Cards, Casual, Racing, and Sports games. Only those games satisfying the following four conditions were selected for our study: (1) those that were installed by more than 50 devices in each month throughout the period; (2) those that collectively accounted for 70% of the total number of devices installed during at least one month in the period; (3) those that had more than 100 user reviews in the second data set; and (4) those for which permissions could be identified in the third data set. Consequently, the 60 free games shown in Table 7 were selected across the six sub-categories for this study.
Table 7
Free Games Satisfying Conditions (1), (2), and (3)
ARCADE BRAIN CARDS CASUAL RACING SPORTS
GAMES
TOTAL
14 11 4 25 3 3 60
Figure 1 exhibits three different popularity scores, , , and , given in (3.13), (3.15) and (3.16), where applications are listed along the horizontal axis in descending order of . We note that and behave similarly, whereas is quite irregular.
International Journal of Business and Information Figure 2. Positive, Neutral, and Negative Groupings (All Free Games)
Figure 4 depicts the number of applications in low-risk and moderate- to high-risk classes, by sub-categories, where this classification is based on the unified risk score given in (4.4). It can be seen that no application is judged to be extremely critical. All applications in BRAIN, CARDS, and SPORTS GAMES are grouped in low-risk, whereas ARCADE has two relatively risky applications. Both CASUAL and RACING have only one application in moderate- to high-risk. One may say that, in general, most of the free games applications in Japan are fairly safe.
Figure 4. Applications in Low-Risk and Moderate- to High-Risk Classes, by Sub-Categories
International Journal of Business and Information reviews, for which the validity test was based on (5.8). We found that the average of R(a,b) in (5.8) over a, b to be 1.24812, which demonstrates the validity of the selected keywords for behavioral targeting, according to [25]. Figure 7 and Figure 8 exhibit and for the number of clusters L
varying as L=1, 5, 10, 20, 40, 80, and 160. For the case of L=1, one has
and . We observed that each
case for L dominates the case for L=1, and that this dominance is more strengthened as L increases, indicating that behavioral targeting enhances both application popularity and application stability. Table 8 summarizes such
dominances by showing the average of
and the average of
over a , where the numbers increase as L increases.
For our examination of statistical correlations among application popularity, application stability, and potential risk, the following variables are treated as random variables taking values for each a A.
: the number of devices associated with a A, given in (3.4)
: the number of votes associated with a A, given in (3.11)
: the popularity score associated with a A, given in (3.13)
: the stability score associated with a A, given in (3.18)
: the unified risk score associated with a A, given in (4.4)
: the relative risk score associated with a A, given in (4.10)
: the popularity score associated with a A, as in (5.15) for the decomposition of L = 20
: the stability score associated with a A, as in (5.16)
for the decomposition of L = 20
Table 8
Average Ratio of Application Popularity and Application Stability
The statistical correlations among the above random variables are summarized in Table 9. As indicated by **, the highest correlation is found between and at the significance level of 0.01.
With the significance level of 0.05, one finds that and , as well as and , are positively correlated with the values of 0.259 and 0.281, respectively. Although and are positively correlated with statistical significance, the correlation between and is not statistically significant and is negligible. This observation can be also made for the pair and .
7. CONCLUSION
This paper discusses the relationships among application popularity, application stability, and potential risk, and how behavioral targeting would affect those relationships. Our study shows that free games in Japan had more positive reactions than negative ones from users. Furthermore, the games are considered to be fairly safe. We found that popular applications are likely to be more stable. Assuming that the number of permissions is equal to the number of features, we found that potential risk increases as application stability increases. Finally, we found that behavioral targeting based on personalized information collected from user reviews can be used in the marketing strategy to improve application popularity and application stability.
Ratio L = 5 L = 10 L = 20 L = 40 L = 80 L = 160
Stability 1.89 2.06 2.21 2.26 2.25 2.28
One limitation of this paper is that user reviews extracted from Google Play could not be directly associated with the devices in the dataset. Also, this study assumes that user reviews would represent user behaviors long enough that e-WOM-based behavioral targeting could be used effectively before becoming outdated. These limitations provide an area for future studies.
ACKNOWLEDGMENT
The authors wish to thank two anonymous referees for their useful comments, which contributed to improving an earlier version of this paper. This research is supported in part by MEXT Grand-in-Aid for Scientific Research (B) 25282086.
REFERENCES
[1] Ahluwalia R. 2002. How prevalent is the negativity effect in consumer environments? Journal of Consumer Research 29:270–80. Retrieved 13 October 2013 from http://www.jstor.org/stable/10.1086/341576
[2] Android Developers. 2013. API Guides: Permission.
[3] Arora, N.; X. Dreze; A. Ghose; J.D. Hess; R. Iyengar; B. Jing et al. 2008. Putting one-to-one marketing to work: Personalization, customization, and choice, Marketing Letter 19:305–21.
[4] Balasubramanian, S., and V. Mahajan. 2001. The economic leverage of the virtual community, International Journal of Electronic Commerce 5: 103–38.
[5] Banerjee A,; and D. Fudenberg. 2004. Word-of-mouth learning, Games and Economic Behavior 46: 1–22.
[6] Barrera D.; P.C. Van Oorschot; and A.A. Somayaji. 2010. A methodology for empirical analysis of permission-based security models and its application to Android. security. Retrieved from http://doi.acm.org/10.1145/1866307.1866317 [7] Bone, P.F. 1995. Word-of-mouth effects on short-term and long-term product
International Journal of Business and Information [8] Chen, M., and X. Liu. 2011. Predicting popularity of online distributed applications: iTunes app store case analysis, Proceedings of 2011 iConference 661–3. Retrieved 20 June 2013 from http://dl.acm.org/citation.cfm?id=1940859
[9] Chia, P.; Y. Yamamoto; and N. Asokan. 2012. Is this app safe? A large-scale study on application permissions and risk signals, Proceedings of the 21st International Conference 311–20. Retrieved 13 October 2013
from http://dl.acm.org/citation.cfm?id=2187879
[10] Dellarocas, C. 2003. The digitization of word-of-mouth: Promise and challenges of online reputation mechanisms, Management Science, pp.1–38. Retrieved from http://mansci.journal.informs.org/content/49/10/1407.short
[11] Dini, G.; F. Martinelli; I. Matteucci; and M.A. Petrocchi. 2012. Multi-criteria based evaluation of Android applications, 256980:67–82. Retrieved 22 July 2014 from http://link.springer.com/chapter/10.1007/978-3-642-35371-0_7
[12] Ellison, G., and D. Fudenberg. 1995. Word-of-Mouth Communication and Social Learning, Oxford University Press.
Retrieved from http://www.jstor.org/stable/2118512
[13] Fiske, S.T. 1980. Attention and weight in person perception: The impact of negative and extreme behavior, Journal of Personality and Social Psychology 38: 889–906. Retrieved from http://content.apa.org/journals/psp/38/6/889
[14] Goldenberg, J.; B. Libai; and E. Muller. 2001. Talk of the network: A complex systems look at the underlying process of word-of-mouth, Marketing Letters 12:211–23.
[15] Gupta, N.; U. Khurana; T. Lee; and S. Nawathe. 2011. Optimizing display advertisements based on historic user trails, SIGIR. Beijing, China.
[16] Kohonen, T. 2001. Self-Organizing Maps, 3rd ed. Springer Publishing.
[18] Park, C.; Y. Wang; Y. Yao; and Y.R. Kang. Factors influencing e-WOM effects: Using experience, credibility, and susceptibility, International Journal of Social Science and Humanities 1:74–9.
Retrieved from http://www.ijssh.org/show-7-275-1.html
[19] Park D-H.; J. Lee; and I. Han. 2007. The effect of on-line consumer reviews on consumer purchasing intention: The moderating role of involvement, International Journal of Electronic Commerce 11:125–48.
[20] Peng, H.; C. Gates; B. Sarma; N. Li; Y. Qi; R. Potharaju; et al. 20012. Using probabilistic generative models for ranking risks of Android apps, In: Proceedings of the 2012 ACM Conference on Computer and Communications Security. ACM; 241–52. Retrieved from http://doi.acm.org/10.1145/2382196.2382224
[21] Shardanand, U. 1995. Social information-filtering: Algorithms for automating “word of mouth,” Proceedings of the. SIGCHI Conference. Retrieved from http://portal.acm.org/citation.cfm?id=223931¥npapers2://publication/uuid/6A88D6 09-6A45-4B88-BB1F-58259D47EE66
[22] Stauss, B. 1997. Global word of mouth, Marketing Management 6: 28–30. Retrieved from http://elibrary.ru/item.asp?id=3016419
[23] Tucker, C. 2010. The economic value of online customer data, In: The Economics of Personal Data and Privacy: 30 Years after the OECD Privacy Guidelines. Retrieved 22 July 2014 from http://www1.oecd.org/internet/ieconomy/46944475.pdf [24] Walsh, G.; K.P. Gwinner; D.D. Gremler; and T. Hennig-thurau. 2004. Electronic word-of-mouth via consumer-opinion platforms: What motivates consumers to articulate themselves on the Internet? Journal of International Marketing 18:38–52. [25] Yan, J.; N. Liu; G. Wang; and W. Zhang. 2009. How much can behavioral targeting help online advertising? Proceedings of 18th International WWW Conference 61–70. Retrieved from http://portal.acm.org/citation.cfm?id=1526745 [26] Yin, P; P. Luo; M. Wang; and W. Lee. 2012. A straw shows which way the wind
International Journal of Business and Information ABOUT THE AUTHORS
Ushio Sumita is a professor at the Graduate School of Systems and Information Engineering, University of Tsukuba, Japan. He received a Ph.D. in 1981 from the University of Rochester, U.S.A., and a second Ph.D. in 1987 from the Tokyo Institute of Technology, Japan. His wide range of research interests in theoretical and functional areas include applied probability, stochastic processes, financial engineering, e-marketing, information technology, production and logistics systems, and organizational theory. He is author of more than 150 papers in leading archive journals in such areas.
Umesha Perera has a B.Sc. in computer science from the University of Colombo, Sri Lanka, and a master’s degree in business administration from the University of Tsukuba, Japan. She is currently a Ph.D. student under the supervision of Ushio Sumita. Her research centers on e-WOM, marketing research related to smartphone applications, and big data analysis. She has 7 years’ experience as a software engineer.
Charolina Ventiana Dewi is an IT professional who specializes in delivering enterprise-wide integrated solutions as well as business process re-engineering. She has more than five years of experience in Oracle E-Business Suite applications and Oracle Technologies. She received her B. Eng. in industrial engineering from Bandung Institute of Technology in 2006 and her MBA degree from the University of Tsukuba in 2014.