Synthesis And Some Physical Properties Of
Magnetite (Fe
3
O
4
) NP
S
Ahmed N. Abd Physics Department, Science
Faculty,
University of Al- Mustansiriyah, Baghdad, Iraq
Duha M.A. Latif
Physics Department, Education Faculty,
Baghdad University, Baghdad, Iraq
Wasna'a M. Abdulridha Basic Science Department,
University of Al- Kufa, Najaf, Iraq
Corresponding author, E-mail: [email protected]
Abstract—In this study , (Fe3O4) thin film which prepared by chemical method and deposited by drop casting technique on glass. The structural ,optical and chemical analysis have been investigated . X-ray diffraction (XRD) measurements relieve that the (Fe3O4) thin film was single crystalline, cubic structure and there is no trace of the other material. UV-Vis measurements reveal that the energy gap of (Fe3O4) thin film was found 2.2 eV. The Fourier Transform Infrared Spectroscopy (FTIR) spectrum of (Fe3O4) thin film shows the O–H in plane and out of plane bonds appears at (1583.45 – 1481.23 and 935.41–838.98)cm-1and absorption band Fe–O bonds in the crystalline lattice of Fe3O4 .
Keywords—Thin film; XRD; Fe3O4; energy gap; drop casting.
1. Introduction
Many authors prepared Magnetite and study its different properties, but still Magnetite inspires researcher's new researchable ideas, this due to its characteristics, which has a great significance in various fields, especially, when this material in a
nanosize. For example, Magnetite (Fe3O4)
nanoparticles have attracted much interest not only in the field of magnetic recording media such as audio, videotape, high-density digital recording disks, magnetic fluids and data storage, but also in the areas of medical care such as drug delivery systems (DDS),
medical applications, including radio-frequency
hyperthe-rmia, photomagnetics, magnetic resonance imaging (MRI), medical diagnostics, cancer therapy, microwave devices, magneto-optics devices, sensors, high frequency applications, catalysis and magnetic sensing [1-11].
2. Experimental
In a typical procedure, 1.5g of Fe(NO3)2 ,
179.8548 g/mol Molar mass (BDH Chemicals Ltd Pool England) was dissolved in 50ml of PVP (Sigma Aldrich USA) 1WT. % and Re-distilled water was used throughout the experiment. The solut-ion was added into a round-bottom flask with stirring. The color of the
suspension was kept at 75 °C for 1 h. After cooling to room temperature, the particles were separated by centrifugation and were washed with distilled water to remove any contaminations.
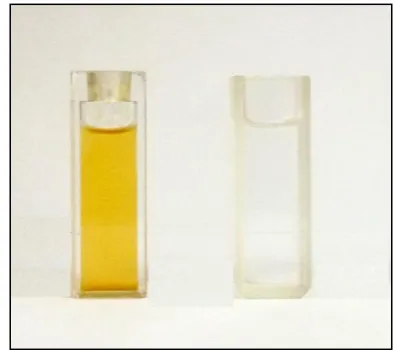
Fig.1: Fe3O4 freshly colloidal nanoparticles(left)
which are prepared by chemical method and the solution(right)
Figure 2 shows that Fe3O4 colloidal nanoparticles
nano-particles. The absorption of the colloidal nanoparticles solution was measured by using UV–Vis double beam spectro-photometer (CECIL, C. 7200, France).
3. Results and discussion
The precipitated fine particles were characterized by XRD for structural determination and estimation of crystallite size. XRD can be used to characterize the crystallinity of nano-particles, as well as the average
nanoparticles diameter. The lattice constant
)
a(
wasfound to be 8.310 A, which was compared with the
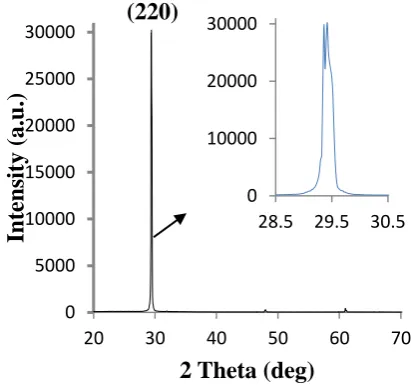
lattice parameter for the magnetite of 8.39. Finally, the analysis of the diffraction pattern showed the formation in the sample of a cubic phase structure, due to the strongest reflection that proceeds from the(220) plane (Fig.3).The peak indexed as plane (220) corresponded to a cubic unit cell, characteristic of a cubic structure. Therefore, it was confirmed that the crystalline structure of obtained mag-netite nanoparticles, agreed with the structure of an inverse phase type oxide. Crystallite size measurements were determined from the full-width at half maximum (FWHM) of the strongest reflection of the (220) peak, using the Scherrer approximation, which assumes the small crystallite size to be the cause of line broadening (Equation 1):
Here, GSis the crystallite mean size, A is a shape
function for which a value of 0.9 is used, λ is the
wavelength of the radiation, β the full width at half
maximum (FWHM) in radians in the 2θ scale, and θ
the Bragg angle. The crystal size calculated were (56.61 and 111.22)nm. Due to the broad diffraction pattern lines, it can be said that particles have average size about of nanometers scale ; therefore,
Also, it can be seen that, the site and intensity of the diffraction peak are consistent with the standard pattern for JCPDS Card No. (79 - 0417) Magnetite - synthetic. The sample show broad peak, indicating the ultra-fine nature and small crystallite size of the particles.
Fig.3: XRD pattern of (Fe3O4) thin film which
prepared by chemical method and deposited by drop casting technique on glass
The microstrain value ‘’ and the dislocation
density ‘σ’ was evaluated by using the following relations [13, 14]:
The strain and dislocation density of Fe3O4
nanoparticles films chemical reaction were around
5.85 and 3.39 1014 1ines/m2 respectively.
The transmittance characteristics can be a valuable tool for analyzing nanostructure.
Table 1: powder X-ray diffraction data of (Fe3O4)
thin film
2 Theta (deg) β (deg) GS (nm) σ lines/m2 ₓ1014 ₓ 10-4
29.44 0.138 56.610 3.12 5.85
29.60 0.080 111.26 0.80 3.39
Figure 4 shows the transmittance spectrum of
(Fe3O4) thin film. The data are corrected for glass
transmission in UV region. The transmittance is sharply increasing above ~ 600 nm due to a wide distribution of particlessize.
0 5000 10000 15000 20000 25000 30000
20 30 40 50 60 70
Intens
it
y
(a.u.)
2 Theta (deg)
(220
(220)
0 10000 20000 30000
Fig.4: Transmittance spectrum of (Fe3O4) thin film
which prepared by chemical method and deposited by drop casting technique on glass.
Therefore using the fundamental relation of photon transmission and absorbance, the absorbance (A) is defend as the logarithm (base 10) of the reciprocal of the transmittance :
If T is the transmittance and A is the absorbance of
the (Fe3O4) thin film which prepared by chemical
method and deposited by drop casting technique on glass. The reflection of the film has been found by using relationship :
The reflection of the (Fe3O4) thin film increases
with increasing the wavelength above 600 nm after that there is about 0.2 as shown in figure 5 due to stability in transmittance .
Fig.5: Reflection spectrum of (Fe3O4) thin film
which prepared by chemical method and deposited by drop casting technique on glass.
From the reflection R of the thin film, the refraction
index can be calculated from the following relationship :
√ √
Figure 6 shows the refraction index of the (Fe3O4)
thin film which prepared by chemical method and deposited by drop casting technique on glass which is
Fig.6: Reflectance index spectrum of (Fe3O4) thin
film which prepared by chemical method and deposited by drop casting technique on glass.
The optical absorption coefficient α was evaluated
by tauc relation
where t is the film thickness, hv is the photon energy,
and n= 0.5 for allowed direct transition.
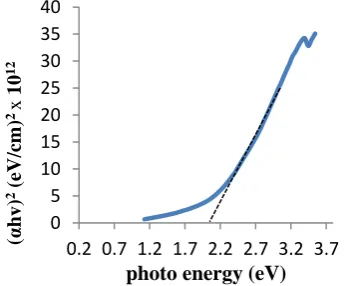
Plotting the graph between (αhv)2 versus photon
energy (hv) gives the value of direct band gap. The
extrapolation of the straight line to (αhv)2= 0 , gives
the value of band gap , shown in figure 7.The optical band gab is 2.2 eV , in other word , the exactions wavelength ~ 516 nm . this results is very important to
relieve that the (Fe3O4) thin film can be use in solar
cell device .
Fig.7: (αhv)2
versus photon energy plot of (Fe3O4)
thin film which prepared by chemical method and deposited by drop casting technique on glass.
The optical conductance is obtained using the relation ,
Where σ is the optical conductance , c is the velocity of the radiation in the space , n is the refractive index and α is the absorption coefficient .Figure 8 shows the relation between the optical
conductivity and photon energy for (Fe3O4) thin film.
Figure 8 shows the optical conductance increases at 0
10 20 30 40 50 60
400 525 650 775 900
T
ransm
it
tance
Wavelength (nm)
0 0.1 0.2 0.3
400 500 600 700 800 900
Reflec
tio
n
Wavelength (nm)
1.25 1.3 1.35 1.4 1.45 1.5 1.55
400 500 600 700 800 900
Refrac
tiv
e
index
Wavelength (nm)
0 5 10 15 20 25 30 35 40
0.2 0.7 1.2 1.7 2.2 2.7 3.2 3.7
(α
hv
)
2 (eV
/c
m)
2 x
10
12
Fig.8: Optical conductivity of Fe3O4 thin film as a
function of photon energy.
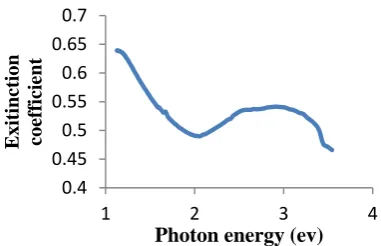
The extinction coefficient (k) can be determine by
using the relation , , where is the wavelength
of light. The maximum value (peak) is 0.64 and the minimum is 0.5 (valley) is about 5.2 as shown in figure 9 .
Fig.9: Extinction coefficient of Fe3O4 thin film as a
function of photon energy.
Fourier Transform Infrared Spectroscopy (FTIR) spectra was performed to the dried sample of
magnetite using a FTIR – Shimadzu 8400
spectrophotometer in wave range of (4000 – 600) cm-1
with a resolution of 4 cm-1 .The dried sample was
placed on a silicon substrate transparent to infrared, and spectra were measured according to the transmittance method.
FTIR spectrum in figure 10 shows that the H-O-H
bending vibration at about 1000 - 1600 cm-1 , typical of
the HO molecule, is less intense. Additionally, the
second absorption band, between (900-1000)cm-1,
corres-ponds to bending vibration associated to the O – H bond. The O–H in plane and out of plane bonds appears at (1583.45–1481.23 and 935.41– 838.98)cm
-1
,respectively [15]. For strong hydrogen bridges its maximum lies at about 900-1000 cm . These first two bonds correspond to the hydroxyl groups attached by the hydrogen bonds in the iron oxide surface, as well as the water molecules hemically adsorbed to the magnetic particle surfaces. In the spectrum showed figure 10, the sample exhibits two intense peaks, in
(582 and 640)cm-1 bonds, that are due to the
stretching vibration mode associated to the
metal-oxygen absorption band (Fe – O bonds in the
crystalline lattice of Fe3O4 ) [16].They are
these regions, the contributions from the 4 stretching vibration bonds related to metal in the octahedral and tetrahedral sites of the oxide structure are found. Moreover, the FTIR spectrum shows an absorption
bond at 1706 cm-1 , which presents the stretching
vibration of the carboxyl group (C = O), associated to the oleic acid molecule, adsorbed on to the surface of the crystallites.
Summarizing, magnetite nano-particles have
crystalline structure of inverse spinel type, and FTIR
absorption spectroscopy allowed identifying
characteristic features of the spinel structure, as well as a presence of certain types of chemical substances adsorbed on the surface of nanoparticles [15,16].
Fig.10: FTIR spectra Fe3O4 thin film as a function
of wavenumber .
4. Conclusions
The synthesized (Fe3O4) thin film by chemical
method had minimum nanosized is around 56.61 nm and the optical properties revealed that the energy gap of (Fe3O4) thin film indicated to the effect of
quantum size. X-ray diffraction (XRD) exhibits spectrum that the (Fe3O4) are monocrystalline by
splitting the orientation (220) plane in tow peaks. FTIR measurements shows that the absorption bond Fe–O bonds in the crystalline lattice of Fe3O4 .
References
1. Juliana B. Silva, Walter de Brito, Nelcy D.S.
Mohallem, Materials Science and Engineering B. 112
(2004) 182.
2. S. Sun, C.B. Murray, D. Weller, L. Folks, A.
Moser, Science 287 (2000) 1989.
3. S. Sun, Adv. Mater. 18 (2006) 393.
4. Q.A. Pankhurst, J. Connolly, S.K. Jones, J.
Dobson, J. Phys. D Appl. Phys. 36 (2003) 167.
5. T. Neuberger, B. Sch
ِ
pf, H. Hofmann, M.Hofmann, B. von Rechenberg , J. Magn. Magn. Mater.
293 (2005) 483.
6. D. Portet, B. Denizot, E. Rump, J.J. Lejeune, P.
Jallet, J. Colloid Interface Sci. 238 (2001) 37.
7. A. Ito, M. Shinkai, H. Honda, T. Kabayashi, J.
Biosci. Bioeng. 100 (2005) 1.8. X. Meng, H. Li, J.
Chen, L. Mei, K. Wang, X. Li, J. Magn. Magn. Mater.
321 (2009) 1155.
9. Z. Zi, Y. Sun, X. Zhu, Z. Yang, J. Dai, W. Song,
J. Magn. Magn. Mater. 321 (2009) 1251. 0
20 40 60
1 1.4 1.8 2.2 2.6 3 3.4 3.8
Opt ic al cond uctivity , σ x 10
12 (sec -1)
Photon energy (eV)
0.4 0.45 0.5 0.55 0.6 0.65 0.7
1 2 3 4
Exitinction coef
fici
ent
Photon energy (ev)
25 45 65 85 600 1400 2200 3000 3800
T
ransm
it
tance
%
10. L.X. Phua, F. Xu, Y.G. Ma, C.K. Ong, Thin
Solid Films, Thin Solid Films. 517 (2009) 5858.
11. E. Kashevsky, V.E. Agabekov, S.B.
Kashevsky, K.A. Kekalo, E.Y. Manina, I.V. Prokhorov,
V.S. Ulashchik, Particuology 6 (2008) 322.
12. Bragg W.L. Nature. 95 (1915) 561.
13. P.A. Chate, D.J. Sathe, P.P. Hankare,
Electrical and crystallo-graphic properties of
nanocrystalline CdSe 0.5S0.5 composite thin films
deposited by dip method. J. Mater. Sci. Mater. Electron. 22(2011) 2, 111–115.
14. A.A. Yadav, E.U. Masmdar,
Photoelectrochemical performances of n-CdS 1-xSe
thin films prepared by spray pyrolysis technique. Sol. Energy 84(2010), 1445–1452.
15. Farmer V.C, “The Infrared Spectra Of Minerals” Ed. By V.C. Farmer Mineralogical Society, London, (1974), 18.
16. Farmer V. C. Phil. Trans. R. Soc. Lond. A. 305