Shenawy et al. World Journal of Engineering Research and Technology
TECHNICAL PERFORMANCE AND FINANCIAL ANALYSIS OF
A SMALL GRID-CONNECTED PV SYSTEM IN EGYPT
E. T. El Shenawy*, Aiat Hegazy and M. Abdellatef
National Research Centre, Solar Energy Department, El Behouth St., 12622, Dokki, Giza,
Egypt.
Article Received on 31/03/2019 Article Revised on 21/04/2019 Article Accepted on 11/05/2019
ABSTRACT
Photovoltaic (PV) is one of the important technologies which can
efficiently use the solar energy in generating electricity and can be
considered the most promising solution for the electric energy shortage
in the future. PV systems can supply electricity either for isolated loads
(stand-alone) or directly coupled to the electric networks (grid-
connected). The present paper demonstrates the technical performance and financial analysis
of a 2-kW grid-connected PV system installed in Cairo, Egypt. It gives the details of system
components, installation and operation. The paper also illustrates the measured input and
output parameters of the system for one year of operation such as solar irradiation, surface
temperatures of the PV modules and produced electrical energy. A financial analysis based
on payback period is carried out for evaluating the feasibility of these systems in Egyptian
climates. The results showed that the annual average daily electrical energy produced by the
system is 9.85 kWh/day, where the total annual generated one is about 3.37 MWh/year. The
financial analysis showed that the payback period of the grid-connected PV system is about
8.2 years, which indicates the great benefits from these systems during the long lifetime.
KEYWORDS: Solar energy; Photovoltaic system; Grid-connected installation; Photovoltaic financial analysis.
1. INTRODUCTION
The energy problems especially in the electricity sector have been raised over the world due
to the continuous increase in the world population and the promising development programs.
World Journal of Engineering Research and Technology
WJERT
www.wjert.org
SJIF Impact Factor: 5.218*Corresponding Author
Dr. E. T. El Shenawy
National Research Centre,
Solar Energy Department,
El Behouth St., 12622,
Also, the pollution associated to the expending of the conventional energy sources
encouraging the dependence on the alternative energy for electricity supply such as PV
energy (Jiaming, 2019). In addition to the clean nature of the PV energy, the high reliability,
low maintenance efforts, modularity and modern technologies increase the use of these
energies over the world (El Shenawy et al., 2017).
Electricity generation from the PV plants has grown over the past decades. From 1990, the
solar PV increased by small portion per year and the total installation reached to 3.4 GW in
2004 (Enas et al., 2016). In 2008, the PV market was increased to 16 GW and reached 22.9
GW at the end of 2009 (Hao and Yunhe, 2011). At the end of 2013, the installed global
capacity was 139 GW and the total power generated was 106.4 TWh (Yonghong et al., 2016).
In 2015, China and India added the largest PV plants in the world by 15.2 GW and 2 GW,
respectively from the total 50 GW added over the world. The total cumulative installation of
the PV systems reached 227 GW by the end of 2015 (Renu and Sonali, 2017). The installed
PV power was increased by about 97 GW, by the end of 2017. Recently, the boosted capacity
is growing up by the end of 2018 to about 104 GW (Allouhi et al., 2019). In Egypt, due to the
huge consumption of electricity resulting from high population rate and development plans,
the current energy strategy has been aiming to share about 20% of its energy from solar (PV)
and wind energies at the end of 2020. In the way of incorporating the PV energy, Egypt
started to build 20 grid connected PV power plants of 50 MW each in the region of Aswan.
Two of them were tied to the electricity grid and entered the service while the other will be
completely finished at the end of 2020.
Various silicon PV technologies have been used over the world since 1960s which can be
classified according to the efficiency and material to crystalline, thin film and multijunction
PV technologies. The crystalline PV cells can be monocrystalline or polycrystalline cells with
efficiencies ranged between 18-22%. 95% of the annual production of the PV cells from
crystalline type, while a small percentage of the total share is thin film. The concentrated PV
cells are special type of the PV technologies that use light concentration technique. This type
can be used in some areas where there are small solar irradiation levels and low ambient
temperatures (Allouhi et al., 2017). Recently, the most of development in the PV
technologies studies tend to increase the overall efficiency of the PV cells and use new
The great advantageous of the PV systems help in incorporating this technology in different
applications which can be classified into two main categories such as stand-alone and
grid-connected systems. In the stan-alone PV systems, the generated electricity can be used
directly for supplying loads at site. These systems consist of PV modules as the generator,
batteries for storage capabilities, suitable inverters and charge controllers. The system costs
are higher since the batteries should be replaced periodically for two or three times during the
lifetime of the system depending on the utilization. The off-grid PV systems can be used in
remote loads, street lighting, water pumping and other applications in rural areas (Kaundinya
et al., 2009). The other important application for the PV systems is used to generate
electricity and connect it to the electric grid as gird-connected systems. It can be used for
investment in the electricity sector or reducing the electricity bill in different installations.
Most of these systems do not use the batteries, so their capital costs are less than that of the
stand-alone ones (Kazem et al., 2017). The PV panels, inverters and electric energy meters
are the main components of the grid-connected PV systems (Shafiqur et al., 2017).
The grid-connected PV systems can be classified into three types according to the installed
PV power as follows; i) residential systems or small PV plants which are used for private or
residential applications with small power up to 5 kW, ii) commercial systems or medium PV
plants of power up to 250 kW which are used for office and industrial buildings and iii) PV
power plants for centralized power generation up to 50 MW or more (Castro et al., 2005).
Different studies were carried out to analyze the performance of the small grid-connected PV
systems for different power scales. (Ratan and Srinjoy, 2016) studied the performance of a
small grid-connected power plant of 1 kW installed in Kolkata. They concluded that the
power delivered to the grid was about 814 W for irradiation level of 1000 W/m2 and the
system efficiency differs according to the solar intensity and ranges between 12%-18%. The
performance of the same grid connected power plant of 1 kW that installed in Algeria was
analyzed by (Missoum et al., 2014). The study showed that installing 1 kW can save average
electrical energy of 4 kWh/day. In Serbia, (Dragana et al., 2015) studied the performance of a
2 kW roof top grid connected PV plant under different real climatic conditions. A comparison
study was carried out between the measured and the calculated data resulting from 3.2 kW
grid connected PV power system installed in South Africa, which showed a good agreement
between the obtained results (Okello et al., 2015). The operation of household 5 kW grid
For medium and centralized power size, performance and economic calculations were carried
out based on practical measurements for 20 kW grid connected PV plant in India (Kumar et
al., 2014). The same analysis was carried out using HOMER software for a 20 kW grid
connected PV system in Greece in terms of electrical energy and cost of energy by (Fantidis
et al. 2013). The capacity factor, final yield and performance ratio were used to simulate and
evaluate the performance of 171 kW grid connected PV plant in Crete Island (Kymakis et al.,
2009). The technical and economic performance of the centralized grid connected power
plants also was studied for 3 MW (Padmavathi and Arul, 2013) and 5 MW (Sundaram and
Babu, 2016) PV plants in India for two years 2011-2012. The results indicated that the
measured results are close to that of the predicted using RETscreen program and the average
annual generated energy was about 1.37 MWh per kW. In India also, the simulated results
using PV-GIS program were compared to that obtained from the real measurements for the
10 MW PV grid connected plant installed at Ramagundam by (Kumar and Sudhakar, 2015).
(Cheikh et al., 2016) studied the performance of the first bigger 15 MW grid connected PV
plant in Mauritania to supply a small percentage up to 10% of the required electric energy of
Nouakchott. The biggest centralized PV power plant of 750 MW coupled with the electric
network of Pakistan was introduced and analyzed by (Zafar et al., 2016).
The present paper introduces technical and financial analysis of the small grid connected PV
power plant of 2 kW installed for research purposes at Solar Energy Department, NRC,
Cairo, Egypt. The study shows the plant installation and orientation according to the
geographic location. Using the measured data from the plant for about one year, the
performance can be analyzed to evaluate the plant output. The financial analysis in terms of
payback period is carried out using the actual prices of the plant components in addition to
installation, maintenance and operation costs taking into consideration the current price of
electricity and the expected increase in Egypt.
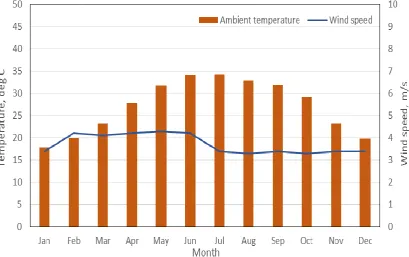
2. Input solar radiation
The performance of any solar system is mainly affected by the amount of input solar
radiation incident on its surface, which in turn is a function of system location and
orientation. Cairo is a capital of Egypt located at the northern hemisphere and lies at
longitude of 31.24o East of zero meridian line and latitude of 30.04o North of equator. The
weather data related to the monthly average ambient temperature and wind speed through the
o
C in summer (May, June, July, August and September) and decreases than 20 oC in winter
(January, February and December). Generally, July is the warmest month, while January is
the coolest one. The mean monthly wind speed ranges between 3.3 – 4.3 m/s. The rainy
season is in winter and the maximum rainy months are December and January which are
more than 5 rainy days per month.
Solar radiation in terms of sunshine hours as monthly average in Cairo is plotted in Figure 2.
From the figure, we can see that the mean sunshine hours increased from more than 200
hours in winter reaching to its maximum of more than 350 hours in summer giving annual
sunshine hours in the range of 3300-3600 hours, which can be considered one of the largest
annual sunshine rates in the world. This result, since Egypt lies in the world Sunbelt, that
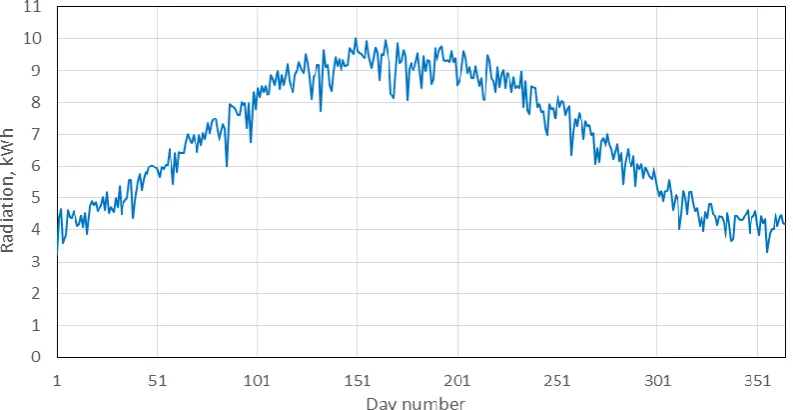
ensures large sunshine hours and high solar irradiation levels. The measured solar irradiation
energy on a horizontal surface in kWh/m2/day through the year in Cairo is plotted in Figure 3.
The figure represents the daily solar energy incident on a horizontal surface in Cairo that
reaches more than 4 kWh/m2/day in winter compared to high levels in summer recording 10
kWh/m2/day. This arises because the sunshine hours reach more than 11 and 8 hours for
typical days in summer and winter, respectively. Also, the instantaneous irradiation level at
noon on a horizontal surface reaches to 1000 W/m2 in summer and about 800 W/m2 in winter.
Figure 2: Monthly average sunshine hours through the year in Cairo.
Figure 3: Measured solar irradiation energy on a horizontal surface through the year in Cairo.
As the amount of solar energy incident on any surface is affected by the geographic location,
it is also affected by the system orientation in terms of facing (with respect to south or north)
and tilting (with respect to horizontal) (Laib et al., 2018). In the northern hemisphere, the
solar system must be facing south to capture the maximum solar irradiation. Deviation from
south direction can reduce the amount of incident solar energy on the system depending on
the location and degree of deviation (El Shenawy et al., 2017). Also, tilting the solar system
by a certain angle over the horizontal surface (equals to the site latitude ± 2o) can collect
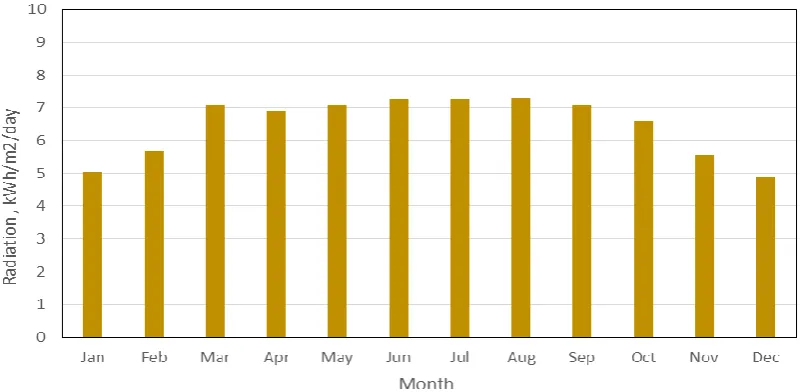
Figure 4 shows the measured monthly average solar irradiation energy incident on an
optimally tilted surface of 30o in Cairo through the year. From the figure, it can be seen that
the daily solar irradiation energy captured in winter increased for the tilted surface (Figure 4)
than that of the horizontal one by about 20% (Figure 3) due to the high sun altitude angles in
winter. In summer, the small tilt angle can capture more irradiation energy than the optimal
tilted one. Generally, tilting the solar system by 28-30o in Cairo (latitude of 30.04o) increases
the total yearly solar energy captured by about 10% over that of the horizontal one and
capture an average annual daily solar irradiation of 6.48 kWh/m2/day.
Figure 4: Measured monthly mean solar irradiation energy on the optimal tilted surface in Cairo through the year.
3. Grid connected PV system configuration
The grid connected PV power system of 2 kWp is installed in SED, NRC for research
purposes. The system consists of 2 kW PV modules and on-grid inverter of 1900 W in
addition to the energy meter with switching and control facilities. Figure 5 shows a schematic
diagram of the grid connected PV system.
3.1. PV panels
The grid connected PV system consists of eight PV modules of 250 W each. The PV module
consists of 60 polly-crystalline solar cells with efficiency up to 19%. The cells are connected
electrically to form the required module power. The apparent efficiency of the PV module is
15% which is less than that of the single cell due to the electrical losses between cells in the
module. Each PV module has its own ionized type frame of aluminum to withstand the
extreme operating conditions expected for operation. The module front surface has covered
with a white tempered glass with high resistance to avoid scratches. The back side of the
module is made from EVA plastic for heavy loads. Table 1 gives the technical and
mechanical specifications of the PV modules at standard test conditions (STC) and Figure 6
indicates the current-voltage and power-voltage characteristics of the PV module at STC. The
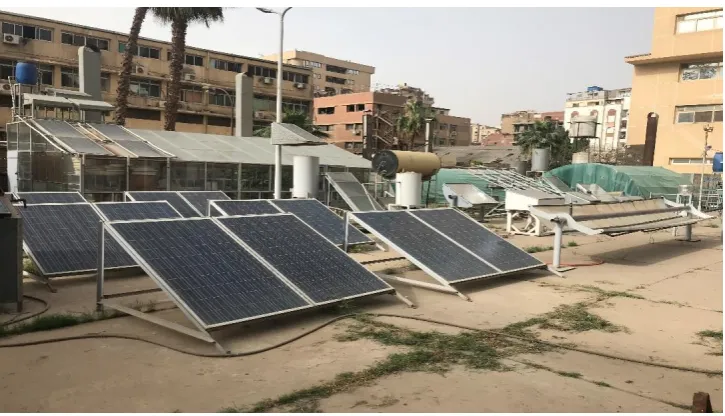
modules are installed on a mechanical support made from ionized steel to withstand the
weight of the PV modules and wind loads in all environmental conditions. The mechanical
support of the PV modules is inclined by tilt angle of 30o over the horizontal plane to capture
the maximum solar energy through the year. Figure 7 shows the installed PV system in the
test field of SED.
Table 1: Technical and mechanical specifications of the PV modules at STC*.
Item Specifications
Rated power Rated voltage Rated current
Voltage at open circuit Current at short circuit VOC temperature coefficient
ISC temperature coefficient
System voltage Dimension Weight 250 30.5 8.17 37.4 8.80 - 0.320 + 0.053 1000 166.7x99.7x0.47 20.1 W V A V A %/oK %/oK
V cm
kg
*
Figure 6: Current-voltage and power-voltage characteristics of the PV module at STC.
Figure 7: The installed PV system in the test field of SED.
3.2. Grid connected inverter
The inverter in the grid connected PV system is used mainly for converting the DC electrical
signal produced by the PV module into AC signal to match the grid utility. Also, it makes the
required synchronization between the grid signal and that of the generated from the PV
system for ideal matching. An on-grid single phase inverter of 1900 W rated power is used in
the system to make the required conversion of the generated power and ensure save coupling
to the grid. Table 2 shows the inverter technical specifications. The inverter uses a galvanic
isolation to isolate the PV modules from the utility power. It also uses a microcontroller
delivering the maximum power to the grid all the time. At night, the inverter keeps minimum
consumption of electric energy due to keeping the components in sleep mode. The inverter
has a protection capability against over load, over temperature, reverse polarity of the input
and module disconnection.
Table 2: Inverter technical specifications.
Item Specifications
DC input voltage Rated DC input voltage Disconnection voltage Rated input current Maximum input power DC connection
Rated AC output power Grid AC voltage
Grid type Grid frequency
Rated AC output current Power factor MPPT Efficiency Inverter efficiency Ambient temperature Dimension Display 80-400 300 50 16 2200 2 1840 190-265 L/N 57.2-62 8 (at 230 V)
> 0.95 99% 95% -25 to 60 35.1x54.2x14 LED display V V V A W Lines W V Hz A o C cm
According to the inverter input ranges in Table 2, the eight PV modules are connected in
series forming one string that has open circuit voltage of 299.2 V and maximum operating
current of 8.17 A. The energy meter is located in the system between the inverter and the grid
network to measure the energy delivered to the grid from the PV system. Switching and
protection facilities are used in the system to turn the system components on and off or for
electrical protection, respectively.
4. RESULTS AND DISCUSSIONS
The PV system was installed and operated for more than one year ago and the important
parameters were measured and stored using a data acquisition system which has the required
sensors and transducers. The instantaneous solar radiation is measured at the surface of the
PV modules using a Kipp-Zonen pyranometer that converts the instantaneous solar
irradiation value to a small electrical signal which can be amplified and estimated. The PV
module surface temperature is recorded using K-type thermocouple and amplification circuit.
transducers embedded in the data acquisition system. The delivered AC energy to the utility
grid is measured using a special energy meter recording the accumulation of electrical energy
in kWh. The inverter software records all the generated electricity in daily and accumulation
basis and also detects the fault signals in case of fault occurring.
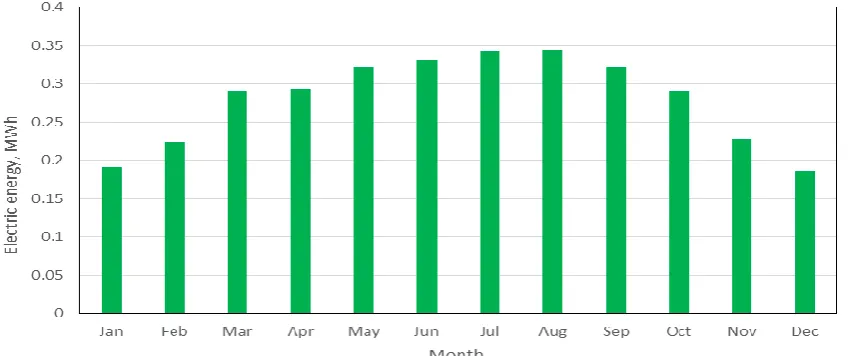
Figure 8 elucidates the total monthly generated electrical energy in MWh over the year. It is
clear that the system generates more than 0.3 MWh/month of electrical energy in summer
months while the output decreases to about 0.2 MWh/month in winter. The total annual
electrical energy delivered by the system is about 3.37 MWh/year, which is corresponding to
4.93 kWh/kWp. The monthly generated electrical energy with the daily solar irradiation
levels is plotted in Figure 9. The figure illustrates that the generated electrical energy
increases with the daily irradiation energy. When the daily irradiation falls under 5
kWh/m2/day, the generated electrical energy is under 200 kWh/month, while it increases
more than 300 kWh/month when the irradiation levels reach more than 7 kWh/m2/day. Figure
10 dedicates the monthly mean daily system efficiency through the year. The apparent
efficiency of the PV module is 15% as shown before, while the figure shows that the overall
system efficiency is smaller due to some parameters such as dust, losses and higher ambient
temperatures. The system efficiency is ranged from 11.5% in summer to 13.8% in winter due
to the effect of the considerably higher surface temperatures of the PV modules in summer
season. The surface temperature of the PV modules at noon in summer is higher than that of
the winter by more than 25 oC, due to the higher ambient temperatures and solar irradiation
levels in summer. Figure 11 shows the surface temperatures of the PV modules in summer
and winter.
Figure 9: Monthly generated electrical energy with the daily solar irradiation levels.
Figure 10: Monthly mean daily system efficiency through the year.
5. Financial analysis
The financial analysis helps the investors and decision makers to take the correct action about
the investment in producing the electrical energy from PV power systems. To evaluate the
benefits from installing such grid connected PV systems, different economic measures were
used such as life cycle value, net present cost, internal rate of return, ratio of saving to
investment and payback period (Kasra et al., 2018). The payback period is a simple way to
evaluate the grid connected system which refers to the time in years needed to get back the
total investment of the system, or the time required to start capturing benefits from the system
after reaching the point of break even. To calculate the payback period, we sum the system
total initial costs, including PV panel, inverter and other installation costs, to the annually
required costs such as operating and maintenance cost (O&M) and compare the resulted sum
with the annual income from the system to get the required period to equal the total system
costs to its income. For acceptable systems, the payback period should be shorter than the
total lifetime of the PV system. The payback period can be calculated using the following
relation (Moien et al., 2018);
(1)
(2)
(3)
Where: Ii is the initial total investment of the system, Rn is the income in time period n, In is
the investment in time period n, N is the life time of the system, Egn is the generated
electricity in time period n in kWh, CEo is the initial electricity price in c$/kWh, r is the
annual increase of the electricity price, i is the inflation rate, Io initial annual investment and d
is the discount rate.
The cost of the grid connected system includes the cost of the initial, installing and M&O. the
initial costs are the costs of all components such as PV modules and the inverter, while the
installing costs including that required for mechanical structure, cables, switching &
protection facilities and metering. The O&M costs gather all costs needed for spare parts,
cleaning of PV modules and other required maintenance. The system costs can be considered
as follows;
- The PV cost is the main parameter affecting on total capital cost of the system. The PV
$ per 2-kWp). It should be noted that the life time of the PV panels in the range of 25 years
(as dedicated by the data sheet of the PV modules).
- The total purchasing cost of the single phase on-grid inverter is about 555 $. The inverter
lifetime is about 13-15 years; accordingly, it should be replaced one time more over the
lifetime of the system.
- Installation costs including the mechanical structure, wiring, switching, protection and the
energy meter (net metering) can be taken as 8.5% of the PV cost (Kasra et al., 2018; Moien et
al., 2018).
- Annual operating and maintenance (O&M) cost is taken as 2% of the PV cost (El Shenawy
et al., 2017).
- Inflation and discount rates are taken as 4% and 8%, respectively (El Shenawy et al., 2017).
- Grid electricity price is detected according to the monthly consumption. Table 3 tabulates
the electricity consumption price during the last three years in Egypt. It must be noted that the
price is annually increased by different ratios according to the category of the monthly
consumption. The energy meter used in the PV system is a net metering device, which makes
the price of the generated kWh by the PV system is equal to the used one by the consumer,
shown in Table 3.
Table 3: Electricity prices in Egypt for household through 2017-2019.
Energy consumed Electricity price Annual increase
2017 2018 2019
2018 2019
kWh c$/kWh c$/kWh c$/kWh
0-50 51-100 0-200 201-350 351-650 651-1000 0- > 1000
0.61 1.06 1.17 2.33 3.06 5.28 5.83 0.72 1.22 1.5 3.06 4.17 6.94 7.5 1.22 1.67 2 3.89 5 7.5 8.06 18% 16% 29% 31% 36% 32% 29% 69% 36% 33% 27% 20% 8% 7%
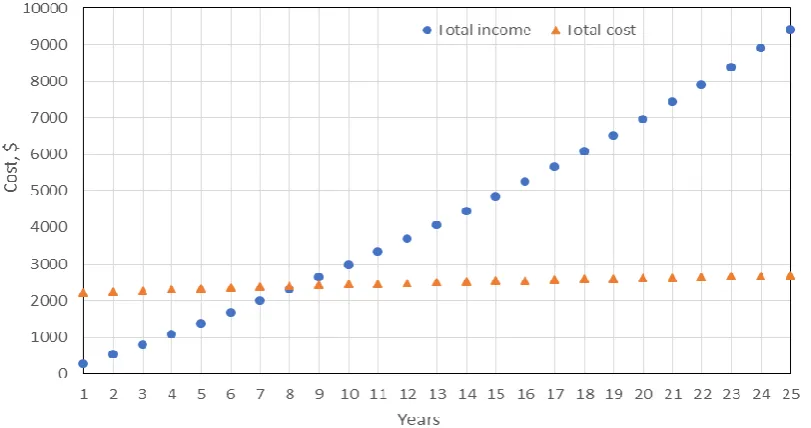
According to the total initial cost of the grid connected system, annual O&M costs, the
electricity price, inflation and discount rates taken above, Figure 12 illustrates the total
income and the total system cost through the lifetime of the grid connected system.
Obviously, the total system cost increase annually due to the O&M costs including the spare
parts of inverter and other small accessories, while the annual income from exporting
electricity to the grid as measured by the net-metering device increases annually according to
through the lifetime of the grid connected system is plotted in Figure 13. It can be seen that
the total cost of the grid connected system is less than that of the income from the system in
the first years and this difference is annually decreased till the break-even point of the system
in which the total system costs equal to the total income from the system. After that, the
system starts to get benefits through the lifetime. Figures 12&13 show that the payback
period is about 8.2 years, which can be considered small compared to other countries due the
high solar irradiation levels in Egypt, which encourages the development planes to take into
considerations these kind of systems for generating green electricity.
Figure 12: Total income and total cost through the lifetime of the grid connected system.
6. CONCLUSIONS
The present paper described the technical performance and financial analysis of a 2 kW grid
connected PV system installed in Cairo, Egypt. It gives the details of the site parameters in
terms of ambient temperatures, sunshine hours, wind speed and solar irradiation levels on
horizontal and optimal tilted surface. The grid connected system consisted of 8 PV modules
of 250 W each, grid connected inverter of 1900 W, energy meter and other installation
components such as wiring, switching and controlling. The PV modules are installed on a
mechanical structure tilted by 30 deg on the horizontal surface. The annual average daily
electric energy generated by the system was 9.85 kWh/day, while the annual generated
energy was 3.37 MWh/year. The financial analysis using payback period method was carried
out taking into account all initial and M&O costs of the system in addition to the electricity
price showed that the system payback period was 8.2 years, while the life time of the system
is 25 years.
REFERENCES
1. Jiaming Li (2019), ―Optimal sizing of grid-connected photovoltaic battery systems for
residential houses in Australia‖. Renewable Energy, 136: 1245-1254.
2. El Shenawy E T, Hegazy A H and Abdellatef M (2017), ―Design and optimization of
stand-alone PV system for Egyptian rural communities‖. International Journal of Applied
Engineering Research, 12(20): 10433-10446.
3. Enas R Shouman, El Shenawy E T and Khattab N M (2016), ―Market financial analysis
and cost performance for photovoltaic technology through international and national
perspective with case study for Egypt‖. Renewable and Sustainable Energy Reviews, 57:
540–549.
4. Hao Wu and Yunhe Hou (2011), ―Recent development of grid-connected PV systems in
China‖. Energy Procedia, 12: 462-470.
5. Yonghong Kuang, Yongjun Zhang, Bin Zhou, Canbing Li, Yijia Cao, Lijuan Li and Long
Zeng (2016), ―A review of renewable energy utilization in islands‖. Renewable and
Sustainable Energy Reviews, 59: 504-513.
6. Renu Sharma and Sonali Goel (2017), ―Performance analysis of a 11.2 kWp roof top
grid-connected PV system in Eastern India‖. Energy Reports, 3: 76–84.
7. Allouhi A, Saadani R, Buker M S, Kousksou T, Jamil A and Rahmoune M (2019),
technologies of PV grid-connected systems under different climates‖. Solar Energy, 178:
25–36.
8. Luo W Khoo, Hacke Y S, Naumann P, Lausch V, Harvey D and Ramakrishna S P (2017),
―Potential-induced degradation in photovoltaic modules: a critical review‖. Energy &
Environmental Science, 10(1): 43–68.
9. Chandrakant Dondariya, Deepak Porwal, Anshul Awasthi, Akash Kumar Shukla,
Sudhakar K, Murali Manohar S R and Amit Bhimte (2018), ―Performance simulation of
grid-connected rooftop solar PV system for small households: A case study of Ujjain,
India‖. Energy Reports, 4: 546–553.
10.Kaundinya D P, Balachandra P and Ravindranath N H, (2009), ―Grid-connected versus
stand-alone energy systems for decentralized power—a review of literature‖. Renewable
and Sustainable Energy Review, 13(8): 2041–2050.
11.Kazem H A, Albadi M H, Al-Waeli A H, Al-Busaidi A H and Chaichan M T (2017),
―Techno-economic feasibility analysis of 1 MW photovoltaic grid connected system in
Oman‖. Case Study of Thermal Engineering, 10: 131–141.
12.Shafiqur Rehman, Ahmed M A, Mohand H. Mohamed and Fahad A. Al-Sulaiman (2017),
―Feasibility study of the grid connected 10 MW installed capacity PV power plants in Saudi Arabia‖. Renewable and Sustainable Energy Reviews, 80: 319–329.
13.Castro M, Delgado A, Argul F G, Colmenar A, Yeves F and Peire J (2005), ―Grid
connected PV buildings analysis of future scenarios with an example of Southern Spain‖.
Solar Energy, 79: 86–95.
14.Ratan Mandal and Srinjoy Panja (2016), ―Design and feasibility studies of a small-scale
Grid Connected Solar PV Power Plant‖. Energy Procedia, 90: 191 – 199.
15.Missoum M, Hamidat A, Loukarfi L and Abdeladim K (2014), ―Impact of rural housing
energy performance improvement on the energy balance in the North-West of Algeria‖.
Energy Build, 85: 374–88.
16.Milosavljević Dragana D, Pavlović Tomislav M and Piršl Danica S (2015), ―Performance
analysis of a grid-connected solar PV plant in Niš, republic of Serbia‖. Renewable and
Sustainable Energy Review, 44: 423–435.
17.Okello D, Van DEE and Vorster F J (2015), ―Analysis of measured and simulated
performance data of a 3.2 kWp grid-connected PV system in Port Elizabeth, South
18.Hartner M, Mayr D, Kollmann A and Haas R (2017), ―Optimal sizing of residential
PV-systems from a household and social cost perspective. A case study in Austria‖. Solar
Energy, 141: 49–58.
19.Kumar K A, Sundareswaran K and Venkateswaran P R (2014), ―Performance study on a
grid connected 20 kWp solar photovoltaic installation in an industry in Tiruchirappalli
(India)‖. Energy for Sustainable Development, 23: 294-304.
20.Fantidis J G, Bandekas D V, Potolias C and Vordos N (2013), ―Cost of PV electricity –
Case study of Greece‖. Solar Energy, 91: 120–130.
21.Kymakis E, Kalykakis S and Papazoglou T M (2009), ―Performance analysis of a grid
connected photovoltaic park on the island of Crete‖. Energy Conversion and
Management, 50: 433–441.
22.Padmavathi K and Arul S D (2013), ―Performance analysis of a 3 MWp grid connected
solar photovoltaic power plant in India‖. Energy and Sustainable Development, 17:
615–625.
23.Sundaram S and Babu J S C (2016), ―Performance evaluation and validation of 5 MWp
grid connected solar photovoltaic plant in South India‖. Energy Conversion and
Management, 100: 429–439.
24.Kumar B S and Sudhakar K (2015), ―Performance evaluation of 10 MW grid connected
solar photovoltaic power plant in India‖. Energy Report, 1: 184–192.
25.Cheikh E E S, Mamadou L N, Menny E B, Mbodji A, Ndiaye A and Ndiaye P A (2016),
―Performance analysis of the first large-scale (15 MWp) grid-connected photovoltaic plant in Mauritania‖. Energy Conversion and Management, 119: 411–421.
26.Zafar T, Zafar K, Zafar J and Gibson A A P (2016), ―Integration of 750 MW renewable
solar power to national grid of Pakistan – An economic and technical perspective‖.
Renewable and Sustainable Energy Review, 59: 1209–1219.
27.Laib I, Hamidat A, Haddadi M, Ramzan N and Olabi A G (2018), ―Study and simulation
of the energy performances of a grid-connected PV system supplying a residential house
in north of Algeria‖. Energy, 152: 445-454.
28.Caroline Housmans, Alessandro Ipe and Cedric Bertrand (2017), ―Tilt to horizontal
global solar irradiance conversion: An evaluation at high tilt angles and different
orientations‖. Renewable Energy, 113: 1529-1538.
29.Kasra Mohammadi, Mahmoud Naderi and Mohammad Saghafifar (2018), ―Economic
feasibility of developing grid-connected photovoltaic plants in the southern coast of Iran‖.
30.Moien A. Omar and Marwan M. Mahmoud (2018), ―Grid connected PV- home systems
in Palestine: A review on technical performance, effects and economic feasibility‖.