High-resolution bathymetry using
Alvin
scanning sonar at the Southern East
Pacific Rise and its implication to the formation of collapsed lava lakes
Akiko Tanaka1, Severine Rosat1,2, Kiyoyuki Kisimoto1, and Tetsuro Urabe1,3
1Geological Survey of Japan, AIST, Tsukuba Central 7, 1-1-1 Higashi, Tsukuba, Ibaraki 305-8567, Japan 2Ecole et Observatoire des Sciences de la Terre, Strasbourg, France
3Department of Earth & Planetary Science, University of Tokyo, Japan
(Received September 8, 2005; Revised December 9, 2006; Accepted December 16, 2006; Online published May 7, 2007)
A high-resolution bathymetric map of a collapsed lava lake on the ridge crest of the superfast-spreading Southern East Pacific Rise was constructed. The data were acquired during the MOAI’98 Cruise using a
pencil-beam scanning sonar that was installed on the submersibleAlvin. The map covers an area of 200×350 m at
the Oasis hydrothermal site (17◦25.4S, 113◦12.3W) where low-temperature fluids are venting from a collapsed
lava lake. The collapsed lava lake is 250 m long, with a mean width of 10 m in parallel to the spreading axis
on the western flank of the ridge crest. The estimated volume of lava that has drained out is about 7000 m3
erupted from a single event. This small amount of melt and frequent contacts between “young” and “younger” flows indicate that volcanism at the superfast-spreading ridge system is characterized by frequent eruptions of very small volumes of magma.
Key words: Collapsed lava lake, scanning sonar, East Pacific Rise, hydrothermal activity, submersibleAlvin,
mid-ocean ridge.
1.
Introduction
The superfast-spreading East Pacific Rise (EPR), situated
between 13◦S and 19◦S (Fig. 1(a)), has the highest
mag-matic, hydrothermal (Urabeet al., 1995; Baker and Urabe,
1996) and biological (Maruyamaet al., 1998) fluxes of the
mid-oceanic ridges. Many studies have been carried out in
this area. A segment around 17.5◦S on the EPR is underlain
by an extremely shallow axial magma chamber (Mutter et
al., 1995) and has a peak cross-sectional area that is a proxy
for high magma supply (Scheirer and Macdonald, 1993). A large hydrothermal plume rich in volatile components, such as methane and sulfur, was observed over the area during theR/V Melvillecruise in 1993 (Feelyet al., 1994; Ishibashi
et al., 1997). This discovery led to subsequent submersible
dives at the RM24 site (17◦26S, 113◦12W) for
ground-truthing and long-term monitoring, including those with
Shinkai 6500/Yokosuka(Urabe and Lupton, 1995; Embley
et al., 1998) andAlvin/Atlantis(Urabeet al., 1999; Sinton
et al., 2002). The results of these explorations indicated that the last magmatic event occurred within several years prior to 1994 at the RM24 site where the spreading rate is as high
as 140 mm/year (Embleyet al., 1998). Black smoker
chim-neys were found during theShinkai 6500dives in 1997 on
fresh lobate lava mounds. Low-temperature diffuse vents (“Oasis site”) within an area of older sheet lava were also identified (Fig. 1(b)).
The distribution, volume and other morphological de-tails of volcanic products at mid-oceanic ridges provide
im-Copyright cThe Society of Geomagnetism and Earth, Planetary and Space Sci-ences (SGEPSS); The Seismological Society of Japan; The Volcanological Society of Japan; The Geodetic Society of Japan; The Japanese Society for Planetary Sci-ences; TERRAPUB.
portant clues to the frequency and size of eruptive events. For example, detailed bathymetric investigations on mid-oceanic ridges have suggested a relationship between the volume of magmatic events and the spreading rate (e.g. Per-fit and Chadwick, 1998). This relationship predicts that the volume of most eruptions may be small at
superfast-spreading ridges. In contrast, Embleyet al.(1998) found a
zero-age lava flow unit, 28 km in length and varying from
400 m to 2 km in width centered around 17◦26S, about
5 km south of the Oasis site. This flow unit may be a composite of several recent flows, but distinctions among flows are extremely difficult due partly to the limited num-ber of observations of the area. It is therefore useful to mea-sure the volume of single eruptions at other zero-age lava flows. However, it is hard to do so with multibeam sonar systems installed on ships due to the limitation in resolu-tion. The resolution of ship-mounted bathymetric mapping at mid-oceanic ridge depths of 2000–3000 m is typically 30–100 m, which is one to two orders of magnitude larger than that of visual observations of the seafloor from sub-mersibles. This discrepancy between bathymetric maps and observation made from a submersible makes the correlation of some geologic and volcanic features difficult. Fine-scale mapping over areas several hundreds of meters on a side is
therefore required to fill the gap. Kurraset al.(1998)
con-structed high-resolution bathymetric maps of two biologi-cally and geologibiologi-cally active areas within the axial summit
collapse trough on the EPR at 9◦49N–9◦51N using
scan-ning sonar data during 23Alvindives over a 5-year period.
They mapped 2×10⁴ m2 and 1.1×10³ m2 areas at
res-olutions of 3 m along the vertical and 5 m along the
hor-izontal axes. Chadwick et al. (2001) constructed
2600
100 200 300 400 500 600 700 800 900 1000 1100 1200 1300 1400 1500 1600 1700 1800
X [m]
Fig. 1. (a) Geometry of Pacific-Nazca plate boundary (modified after Naar and Hey, 1989). Thick and thin lines are transform faults and ridges, respectively. Solid arrows indicate rifts that appear to be currently propagating. Bold lines having arrows in opposite directions with numbers are full spreading rates in mm/year. (b) Bathymetric contour map of the study area. Gray area is the study area at the Oasis site of RM24, southern East Pacific Rise, at 17◦25.4S. Thick dotted line indicates the ridge axis.
profile 1
850 900 950 1000 1050 X (m)
2577 2585 2593 Bathymetry in meters (a)
850 900 950 1000 1050 X (m) 850 900 950 1000 1050
X (m)
(c)
Y (m)
Fig. 2. Maps of the study area at the Oasis site. (a) MESOTECH sonar soundings from sixAlvindives during the MOAI’98 cruise with dive tracklines. Deeper data are overlaid with shallower data. Thick solid, dashed and dotted lines for dive nos. 3273, 3274 and 3275, respectively, and thin solid, dashed and dotted lines for dive nos. 3277, 3278 and 3279, respectively. TheYandXaxes correspond to the north-south and east-west directions with the origin at (17◦25.080S, 113◦12.853W). (b) High-resolution bathymetry (20-cm grid) from the soundings shown in (a). Bold lines show the locations of profiles plotted in Fig. 3. (c) Map of lava morphology and hydrothermal activity constructed from observations onAlvindive nos. 3273 and 3275. Blue area denotes collapsed lava lake, pink indicates the area of sheet and/or lobate lava flows and the green and white areas are pillow lava flows with and without a dusty sediment cover, respectively. Dense colony (thick dashed line) of hydrothermal fauna is surrounded by a white sea anemone colony (dash-dot line). Note that the hydrothermal activity is limited to the central and southern parts of the collapsed lava lake.
metric maps on 2- or 4-m grids at eight locations on the Co-Axial and Cleft segments of the Juan de Fuca Ridge be-tween 1993 and 1999 using scanning sonar data to map
ar-eas from 1×10⁵ m2 to 2×10⁶ m2. The results of both
these surveys suggest that high-resolution bathymetry can be used to identify future topographic changes caused by new eruptions.
In this paper, we applied similar methods as those used by
Kurraset al.(1998) and Chadwicket al.(2001) to construct
2.
Data and Its Processing
Bathymetric data used in this paper were acquired on six Alvin dives at the Oasis site (Fig. 2(a)), using a MESOTECH sonar (Model 971). The MESOTECH sonar is a “pencil beam” scanning sonar and produces precise short-range depth profiles along the submersible track. A
scanning range of 120◦ and a step angle of 0.9◦were
cho-sen for each profile. AsAlvinmoves forward and the sonar
head sweeps from side to side perpendicular to its track, the data are collected in a zigzag pattern. Lower submersible altitudes and/or slower submersible speeds provide higher data resolution, but higher altitudes and/or higher speeds provide greater spatial coverage within a given time period. Data were usually collected at an altitude of 4 m and a for-ward speed of 0.5 knots during our surveys to map volcanic features from tens to hundreds of meter in size. This means that Alvinadvanced about 2 m during each sweep, which lasted 8 s. Each swath width was about 14 m, which gives a resolution along the scan direction of about 10 cm.
Alvin was navigated by means of a long baseline sys-tem using two transponders with fixes every 15 s.
Naviga-tion gaps were filled in based on the assumpNaviga-tion thatAlvin
moved in a straight line between fixes at a constant
veloc-ity and heading. We plottedAlvin’sposition and edited the
navigation data to remove outliers by usingAlvin’s
calcu-lated speed between fixes. The high-resolution bathymetric
data are the sum ofAlvin’sdepth, estimated from its
pres-sure sensor, and Alvin’saltitude, based on the angle and
range from the MESOTEC sonar. The bathymetry ranges in this area from about 2500 to 2650 m as determined from multibeam sonar data. We removed bathymetry outliers in the MESOTECH data outside this depth range. We plot-ted each dive track with bathymetry, and compuplot-ted depths among crossing points, and then we eliminated erroneous depths based on video observations and comparisons be-tween known sea-bottom features from other dives. Using these methods, we determined that depths from dive no. 3274 were always deeper; we consequently shifted these upwards by about 1 m to fit the depth values of other dives. We used the Generic Mapping Tools software (Wessel and Smith, 1995) to develop a grid map from the scanning sonar data. The data are filtered by the L2 norm to avoid aliasing short wavelengths. We gridded the data using a 20-cm grid cell size with continuous curvature splines in ten-sion. While the spacing of the sonar pings across the track is about 10 cm assuming an altitude of 4 m, the spacing along the track is not nearly as dense, usually a few meters. However, the detailed structures of the bottom of the de-pressions, including the lava pillars within them, can only be distinguished by this resolution of 20 cm, as shown in Fig. 3. Also, profiles across and along the collapsed lava lake reveal that bathymetry along it is relatively smoother,
and much data were acquired when Alvin’s track was
al-most parallel to it. Therefore, we chose a grid size of 20 cm to display the maximum possible detail. We used a ten-sion factor of 0.35 for steep topography data. Figure 2(b) presents the detailed bathymetric map of the Oasis site. The
spatial coverage of Alvin’s tracks was limited because the
main purpose of the MOAI’98 cruise was to recover instru-ments on the seafloor. However, observations made using
−2585
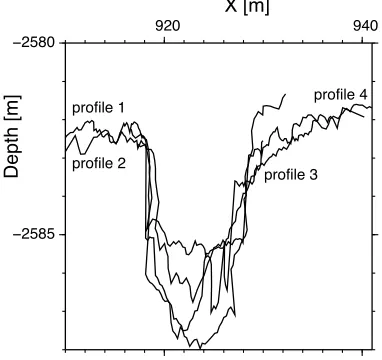
Fig. 3. Raw bathymetric profiles taken almost across the collapsed lava lake.
Alvinreveal that the central depression is 250 m in length, 10–20 m in width and approximately 5 m in depth and that
it is elongated almost parallel to the ridge axis with a 15◦N
trend.
3.
Results and Discussion
This Oasis site is characterized by extremely young lava flows containing numerous collapse pits as well as a gen-eral absence of fissures. This area was first discovered
dur-ing a Nautile dive series in 1993 (Auzende et al., 1996).
Additional observations were made in 1994 and 1997 with theShinkai 6500(Urabeet al., 1995, Embleyet al., 1998)
and in 1998 with Alvin (Sinton et al., 2002). Sinton et
al. (2002) mapped nine separate lava sequences,
includ-ing the Aldo-Kihi flow field (17◦24S–17◦34S), and,
us-ing data obtained by submersible dives and a deep-towed, 120-kHz side-scan sonar, they documented that this flow field was built up by multiple eruptive events. The Oasis
site forms part of this mapped area. Cormieret al.(2003)
targeted the drained lava lake cluster between 17◦26S and
17◦29S using developments in autonomous underwater
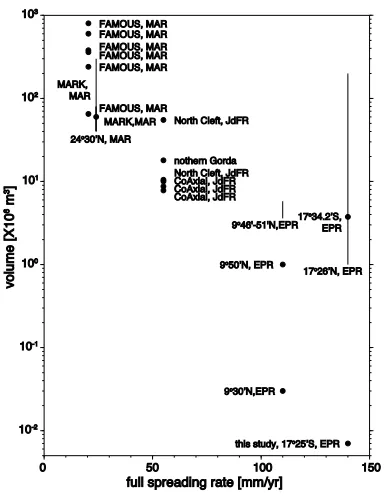
Fig. 4. The estimated volumes from individual eruptive units as a function of full spreading rate. Data from Table 1 in Perfit and Chadwick (1998), Gregget al.(1996), Embleyet al.(1998), Sintonet al.(2002) and this study (Oasis site). Gray lines show the range of estimated volumes.
dive nos. 3273 and 3275, which surveyed this area thor-oughly. The blue area denotes the collapsed lava lake, pink indicates the area of sheet and/or lobate lava flows and the green and white areas are pillow lava flows with and with-out a dusty sediment cover, respectively. A dense colony
(thick dotted line) of hydrothermal fauna, such as
Calipto-gena sp., Polychaeta, Galatheid crab, Rimicaris shrimp and vent fish, are surrounded by white sea anemone colonies (dash-dot line). There is no hydrothermal activity in the northern part of the collapsed lava lake, and the sheet flows extend obliquely downslope relative to the direction of the collapsed lava lake. This may suggest that the southern and northern parts of the lava lake might have been formed at different times. The sheet flow extends southwestward from point Y of 600, where we observed a 5-m-tall dead chimney (“Dead Chimney” in Fig. 2(c)). This distribution of sheet flow is coincident with the bathymetric high in Fig. 2(b). This location might be the center of the most recent erup-tion which fed a sheet flow that flowed westward toward the
western flank of the ridge. TheAlvinvideos show that
pil-low lavas with sediment cover are overlain by fresh sheet flow in this area. There are several active vent sites which
discharge a milky fluid of up to 6◦C in temperature in the
northern end of the Oasis site, an area called “Observatory site” (Fig. 2(c)), where we placed some long-term
monitor-ing instruments (Urabe et al., 1999). There is neither
hy-drothermal activity nor biological communities within the depressions to the northeast of “Observatory Site”. On the basis of these observations, the most recent collapsed lava lake erupted from the north-south trough, and most of the volume erupted near the “Dead Chimney” site and drained out westward downslope.
The volume of lava erupted in the depression is estimated
from the difference between the bathymetry and the pre-collapsed seafloor before the formation of the depression. The pre-collapsed seafloor is assumed to be the plane spec-ified by the constant contour line that maximizes the ratio of volume to surface area for the bathymetry. This gives a
value of about 7000 m3. It should be noted that this value is
a minimum estimate, because the following volumes were not added (1) lava that over-flowed the lava lake, and (2) the lava that remained within the collapsed lava lake. However, (1) is negligible because the observed thickness at the fringe of the recent lava flow is always less than 0.5 m in thickness and is regarded to be within the error of estimation. It is hard to estimate the volume of (2), but the sporadic occur-rence of lava pillars within the collapsed lava lake suggests that the drain-out seems to have been fast. We therefore use
7000 m3 as the erupted lava volume that filled the central
depression and drained out.
Detailed investigations at a few sites on the mid-ocean ridges since the 1980s have provided insights on the volume of recent magmatic events (Perfit and Chadwick, 1998). Figure 4 shows the relationship between the full spread-ing rate and erupted volume at mid-ocean ridges; this re-lationship suggests that the volume of typical eruptions de-creases logarithmically with increasing spreading rate. The estimated volumes from individual eruptions are based on repeated multibeam sonar surveys and detailed mapping. Our data are consistent with that obtained in previous stud-ies and is the smallest documented volume of lava erupted from a single event.
4.
Conclusions
Alvinscanning sonar data were collected during six dives
at the Oasis site, a 200×350-m area at the southern EPR
(17◦25.4S). These data were processed and combined to
make a high-resolution bathymetric map, gridded at 20 cm. The bathymetric map reveals a topography dominated by a collapsed lava lake, although some artifacts seem to remain around the depression. Near-bottom visual observations of
the seafloor from the submersibleAlvinand the bathymetry
are consistent with each other. We also estimate an erupted
volume of 7000 m3, which is consistent with that reported
in previous studies, suggesting a logarithmically linear re-lation between typical erupted volume and spreading rate.
Acknowledgments. We greatly appreciate the contributions of William Chadwick and John Sinton in providing constructive com-ments and suggestions, which improved the manuscript. We would like to thank the captain, pilots and crews of RV At-lantis/Alvinfor their support during data acquisition. The GMT (Generic Mapping Tool) system (Wessel and Smith, 1995) was used to prepare the figures. This research is supported by the Ministry of Education, Science and Technology (MEXT) through Special Coordination Funds “Ridge Flux” and “Archaean Park” projects.
References
Auzende, J.-M., V. Ballu, R. Batiza, D. Bideau, J.-L. Charlou, M.-H. Cormier, Y. Fouquet, P. Geistodoerfer, Y. Lagabrielle, J. Sinton, and P. Spadea, Recent tectonic, magmatic, and hydrothermal activity on the East Pacific Rise between 17◦S and 19◦S: Submersible observations,J. Geophys. Res.,101(B8), 17995–18010, 1996.
Geophys. Res.,101(B4), 8685–8695, 1996.
Chadwick, W. W., Jr., D. S. Scheirer, R. W. Embley, and H. P. Johnson, High-resolution bathymetric surveys using scanning sonars: Lava flow morphology, hydrothermal vents and geologic structure at recent erup-tion sites on the Juan de Fuca Ridge,J. Geophys. Res.,106(B8), 16075– 16100, 2001.
Cormier, M.-H., W. B. F. Ryan, A. K. Shah, W. Jin, A. M. Bradley, and D. R. Yoerger, Waxing and waning volcanism along the East Pacific Rise on a millennium time scale,Geology,31, 633–636, 2003.
Embley, R. W., J. E. Lupton, G. Massoth, T. Urabe, V. Tunnicliffe, D. A. Butterfield, T. Shibata, O. Okano, M. Kinoshita, and K. Fujioka, Geological, chemical, and biological evidence for recent volcanism at 17.5◦S: East Pacific Rise,Earth Planet. Sci. Lett.,163, 131–147, 1998. Feely, R. A., E. T. Baker, K. Marumo, T. Urabe, J. Ishibashi, J. Gendron, G. T. Lebon, and K. Okamura, Hydrothermal plume particles and dis-solved phosphate over the superfast spreading Southern East Pacific Rise,Geochim. Cosmochim. Acta,60, 2297–2323, 1996.
Gregg, T. K. P., D. J. Fornari, M. R. Perfit, R. M. Haymon, and J. H. Fink, Rapid emplacement of a mid-ocean ridge lava flow on the East Pacific Rise at 9◦46–51N,Earth Planet. Sci. Lett.,144, E1–E7, 1996. Ishibashi, J., H. Wakita, K. Okamura, E. Nakayama, R. A. Feely, G. T.
Lebon, E. T. Baker, and K. Marumo, Hydrothermal methane and man-ganese variation in the plume over the superfast spreading southern East Pacific Rise,Geochim. Cosmochim. Acta,61, 485–500, 1997. Kurras, G. J., M. H. Edwards, and D. J. Fornari, High-Resolution
Bathymetry of the East Pacific Rise Axial Summit Trough 9◦49-51N: A Compilation of Alvin Scanning Sonar and Altimetry Data from 1991– 1995,Geophys. Res. Lett.,25, 1209–1212, 1998.
Maruyama, A., T. Urabe, J. Ishibashi, R. A. Feely, and E. T. Baker, Global hydrothermal primary production rate estimated from the southern East Pacific Rise,Cahiers Biol. Mar.,39, 249–252, 1998.
Mutter, J. C., S. M. Carbotte, W. S. Su, L. Q. Xu, P. Buhl, R. S. Detrick, G. M. Kent, J. A. Orcutt, and A. J. Harding, Seismic images of active magma systems beneath the East Pacific Rise between 17◦05 and 17◦35S,Science,268, 391–395, 1995.
Naar, D. F. and R. N. Hey, Speed limit for oceanic transform faults,
Geol-ogy,17, 420–422, 1989.
Perfit, M. R. and W. W. Chadwick, Jr., Magmatism at mid-ocean ridges: Constraints from volcanological and geochemical investigations, in
Faulting and Magmatism at Mid-Ocean Ridges, Geophys. Monogr. Ser., vol. 106, edited by W. R. Buck, P. T. Delaney, J. A. Karson, and Y. Lagabrielle, pp. 59–115, AGU, Washington, D.C., 1998.
Scheirer, D. S. and K. C. Macdonald, The variation in cross-sectional area of the axial ridge along the East Pacific Rise; evidence for the magmatic budget of a fast-spreading center,J. Geophys. Res.,98(B5), 7871–7885, 1993.
Sinton, J., E. Bergmanis, K. Rubin, R. Batiza, T. K. P. Gregg, K. Gr¨onvold, K. C. Macdonald, and S. M. White, Volcanic erup-tions on mid-ocean ridges: New evidence from the superfast spread-ing East Pacific Rise, 17◦–19◦S, J. Geophys. Res., 107(B6), 2115, doi:10.1029/2000JB000090, 2002.
Urabe, T., E. T. Baker, J. Ishibashi, R. A. Feely, K. Marumo, G. J. Massoth, A. Maruyama, K. Shitashima, K. Okamura, J. E. Lupton, A. Sonoda, T. Yamazaki, M. Aoki, J. Gendron, R. Green, Y. Kaiho, K. Kisimoto, G. Lebon, T. Matsumoto, K. Nakamura, A. Nishizawa, O. Okano, G. Paradis, K. Roe, T. Shibata, D. Tennant, T. Vance, S. L. Walker, T. Yabuki, and N. Ytow, The effect of magmatic activity on hydrothermal venting along the superfast spreading East Pacific Rise,Science,269, 1092–1095, 1995.
Urabe, T. and J. E. Lupton, Shinkai 6500 dives under the centers of hy-drothermal plumes at superfast-spreading East Pacific Rise between 15.0–18.5◦S,EOS Trans. AGU,76(33), 674, 1995.
Urabe, T., A. Tanaka, and A. Schultz, Long-term temperature and velocity monitoring of low-temperature hydrothermal effluent on Southern East Pacific Rise,EOS Trans. AGU,80(46), Fall Meet. Suppl., F1098, 1999. Wessel, P. and W. H. F. Smith, New Version of the Generic Mapping Tools
released,EOS Trans. AGU,76(33), 329, 1995.