http://www.ijcmph.com pISSN 2394-6032 | eISSN 2394-6040
Original Research Article
Risk status of pregnant women in rural areas of Belagavi:
a cross sectional study
Katherine J. Bernard
1*, Sulakshana Baliga
2INTRODUCTION
Global maternal morbidity and mortality rates remain unacceptably high. In 2015 it was estimated that around 3,03,000 women died during and following pregnancy and childbirth; deaths of which most could have been prevented and 99% of which occurred in developing countries. More than half of maternal deaths occur in sub-Saharan Africa and almost one third occur in South Asia. There are large disparities both between and within
countries, between women with high and low income, and those living in rural versus urban areas.1 The World Health Organisation estimates the maternal mortality ratio in developing countries at 239 per 100,000 live births (as opposed to 12 per 100,000 in developed countries).2 As part of the Sustainable Development Goals, the target is to reduce the global maternal mortality ratio to less than 70 per 100,000 live births by 2030.3
ABSTRACT
Background: ‘High-risk’ pregnancies account for a significant proportion of perinatal morbidity and mortality worldwide. Simple prenatal scoring systems can be used to assess risk status of pregnancy and inform subsequent management. Their use in rural areas and low-resource settings could be of particular benefit. This study employed pregnancy risk status assessment in one such area of rural India. The objectives of the study were to estimate the prevalence of low, moderate and high-risk pregnancy among women in a rural area of Belagavi and to identify factors associated with high-risk pregnancy status.
Methods: This community-based cross-sectional study was undertaken among 105 pregnant women of all trimesters presenting to antenatal clinics in the Kinaye area of Belagavi, Karnataka, during July 2018. Information on risk factors and socio-demographic details were collected using a questionnaire, and individual risk scores calculated through a scoring system. This was used to estimate prevalence of low, moderate and high-risk status among participants, and subsequently compared against selected variables to identify factors associated with high risk pregnancy status.
Results: Prevalence of high-risk pregnancy among participants was 31.4%, moderate-risk 30.5%, low-risk 29.5% and ‘no risk’ 8.6%. Maternal undernutrition was an important factor associated with high-risk pregnancy.
Conclusions: This study highlights the need for early identification and appropriate management of such cases, in order to prevent adverse perinatal outcomes. The prenatal scoring system used in this study offers a simple method for risk status assessment in pregnant women of all trimesters, suited for use in antenatal clinics in rural areas of India.
Keywords: High-risk pregnancy, Risk status, Scoring system, Prevalence, Rural areas
1Sheffield Medical School, University of Sheffield, South Yorkshire, England
2Department of Community Medicine, Jawaharlal Nehru Medical College, KLE University, Belgaum, Karnataka, India
Received: 02 April 2019
Accepted: 08 May 2019
*Correspondence:
Katherine J. Bernard,
E-mail: [email protected]
Copyright: © the author(s), publisher and licensee Medip Academy. This is an open-access article distributed under the terms of the Creative Commons Attribution Non-Commercial License, which permits unrestricted non-commercial use, distribution, and reproduction in any medium, provided the original work is properly cited.
Pregnancies with a status of ‘high-risk’ account for a significant proportion of perinatal morbidity and mortality worldwide.4 A high-risk pregnancy is defined as one in which any maternal or foetal factor which may adversely affect the outcome of the pregnancy.4 Perinatal outcome can be influenced considerably by early detection of high risk pregnancies, appropriate planned antenatal management and timely referral to higher centres.4 Routine assessment of risk status in pregnancy therefore represents an opportunity to improve levels of maternal morbidity and mortality, particularly in poor and rural areas. In view of the above facts, an attempt was made to assess the risk status of pregnant women in rural areas of Belagavi.
METHODS
Study design:Cross-sectional study.
Study setting
Primary Health Centre and surrounding subcentres at Kinaye field practice area of Department of Community Medicine, Jawaharlal Nehru Medical College, KAHER, Belagavi.
Study period: 1st – 31st July 2018.
Study population
Pregnant women attending antenatal clinics under PHC during study period.
Sample size and methods
All pregnant women attending antenatal clinics during study period using universal sampling method.
Data collection
Data was collected through interviewing the study participants during the clinic using a tested pre-designed questionnaire, after obtaining informed written consent. The questionnaire was based upon a prenatal scoring system (proposed by Coopland et al at the University of Manitoba, 1977, modified for use in India by Dutta & Das).5,6 This is a 32-item scoring system, classified into 4 subsections: ‘reproductive history factors, past obstetrical history, present pregnancy factors, associated disease factors’.
Table 1: Prenatal scoring system (modified Dutta & Das).6
Reproductive
history factors Score
Past obstetrical
history Score
Present pregnancy
factors Score
Associated
disease factors Score
Age (in years) Abortion 1 Bleeding < 20 wks 1 Diabetes mellitus (pre-existing) 3 <16 1 Postpartum
haemorrhage 1 Bleeding > 20 wks 3 Cardiac disease 2 16<35 0 Baby weight >4 kg 1 Anaemia 1
Previous gynaecological surgery
1
>35 2 Baby weight <2.5 kg 1 Hypertension 2 Chronic renal
disease 2
Parity Pregnancy induced
hypertension 1 Oedema 3 Infective hepatitis 1
0 2 Infertility 1 Albuminuria 3 Pulmonary
tuberculosis 2 1-4 0 Previous Caesarian
section 2 Multiple Pregnancy 3
Other diseases (according to severity)
1-3
5 and above 2 Still birth/ Neonatal
death 3 Breech 3 Undernutrition 2
Prolonged/ Difficult
labour 1
Rhesus
Isoimmunisation 3 Polyhydramnios 2 Small foetus 1
0 = No risk; 1-2 = Low risk; 3-4 = Moderate risk; ≥5 = High risk; Total possible score = 57.
This scoring system has been assessed in several previous studies in rural India, and has been shown to be effective in predicting high risk pregnancies, correlating with perinatal outcomes.7,8 Two items from the present pregnancy category of the original prenatal scoring system were omitted – namely ‘prolonged labour’ (in
Within the scoring system, ‘abortion’ was defined as spontaneous miscarriage, whereas induced miscarriage (i.e. termination of pregnancy) was classified under previous gynaecological surgery. ‘Infertility’ was defined as lack of conception after 2 years of trying to conceive without use of contraceptive methods. Previous ‘prolonged/difficult labour’ was defined as labour lasting more than 24 hours or instrumental delivery.9Foetal presentation was only recorded for participants in third trimester of pregnancy. ‘Undernutrition’ was defined as maternal weight below 45 kg at time of conception.10 Hypertension was classified as current reading greater than 140/90 mmHg. Anaemia was classified as current haemoglobin concentration lower than 11 g/dl.
As well as the contents of the prenatal scoring system, the predesigned questionnaire included a section for socio-demographic details (age, religion, monthly household income), and a section for additional maternal characteristics which did not fall within the scoring system (trimester of pregnancy, current Body Mass Index, and gestational diabetes mellitus, hypothyroidism, or hyperthyroidism in current pregnancy). Body mass index (BMI) was calculated using the standard equation: BMI (kg/m2) = Weight (kg)/height2 (m2), based on height and weight measurements taken on the day of clinic. Socioeconomic status was derived from household income per capita per month, according to latest scales of the modified B.G. Prasad’s classification.11
Height, weight, blood pressure, foetal presentation, haemoglobin concentration, and urine albumin were collected as per the routine antenatal clinic examination and investigations. Blood pressure was measured with a mercury sphygmomanometer on the right arm with subjects in sitting position. Hemoglobin estimation was done by using Sahli's method. Presence of polyhydramnios, intrauterine growth restriction or multiple pregnancy was ascertained from Ultrasound scan reports in the patients’ handheld pregnancy records.
Inclusion criteria
Inclusion criteria were all patients with a positive urinary pregnancy test attending the antenatal clinic were included; Women of all ages and trimesters were included.
Exclusion criteria
Exclusion criteria were patients undergoing obstetric emergency needing urgent medical management were not included.
Data analysis
Data was coded & entered in Microsoft Excel software. Statistical analysis was done using SPSS version 21 statistical software. Categorical data was presented as percentage (%). Pearson’s chi-square test and Spearman
rank method were used to evaluate difference between groups for categorized variables.
Ethical considerations
The study was approved by the institutional ethics committee.
RESULTS
The study received 105 respondents. The mean age among the study population was 24.8±2.06 years, with minimum age of 18 and maximum 35. The majority of them (87.6%) were Hindus. With regard to socioeconomic status, 4 (3.8%) belonged to Class I, 13 (12.4%) belonged to Class II, 35 (33.3%) belonged to Class III, 36 (34.3%) belonged to Class IV, and 17 (16.2%) belonged to Class V (Table 2).
Table 2: Socio-demographic characteristics of study participants (n=105).
Characteristics No. Percentage
(%)
Age (years)
<20 9 8.6 21-25 57 54.3 26-30 30 28.6 31-35 9 8.6
Religion Hindu 92 87.6
Non-Hindu 13 12.4
Socioeconomic status
I 4 3.8
II 13 12.4
III 35 33.3
IV 36 34.3
V 17 16.2
Table 3: Other maternal characteristics (n=105).
Characteristics No. Percentage
(%)
Trimester
First 6 5.7 Second 62 59.1 Third 37 35.2
Body mass index
Underweight 24 22.9 Normal 65 61.9 Overweight 16 15.2
Gestational diabetes mellitus
No 104 99.1
Yes 1 0.95
Hypothyroidism No 102 97.1
Yes 3 2.9
Hyperthyroidism No 103 98.1
Yes 2 1.9
classified as normal, and 16 (15.2%) overweight. At the time of study, one participant (0.95%) had gestational diabetes mellitus, three (2.9%) had hypothyroidism, and two (1.9%) had hypothyroidism (Table 3).
Table 4: Risk status according to prenatal scoring system (n=105).
Risk status Score No. Percentage (%)
No risk 0 9 8.6
Low 1-2 31 29.5
Moderate 3-4 32 30.5
High ≥5 33 31.4
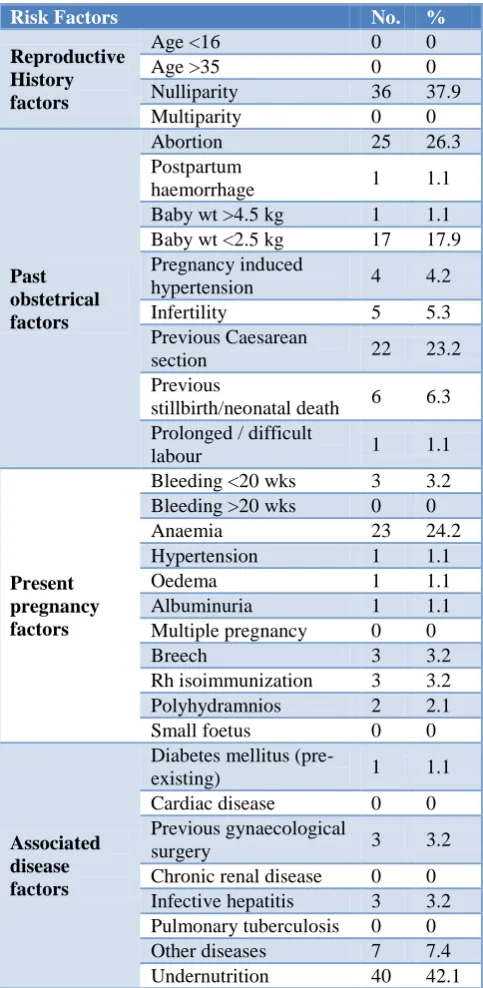
Table 5: Distribution of ‘at risk’ pregnancies by risk factors within scoring system (n=96).
Risk Factors No. %
Reproductive History factors
Age <16 0 0
Age >35 0 0
Nulliparity 36 37.9 Multiparity 0 0
Past obstetrical factors
Abortion 25 26.3 Postpartum
haemorrhage 1 1.1 Baby wt >4.5 kg 1 1.1 Baby wt <2.5 kg 17 17.9 Pregnancy induced
hypertension 4 4.2 Infertility 5 5.3 Previous Caesarean
section 22 23.2
Previous
stillbirth/neonatal death 6 6.3 Prolonged / difficult
labour 1 1.1
Present pregnancy factors
Bleeding <20 wks 3 3.2 Bleeding >20 wks 0 0
Anaemia 23 24.2
Hypertension 1 1.1
Oedema 1 1.1
Albuminuria 1 1.1 Multiple pregnancy 0 0
Breech 3 3.2
Rh isoimmunization 3 3.2 Polyhydramnios 2 2.1 Small foetus 0 0
Associated disease factors
Diabetes mellitus
(pre-existing) 1 1.1
Cardiac disease 0 0 Previous gynaecological
surgery 3 3.2
Chronic renal disease 0 0 Infective hepatitis 3 3.2 Pulmonary tuberculosis 0 0 Other diseases 7 7.4 Undernutrition 40 42.1
Table 6: Distribution of ‘high risk’ pregnancies by risk factors within scoring system (n=33).
Risk factors No. %
Reproductive history factors
Age <16 0 0 Age >35 0 0 Nulliparity 16 48.5 Multiparity 0 0
Past Obstetrical Factors
Abortion 13 39.4 Postpartum
haemorrhage 1 3.0 Baby wt>4.5kg 0 0 Baby wt<2.5kg 6 18.2 Pregnancy induced
hypertension 3 9.1 Infertility 4 12.1 Previous Caesarean
section 10 30.3
Previous
stillbirth/neonatal death
5 15.2 Prolonged / difficult
labour 1 3.0
Present pregnancy factors
Bleeding <20wks 1 3.0 Bleeding >20wks 0 0
Anaemia 9 27.3
Hypertension 1 3.0
Oedema 0 0
Albuminuria 1 3.0 Multiple pregnancy 0 0
Breech 3 9.1
Rh isoimmunization 3 9.1 Polyhydramnios 2 6.1 Small foetus 0 0
Associated disease factors
Diabetes mellitus
(pre-existing) 1 3.0 Cardiac disease 0 0 Previous
gynaecological surgery 1 3.0 Chronic renal disease 0 0 Infective hepatitis 2 6.1 Pulmonary
system was undernutrition, followed by nulliparity. 40 participants (42.1%) scored points for undernutrition, 36 (37.9%) scored points for nulliparity, 25 (26.3%) for previous abortion, 23 (24.2%) for anaemia, and 22 (23.2%) for previous Caesarean section (Table 5). Among the 33 participants who were ‘high risk’, the most common reasons for scoring points on the prenatal scoring system was also undernutrition, followed by nulliparity. 19 participants (57.6%) scored points for undernutrition, 16 (48.5%) scored points for nulliparity, 13 (39.4%) for previous abortion, 10 (30.3%) for previous Caesarean section, and 9 (27.3%) for anaemia (Table 6).
No statistically significant associations were found between risk status of pregnancy and religion and socioeconomic status (Table 7). Statistically significant association was found between risk status and underweight BMI, with 58.33% of the 24 underweight participants at moderate risk, and 33.33% at high risk (p<0.05). Statistically significant association was also found between risk status and hyperthyroidism; 100% of participants with hyperthyroidism were at high risk (p<0.05). However, given the fact that the total number of participants with hyperthyroidism was only two, it is difficult to justify this finding. No statistically significant associations were found between risk status and trimester of pregnancy, gestational diabetes mellitus, or hypothyroidism (Table 8).
Table 7: Associations between risk status and socio-demographic characteristics (n=105).
No risk Low risk Moderate risk High risk Chi-square P value
Religion Hindu 8.70 30.43 42.39 18.48 0.3863 0.9431
Non-Hindu 7.69 23.08 46.15 23.08
Socioeconomic status
I 0.00 50.00 50.00 0.00 9.8503 0.6291
II 7.69 15.38 46.15 30.77
III 11.43 40.00 28.57 20.00
IV 8.33 19.44 52.78 19.44
V 5.88 35.29 47.06 11.76
Table 8: Associations between risk status and other maternal characteristics (n=105).
No risk Low risk Moderate risk High risk Chi-square P value
Trimester
First 16.67 50.00 16.67 16.67 2.9964 0.8093 Second 9.68 27.42 43.55 19.35
Third 5.41 29.73 45.95 18.92
Body mass index
Underweight 0.00 8.33 58.33 33.33 14.0267 0.0294* Normal 9.23 36.92 38.46 15.38
Overweight 18.75 31.25 37.50 12.50
Gestational diabetes mellitus
No 8.65 29.81 42.31 19.23 1.3462 0.7182
Yes 0.00 0.00 100.00 0.00
Hypothyroidism No 8.82 30.39 42.16 18.63 1.9159 0.5901
Yes 0.00 0.00 66.67 33.33
Hyperthyroidism No 8.74 30.10 43.69 17.48 8.6650 0.0341*
Yes 0.00 0.00 0.00 100.00
Table 9: Correlation between risk scores and other maternal characteristics (n=105).
N Spearman R t-value p-level
Trimester 105 0.0625 0.6358 0.5263
BMI 105 -0.3397 -3.6656 0.0004*
GDM 105 -0.0082 -0.0831 0.9339
Hypothyroidism 105 0.1899 1.9633 0.0523
Hyperthyroidism 105 0.2140 2.2238 0.0283*
Statistically significant negative correlation was found between risk score and body mass index. Statistically significant positive correlation was found between risk score and hyperthyroidism. No statistically significant correlations were found between risk score and trimester, gestational diabetes mellitus, or hypothyroidism respectively (Table 9).
DISCUSSION
This can be compared to a previous study in Telangana, which used the same prenatal scoring system (modified by Dutta & Das) to calculate individual risk scores for 200 participants.45% participants were found to belong to low risk, 33% to moderate risk and 20 % to the high risk category.7 This demonstrates a considerably different distribution of risk status than the findings of the present study. However, the study in Telangana was designed to be prospective, assessing association between high risk and pregnancy outcomes (namely perinatal mortality and birth asphyxia). It therefore only included participants of term gestation reporting to the labour room.7This represents a contrast to the present study which included participants of all trimesters, and as such used an adjusted cut-off value for high risk (omitting factors which related to end-stage pregnancy only). This may explain the difference in findings of risk prevalence.
Previous studies which included participants regardless of gestation yielded results which are more comparable. A cross-sectional study in rural Haryana which included 900 pregnant women of all trimesters found the same prevalence of high risk pregnancy as that found in the present study (31.4%).12 Another cross-sectional study undertaken with 100 participants in rural Dharwad also found similar prevalence of high risk pregnancy (37%).13 However the aforementioned studies used alternatives to the prenatal scoring system used in the present study, meaning different risk factors were assessed. Nor did they distinguish between low, moderate and high risk status.12, 13
In present study, the most common factors present in ‘at risk’ pregnancies were found to be undernutrition (42.1%), nulliparity (37.9%), and previous abortion (26.3%). The same factors were found to be most common in the high risk participants, of whom 57.6% scored points for undernutrition, 48.5% for nulliparity, and 39.4% for previous abortion. This is somewhat consistent with findings of the cross-sectional study in rural Dharwad, where history of ≥2 abortions was found to be second most common risk factor (29.7%) among the high-risk participants. However, the most common factor among high risk participants in this study was not undernutrition but maternal height <140cm (40.5%). The same prenatal scoring system used in the present study was not used in the Dharwad study, and as a result ‘undernutrition’ was not included in scoring, therefore making risk factors difficult to compare with those of the present study.13
Previous studies have also demonstrated associations between risk status in pregnancy and various socio-demographic variables. In rural Dharwad, 45.2% of the participants in lower socioeconomic group (classes III, IV and V) were classified as high risk, as opposed to 23.6% of the upper socioeconomic group (classes I and II).13 Similarly in the cross-sectional study undertaken in rural Haryana, prevalence of high risk pregnancy was significantly higher in lower socioeconomic groups than
in upper socioeconomic groups (33.4% and 19.7% respectively).12 However, in the present study, no statistically significant associations were found between risk status and the socio-demographic variables recorded (namely age, religion and socioeconomic status). This is likely due to insufficient sample size, which represents a significant limitation of the present study.
Upon analysis of other maternal characteristics which were not included in the prenatal scoring system, statistically significant associations were found between risk status and underweight BMI, as well as risk status and hyperthyroidism. Additionally, negative correlation was found between risk score and BMI, and positive correlation between risk score and hyperthyroidism. However, due to low sample size, the total participants scoring for hyperthyroidism were only two (both of whom were at high risk); this association would therefore need further justification.
The association between risk score and underweight BMI represents a more useful finding of the present study. Use of ‘Undernutrition’ in the prenatal scoring system was defined by pre-conceptional weight <45 kg. Undernutrition proved to be the most common risk factor scored for among ‘at risk’ participants (affecting 42.1% of those at risk, and 57.6% of those at high risk), thus representing a very important consideration for the study population. Measurement of current height and weight, in addition to pre-conceptional weight estimation, allowed assessment of up to date body mass index for participants. Given that normal BMI parameters are not designed to apply to pregnant women, BMI <18.5 during any trimester of pregnancy represents an even stronger indication of underweight than in the normal adult population.14 Maternal undernutrition has been found to be of highest prevalence in South Asian countries, and has been established in previous studies as an important contributor to adverse pregnancy outcomes; in particular low birth weight and neonatal mortality.14The present study helps to confirm the importance of undernutrition as a risk factor for high risk pregnancy in rural areas of Belagavi which is likely also to be applicable in many other districts across India.
CONCLUSION
The present study suggested that almost one third of the study participants were at ‘high risk’ of adverse outcome, and that the pregnancies of almost all participants were to some degree ‘at risk’. Maternal undernutrition appeared to be an important factor in high risk pregnancy among participants in this study area.
primary antenatal care, in order to improve consistency of risk status assessment in pregnancy – both in the context of research and in everyday practice.
This would have valuable implications for early identification of high-risk pregnancy and implementation of appropriate antenatal care to reduce adverse outcomes for mother and baby; as well as improving population levels of perinatal morbidity and mortality.
Funding: No funding sources Conflict of interest: None declared
Ethical approval: The study was approved by Jawaharlal Nehru Medical College Ethics Review Committee, KLE University
REFERENCES
1. Alkema L, Chou D, Hogan D, Zhang S, Moller A, Gemmill A, et al. Global, regional, and national levels and trends in maternal mortality between 1990 and 2015, with scenario-based projections to 2030: a systematic analysis by the UN Maternal Mortality Estimation Inter-Agency Group. Lancet. 2016;387(10017):462-74.
2. World Health Organization. Fact sheet: Maternal mortality. Available at: http://www.who.int/ news-room/fact-sheets/detail/maternal-mortality.
Accessed on 26 July 2018.
3. World Health Organization. Sustainable Development Goal 3: Ensure healthy lives and promote wellbeing for all at all ages. Available from: http://www.who.int/sdg/targets/en/. Accessed on 26 July 2018.
4. Queenan JT, Spong CY, Lockwood CJ. Queenan's management of high-risk pregnancy: an evidence-based approach. 6th ed. Oxford: Wiley-Blackwell; 2012: 1.
5. Coopland A, Peddle L, Baskett T, Rollwagen R, Simpson A, Parker E. A simplified antepartum high-risk pregnancy scoring form. Obstetrical Gynecological Survey. 1977;32(11):721-3.
6. Dutta S, Das XS. Identification of high risk mothers by a scoring system and its correlation with perinatal outcome. J Obstet Gynaecol India. 1990;40:181-90.
7. Kolluru V, Reddy A. Study of high risk scoring in pregnancy and perinatal outcome. Indian J Obstetr Gynecol Res. 2016;3(4):407-9.
8. Samiya M, Samina M. Identification of High Risk Pregnancy by a Scoring System and its Correlation with Perinatal Outcome. Indian J Practising Doctor. 2005;5(1):3-4.
9. Managing prolonged and obstructed labour, Midwifery education module. Geneva: World Health Organisation; 2008. Available from: http://www.who.int/maternal_child_adolescent/docu ments/3_9241546662/en/. Accessed on 26 July 2018.
10. Derbyshire E. Low maternal weight: effects on maternal and infant health during pregnancy. Nursing Standard. 2007;22(3):43-6.
11. Singh T, Sharma S, Nagesh S. Socioeconomic status scales updated for 2017. Int J Res in Med Sci. 2017;5(7):3264-7.
12. Bharti M, Kumar V, Kaur A, Chawla S, Malik M. Prevalence and correlates of High risk pregnancy in rural Haryana: A community based study. Int J Applied Basic Med Res. 2013;3(2):212-7.
13. Kumar M, Gnanadeep N, Dixit U, Patil P. Prevalence Of High Risk Pregnancy In Rural Dharwad. IOSR J Dent Med Sci. 2015;14(10):29-32.
14. Ahmed T, Hossain M, Sanin K. Global Burden of Maternal and Child Undernutrition and Micronutrient Deficiencies. Ann Nutr Metabol. 2012;61(1):8-17.