Themed Section : Engineering and Technology © 2018 IJSRSET | Volume 5 | Issue 3 | Print ISSN: 2395-1990 | Online ISSN: 2394-4099
Optimal Placement of SVC using Firefly Algorithm
N.Karthik1, A.K.Parvathy2, R.Arul3, Jayapragash.R4
12Department of Electrical and Electronics Engineering, Hindustan Institute of Technology & Science, Chennai,
Tamilnadu, India
34School of Electrical Engineering, Vellore Institute of Technology, Chennai, Tamilnadu, India
ABSTRACT
This paper presents an application of Firefly Algorithm (FFA) to recognize the optimal placement of Static Var Compensator (SVC) in a power system network. A circuit model of SVC is utilized to regulate the bus voltage magnitudes and line power flows for improvement of voltage profile and real power loss minimization respectively. The key reason for the voltage instability is the insufficient reactive power at the load buses of the system. Here IEEE 57 bus system is taken into consideration for finding the optimal location and sizing of SVC using FFA. To validate the proposed algorithm, simulation is performed on standard IEEE 57 bus system using MATLAB software package. The simulation results obtained from FFA are compared with Particle Swarm Optimization (PSO) and found to be better.
Keywords: Firefly Algorithm (FFA), Loss Minimization, SVC, Optical Location, Particle Swarm Optimization (PSO), Voltage Profile.
I.
INTRODUCTIONReactive Power Compensation is a static non-linear programming problem, which optimizes a certain objective function while fulfilling a set of operational, and physical constraints imposed by equipment and equipment limitations [1, 2]. It is also a large-scale static optimization problem with both continuous and discrete decision variables [3]. Several classical optimization techniques such as linear programming, non-linear programming and quadratic programming [4] and the interior point method [5] have been applied to solve the optimal power flow problem. All the above classical optimization have some drawbacks such as getting trapped in local optima or they are suitable for taking into consideration of a explicit fitness function in the optimal power flow problem. These disadvantages can be overcome if
teaching learning based optimization (TLBO) [13] for minimization of real power loss. Dr. Xin-She Yang [14] developed Firefly Algorithm at Cambridge University, which is based on the flashing behaviour of fireflies in 2007. The fitness function of the optimization problem is associated with that of the brightness of firefly and depending on the movement of the fireflies towards the brighter one in the given population thus solving the optimization problem. The rest of this paper is structured as follows. The power flow model of SVC is presented in Sect. 2. The statistical formulation of the optimal power flow problem is presented in Sect. 3. In Sect. 4, firefly algorithm and its performance in reactive power optimization is demonstrated in detail. Simulation results on IEEE 57 bus system and the association with the results provided by particle swarm optimization (PSO) algorithm is shown.
II.
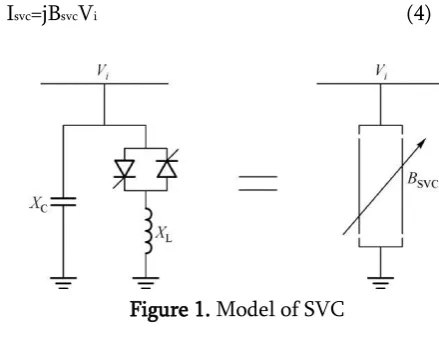
POWER FLOW MODEL OF SVC DEVICEThe Static Var Compensator performs similar to a shunt connected variable reactance. SVC either absorbs or generates reactive power so as to control the magnitude of the voltage at the point of connection to the AC network. Fig.1 shows the equivalent circuit of variable susceptance model which is utilized to obtain the SVC non-linear power flow equations and the liberalized equations required by the Newton’s method. The linearized equation of the SVC device is given by the subsequent equation, where the total susceptance Bsvc is considered to be
the state variable.
[ Q Pi
i] [ Q i
svc
] [
svc]
The variable shunt susceptance, Bsvcis modified at the
ending of every iteration (k),
svck svck svck
Reactive power drawn by SVC device, which is also reactive power injected, Qsvcat bus i, is
Qsvc Qi - i svc (3)
The current drawn by SVC depending on the equivalent circuit of SVC is
svc j svc i (4)
Figure 1. Model of SVC
III.
FORMULATION OF REACTIVEOPTIMIZATION PROBLEM
The FACTS devices are to be installed at suitable positions with best possible parameters that curtail the real power loss for better deployment of the existing power system. This paper aims to build up a strategy that executes optimal placement of SVC with an intention of curtailing active power loss and enhancing voltage profile.
A. Formulation of Objective Function
The goal of using FFA is to curtail active power loss, which can be calculated from the load flow solution [14], and described as
Min Ploss ∑Gl i j i jcos ij
nl
l
The optimal power flow problem is subject to the subsequent equality and inequality constraints
(i) Power flow Constraints
Pi i∑ j Gijcos ij ij sin ij
N
j
Qi i∑ j Gij sin ij ij os ij
N
j
Where 'i' and 'j' are buses and N is number of buses
(ii) Operating limits of the voltage
imin i imax (8)
(iii) Reactive Power Generation Limit
QGimin QGi QGimax (9)
(iv) SVC size limit
- M R QS M R (10)
IV.
FIREFLY ALGORITHMThe firefly algorithm is a nature inspired swarm intelligence technique, enthused by the sporadic activities of fireflies. It is analogous to other meta-heuristic optimization algorithms utilizing swarm intelligence for instance PSO. The main intention for a firefly's flash is to function as a indication structure to exert a pull on other fireflies. The intensity (I) of flashes diminishes as the distance (r) augments and thus the majority of the fireflies can correspond barely up to quite a few hundred meters.
The Firefly Algorithm was based on the subsequent idealized activities of the flashing features of fireflies:
1. All fireflies are unisexual, so that one firefly will be engrossed to all other fireflies;
2. The degree of attractiveness depends on their brightness, and for any two fireflies, the
by the firefly with higher brightness; on the other hand, the brightness can reduce as their distance increases.
3. It will move indiscriminately if there are no fireflies brighter than a given firefly.
The pseudo code of the FFA can be formulated depending on these three idealized conventions.
Pseudo Code of the Firefly Algorithm: Define Objective function
Generate initial population of fireflies; Define light intensity;
Describe absorption coefficient γ; While (TG<Max No. of Generations) For r = 1 to n (all n fireflies);
For s=1 to n (all n fireflies)
If (Ir > Is), move firefly i towards j;
End if
Determine new solutions and update the value of light intensity;
End for s; End for r;
Rank the fireflies and find the current best; End while;
Post process results and visualization; End procedure;
V.
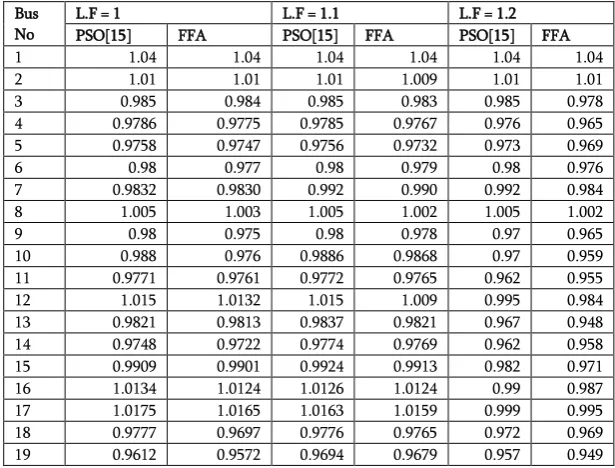
SIMULATION RESULTSThe Firefly Algorithm has been applied to determine the suitable location of the FACTS device for IEEE 57-bus system using MATLAB software. Simulation results obtained are compared with PSO. The standard IEEE 57-bus system has 41 transmission lines and six generator buses (Bus No 2, 3, 6, 8, 9 and 12). Table 1 shows the application results in terms of the position and size of the SVC device and the ensuing transmission losses. For the appropriate position and size of FACTS device, the reactive power generation is lesser in FFA method when compared to PSO. Table II shows the voltage profile under different load conditions determined using FFA and
PSO and it is observed that there is an improvement of voltage profile of the system after reactive power compensation by means of Firefly Algorithm. The system load was increased gradually from the base case for this purpose. The system was loaded from its base case up to load factor (L.F) of 1.4 in FFA and PSO. The total active and reactive power losses, total active and reactive power generation of the system, reactive power generation of each generator, size and bus position of SVC device are presented in Table I. In FFA algorithm, the reactive power generation is lesser than the PSO algorithm for the appropriate size and location of FACTS device. The transmission line losses in FFA method are relatively lesser than the PSO method.
TABLE I. Reactive Power Optimization Results Under Different Load Conditioned In FFA & PSA Algorithm
L.F Qg2
(MV AR) Qg3 (MVA R) Qg6 (MVA R) Qg8 (MV AR) Qg9 (MV AR) Qg12 (MVA R) QgT (MVA R) QTloss (MVA R) PgT (MW) PTloss (MW) Size of SVC (MVA) Location (Bus No) FFA
1 0.891 -0.97 10.124 72.75 - 145.89 345.81 158.78 1224.69 24.69 43.676 7 1.1 8.342 -0.679 -6.783 64.85 2.014 124.73 365.91 181.46 1231.46 28.036 99.352 12 1.2 9.147 43.568 20.136 80.14 - 152.47 487.48 287.10 1262.76 62.368 129.458 16
PSO [15]x `
1 0.775 -0.47 4.369 63.52 - 121.58 324.78 155.83 1223.56 27.76 52.374 9 1.1 7.437 -0.445 -3.301 50.14 1.854 110.56 341.41 177.90 1226.94 31.142 115.785 15
1.2
7.132 39.175 12.047 77.47 - 136.71 463.01 283.02 1260.80 65.006 150.766 15
TABLE II. Voltage Profile at Different Buses in FFA and PSO Algorithm under Different Load Conditions
Bus No
L.F = 1 L.F = 1.1 L.F = 1.2
PSO[15] FFA PSO[15] FFA PSO[15] FFA
1 1.04 1.04 1.04 1.04 1.04 1.04
2 1.01 1.01 1.01 1.009 1.01 1.01
3 0.985 0.984 0.985 0.983 0.985 0.978 4 0.9786 0.9775 0.9785 0.9767 0.976 0.965 5 0.9758 0.9747 0.9756 0.9732 0.973 0.969
6 0.98 0.977 0.98 0.979 0.98 0.976
7 0.9832 0.9830 0.992 0.990 0.992 0.984 8 1.005 1.003 1.005 1.002 1.005 1.002
9 0.98 0.975 0.98 0.978 0.97 0.965
20 0.9639 0.9628 0.9777 0.9759 0.965 0.958 21 1.0227 1.0216 1.0487 1.0468 1.038 1.027 22 1.0263 1.0234 1.0538 1.0527 1.043 1.039 23 1.0242 1.0145 1.0583 1.0546 1.049 1.038 24 1.0045 1.0021 1.1507 1.1490 1.173 1.168 25 0.9713 0.9697 1.0824 1.0817 1.091 1.087 26 0.9632 0.9642 1.0906 1.0870 1.11 1.105 27 0.9816 0.9743 1.0428 1.0411 1.049 1.037 28 0.9951 0.9871 1.0324 1.0317 1.035 1.029 29 1.0076 1.0069 1.0309 1.0299 1.0318 1.0295 30 0.9579 0.9567 1.0583 1.0578 1.0623 1.0591 31 0.9475 0.9469 1.0199 1.0178 1.014 1.009 32 0.9857 0.9843 1.0141 1.0125 1.0021 1.0017 33 0.9835 0.9829 1.0119 1.0112 0.9995 0.9981 34 1.0217 1.0203 0.9964 0.9958 0.9752 0.9749 35 1.031 1.029 1.0014 1.0009 0.9808 0.9799 36 1.0264 1.0259 1.0098 1.0089 0.9905 0.9894 37 1.0265 1.0234 1.0184 1.0175 1.0006 1.0039 38 1.0311 1.0294 1.0464 1.0435 1.0331 1.0289 39 1.0241 1.0235 1.016 1.0156 0.9976 0.9864 40 1.0226 1.0216 1.0061 1.0049 0.9863 0.9755 41 1.0117 1.0127 1.0053 1.0028 0.9865 0.9814 42 0.9879 0.9866 0.9792 0.9763 0.9553 0.9497 43 1.0161 1.0129 1.0143 1.0129 0.998 0.993 44 1.032 1.029 1.0442 1.0439 1.0315 1.0295 45 1.0446 1.0435 1.051 1.047 1.0432 1.0387 46 1.0691 1.0595 1.0753 1.0689 1.0613 1.0598 47 1.0465 1.0395 1.0561 1.0514 1.0416 1.0399 48 1.0418 1.0438 1.053 1.049 1.0384 1.0376 49 1.0478 1.0469 1.0558 1.0539 1.0389 1.0358 50 1.032 1.029 1.0367 1.0323 1.0151 1.0124 51 1.0555 1.0499 1.0568 1.0557 1.036 1.028 52 0.9703 0.9692 0.9871 0.9852 0.9779 0.9758 53 0.9569 0.9487 0.9704 0.9691 0.9569 0.9553 54 0.9879 0.9797 0.9952 0.9940 0.9824 0.9793 55 1.0279 1.0236 1.0295 1.0278 1.0193 1.0175 56 0.9938 0.9925 0.9843 0.9839 0.9608 0.9597 57 0.9932 0.9879 0.9833 0.9829 0.9595 0.9573
VI.
CONCLUSIONIn this paper firefly algorithm has been applied to recognize the best possible locations of SVC device and their parameter with the purpose of minimizing the voltage deviations to improve the load bus voltage profile. Application results reveal that the recognized size and location of SVC device reduce the network real power loss. It is feasible that with the application of firefly algorithm can result in the minimization of the active power losses and proper implementation of power system planning and operation.
VII.
REFERENCES[1] Stephen Frank, Ingrida Steponavice, Steffen
bibliographic survey I Formulations and deterministic methods”, Springer Journal of Energy Systems, Vo1. 3, No. 3, pp.221-258, 2012.
[2] Abbas Rabiee, Maziar Vanouni, Mostafa Parniani, "Optimal reactive power dispatch for improving voltage stability margin using a local voltage stability index", International Journal of Energy Conversion and Management, Vol. 59, pp.66-73, 2012.
[3] Youcef Amrane, Mohamed Boudour , Messaoud elazzoug, “ new Optimal reactive power planning based on Differential Search lgorithm”, nternational Journal of Electrical Power and Energy Systems, Vol. 64, pp. 551-561, 2015.
dispatch", Electric Power System Research., Vol. 22, pp.47-60, 1991.
[5] Edimar J. Oliveira, Leonardo W. Oliveira, J.L.R. Pereira, Leonardo M. Honório, Ivo C. Silva Junior, A.L.M. Marcato, "An optimal power flow based on safety barrier interior point method", International Journal of Electrical Power and Energy Systems,Vol.64, pp.977-985, 2015.
[6] Youcef Amrane, Mohamed Boudour, Ahmed Amine Ladjici, Ali Elmaouhab, "Optimal VAR control for real power loss minimization using differential evolution algorithm", International Journal of Electrical Power & Energy Systems, Vol. 66, pp.262-271, 2015.
[7] Abbas Ketabi, Ahmad Alibabaee, R. Feuillet, “ pplication of the ant colony search algorithm to reactive power pricing in an open electricity market,” nternational Journal of Electrical Power & Energy Systems, vol.32, pp. 622-628, 2010.
[8] D. Devaraj, J. Preetha Roselyn, “Genetic algorithm based reactive power dispatch for voltage stability improvement”, nternational Journal of Electrical Power & Energy Systems, Vol. 32, pp. 1151-1156, 2010.
[9] Bhaskar Kanna, Sri Niwas Singh,"Towards reactive power dispatch within a wind farm using hybrid PSO", International Journal of Electrical Power & Energy Systems, Vol. 69, No. 7, pp.232-240, 2015.
[10] Gonggui Chen, Lilan Liua, Peizhu Songd, Yangwei Dua, "Chaotic improved PSO-based multi-objective optimization for minimization of power losses and L index in power systems",
International Journal of Energy Conversion and Management, Vol. 86, pp.548-560, 2014.
[11] R. Arul , G. Ravi, S. Velusami, "Solving Optimal Power Flow Problems using Chaotic
Self-adaptive Differential Harmony Search
Algorithm", Electric Power Components and Systems, Vol.41, pp.782-805, 2013.
[12] A. Ananthi Christya, P. Ajay D. Vimal Raj," Adaptive biogeography based predator–prey optimization technique for optimal power flow", International Journal of Electrical Power & Energy Systems, Vol. 62, pp.344-352, 2014. [13] Mojtaba Ghasemia, Mahdi Taghizadeha, Sahand
Ghavidela, Jamshid Aghaeia, Abbas Abbasianb, "Solving optimal reactive power dispatch problem using a novel teaching–learning-based optimization algorithm", Engineering Applications of Artificial Intelligence, Vol. 39, pp.100-108, 2015.
[14] X. S. Yang, "Nature-Inspired Meta-Heuristic Algorithms", 2nd ed., Beckington, Luniver Press, 2010.
[15] Subramanian Annamalai, Ravi Govinthasamy, “ oltage ollapse Enhancement and Loss Reduction by Reactive Power Reserve", International Journal of Computer Applications, Vol.12, Issue.12, pp. 32-42, 2011.