Analysis of Macro Environment for Strategy
Implementation: What is important to Handicraft
Export Organisations in Ghana?
Stephen Banahene1, Eric Ahudey2 , Charles Mensah3 Christian Service University College1
Christian Service University College2 Accra Polytechnic3,Ghana Abstract
The environment can be described as what separates surface from substance and what provides meaning in the form of terrain, shelters, water, fire, objects, and tools for survival. This means that business environment contribute immensely to strategic success and its analysis becomes necessary for management action. Studies in business environment have concentrated largely on theory development, the use of qualitative approach, and less on what managers do with business environment in the decision making process. This study has investigated the environmental analysis done by managers of handicraft export organisations. The study has indicated that, political, economic and international factors serves as enable and challenging factors to strategy implementation but are less analysed. The situation appears to be inconsistent with cognitive psychology of rationality and reasoning.
Structured questionnaire was used to collect data from managers of handicraft export organisations. In conclusion, managers of handicraft export organisations should be rationally interested in macro environment analysis as it afford business strategy implementation.
Keywords: environment; enabling factor; challenging factor; strategic management; and implementation.
1.0 INTRODUCTION
There are myriads of cleverly, intuitively designed things including strategy that we do correctly without thinking, even if we are doing so for the first time. Crafting of business strategy (analysis, formulation and implementation) is not exactly intuitive and unfortunately poor strategy is not that uncommon. Poor strategy can even have far-reaching business consequences. One key area of business strategy is the analysis of the environment. The discussion on business environment as key determinant of strategic implementation success is ongoing among scholars. Barker (1968) in his classical work “Ecological Psychology” argued that human behaviour is radically situated in a way that predictions can be possible when the environment of the person is understood. Gibson has also stressed the importance of the environment and how it affords various actions to the organism. Thus, an appropriate analysis of the environment is crucial for the explanation of perceptually guided behaviour. Like Barker and Gibson, many scholars have helped to explain the psychological issues in the analysis of environment. It is also important to investigate how and the rate of environment usage in the implementation of strategy by managers in businesses that have wider environmental factors to deal.
What then is the environment? The environment can be described as what separates surface from substance. It can also be defined as what provides meaning in the form of terrain, shelter, water, fire, objects, tools and others for survival. By these indications, environment can be made up of the composition and layout of surfaces that provides survival. This implies that the “values” and “meanings” of things in the environment can be directly perceived as the determinant of the outcome of business strategy. Hence, the perception on the business environment is crucial for the explanation of a guided behaviour for business strategy. This study has sought the perception of handicraft export managers to determine how often they analyse business macro environment and the degree to which these macro environment factors pose opportunities and threats to strategic implementation.
2.0 METHODOLOGY
3.0 REVIEW OF CURRENT THINKING IN BUSINESS ENVIRONMENT
As cited by Collins, ecological view of strategy is about the process of matching what an organisation can do within the universe of what it might do to a formulation of behaviour representing what it should best do (Andrew, 1980). Andrew’s position on environmental analysis is about how to relate environmental conditions and trends to opportunities and risks to determine the best match to markets and products. Aguilar’s (1967) work on PESTLE analysis defined the structured nature of business environment and proposed the logic of casual relationships between the external industry conditions and the implications and consequences for business and management attention. In order to be useful to the structured nature of PESTLE and its causal relationships in logical consequences, it is equally important to know the extent to which managers consciously or otherwise use macro environment in their strategic implementations. To be productive in strategy, we need to move along side with abstract analysis, the specific usage of business environment by industry. Barney (1991) has studied the complementarities between environmental models of competitive advantage and resource-based models and concluded on the importance of macro environment to strategy implementation.
Drucker has concerned himself with matters of micro environment and identified that an organisation’s inability to match its behaviour to the changing environment is a sign of stagnation (Drucker, 1994). Notwithstanding, Drucker still emphasised that organisations are anchored in dynamic context and its managers are required to consider the extended context in an intelligent and purposeful way. This therefore means that, managers of organisation must undertake environmental analysis to monitor the forces that may have an adverse effect on their organisations (Albright, 2014). This further supports Astley and Fombrun’s view that, organisations are active part within the environment and need to respond dynamically to and affect the evolution of the environment (Astley and Fombrun, 1983; Astley, 1984).
In this changing business environment, strategy implementation has to do with capabilities to analyse what is important to the business in order to be effective and purposeful. The capabilities being suggested here is the everyday activities that organisations do to achieve new ways of doing things (Horton, 2010). When business environment is ambiguous and complex, strategy must seek to explore in details the cognitive and practice behaviour of managers. The managerial behaviour in strategy implementation should include problem sensing and cognitive processes of identifying environmental forces likely to affect the activities of their businesses (Kiesler and Sproull, 1982 cited by Collins). This suggests that, to be able to implement strategy successfully, one must understand the environmental context to sense out which environmental force has the capacity to affect the strategy. The strength in knowledge to deal with high-value and relevant information in strategy is known as ‘high-order capabilities’ which is an asset in competition (Pandza and Thorpe, 2009). What is important here is that, effective environmental analysis to identify what force is significant to strategy is part of the meta-cognitive skill required to gain competitive advantage. This skillful analysis creates purposefulness and responsiveness to the environment dynamics. It is for this reason why environmental analysis is recognised as an important part of entrepreneurial behaviour (McEwen, 2008).
remembering, thinking (Craik and Lockhart, 2008) and acting to the use of business environmental. Remembering has to do with absorbing and recalling information quickly and efficiently. Thinking is about logical and rational reasoning across dataset to allow deep insight and useful deductions to be made. And acting is also on taking steps to use information that has been rationally processed. Collins has also developed PESTLEWeb model to aid the use of business environment. The PESTLEWeb model encodes the discrete items in business environment and also explores the rich web relationships among them through graphical notations (Collins, 1997). The model largely looks at the complex systems engineering and psychology of business environment to strategy development.
From these perspectives, studies done in business environment are categorised into the following; i. Describe the nature and form of the business environment as can be seen in PESTLE.
ii. Graphically showing the network of relationships among the elements of business environment as offered by PESTLEWeb model.
iii. The awareness level of business environment in the decision making process.
Important as all these study are, it is equally significant to look at the practical use of business environment and what goes into the practice. As the adage says ‘practice makes a man perfect’, it is so only when good practice is ensued. If wrong practice is undertaken or nothing is done on essential area of business, it may not qualify as the practice that makes perfection. Managers of organisations are to see business environment as important to their strategy. The failure to undertake environmental analysis can have considerable damage on business performance. Pearce et al (1982) have indicated that poor usage of environmental issues is a major contributor to the demise of many small and growing businesses.
Gibson’s Affordance Theory emphasizes the usefulness of business environment and the need to analyse. The Affordance Theory claims that the air affords breathing, ground affords standing and manipulation of a rope allows knitting, binding and knotting. The business environment affords organisations’ strategy whether or not mangers perceive them to be so. The aphorism that "Ask not what's inside your head, but what your head's inside of" succinctly captures the point to consider business environment in strategy implementation. Nightingale’s environmental theory about the relationship between patient and the environment is similar to organisation and its business environment. As the nurse role is to ensure good environment specific to the patient’s condition, so do managers to their organisations. The question is do managers understand specific environment necessary to the health of their organisation? Do managers work on ‘good’ environment as required by their organisations? Answers to these questions are what this paper has explored.
4.0 DESCRIPTIVE STATISTICS ON FREQUENCY OF ANALYSIS,RATING AS ENABLER,AND RATING AS
CHALLENGER FACTORS OF THE MACRO ENVIRONMENTAL FACTORS
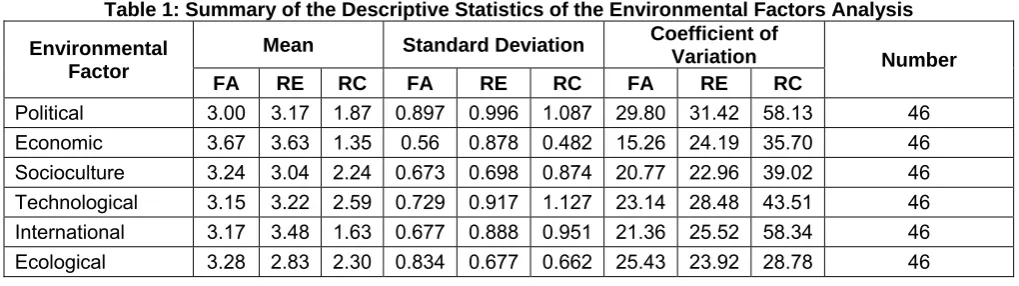
The macro environmental factors are made up of Political, Economic, Socioculture, Technological, International and Ecological. These factors affect strategic implementation actions. Respondents were asked to rate how frequent they analyse these factors, and how they consider the same factors in terms of scale as enabler and challenger to strategic management implementation practices. Using the scale of 4 (as the highest frequency) and 1 (as the least frequency’), the respondents gave the following information;
Table 1: Summary of the Descriptive Statistics of the Environmental Factors Analysis Environmental
Factor
Mean Standard Deviation Coefficient of
Variation Number FA RE RC FA RE RC FA RE RC
Political 3.00 3.17 1.87 0.897 0.996 1.087 29.80 31.42 58.13 46 Economic 3.67 3.63 1.35 0.56 0.878 0.482 15.26 24.19 35.70 46 Socioculture 3.24 3.04 2.24 0.673 0.698 0.874 20.77 22.96 39.02 46 Technological 3.15 3.22 2.59 0.729 0.917 1.127 23.14 28.48 43.51 46 International 3.17 3.48 1.63 0.677 0.888 0.951 21.36 25.52 58.34 46 Ecological 3.28 2.83 2.30 0.834 0.677 0.662 25.43 23.92 28.78 46
Note:
FA = Frequency of Analysis RE = Rating as Enabling Factor RC = Rating as Challenging Factor
4.1 Political Environment Factor
sometimes do when implementing their strategic management actions. This may be different from doing so for partisan objectives. The standard deviation of the rating of their analysis was high when compared with similar results. The coefficient of variation of 29.80 being the highest indicates that the rating of the frequency of analysis on political environment was dispersed. The rating of Political Environment as a business enabling factor was little above good on average. The standard deviation of 0.996 and coefficient of variation of 31.42 shows that the ratings were quiet dispersed compared to other factors. The mean rating of Political Environment as a business challenging factor of 1.87 indicates that respondents considered it as challenging to strategic management implementation actions. The standard deviation of 1.087 and coefficient of variation of 58.13 indicates high disperse of the rating. This suggest that Political factor is relatively analysed when undertaking strategic management implementation, it is also considered as good business enabler and poses challenge to strategic implementation practices.
4.2 Economic Environment Factor
On average, the economic factor was indicated as most analysed macroeconomic factor with mean score of 3.67 in terms of strategic management implementation practices. The standard deviation and coefficient of variation scores of 0.56 and 15.26 respectively shows how close were the ratings to the mean compared to the other factors. The economic factor was considered as very good business environment enabler with a mean score of 3.63. The standard deviation of 0.878 and coefficient of variation of 24.19 also shows how relatively disperse respondents were in their ratings. The mean rating of 1.35 as business challenging factor explains that, economic factor is considered to be a very challenging factor to strategic management implementation practices. The standard deviation score of 0.482 shows that the ratings were close to the mean but the score of 35.70 as the coefficient of variation suggest that there were some extremes of the ratings. However, the ratings can generally be considered as closed to the mean score.
4.3 Socioculture Environment Factor
The Respondents’ mean rating of their frequency of analysis on Socioculture factor was 3.24 indicating as something they do sometimes. The standard deviation of the rating of Socioculture analysis of 0.673 being the second among the factors shows that the ratings were disperse around the mean. The coefficient of variation of 20.77 is the next to economic factor in terms of variability in the rating. The Socioculture factor has a mean rate of 3.04 representing the last but one business enabler in comparative terms. As regards rating it as business challenging factor, respondents had a mean rating of 2.24 to indicate it as challenging. The standard deviation of 0.874 and coefficient of variation of 39.02 shows how the ratings were relatively dispersed around the mean score.
4.4 Technological Environment Factor
The Technological factor has a mean rate of frequency of analysis of 3.15 suggesting that respondents sometimes do when implementing strategic management decisions. The standard deviation of 0.729 and coefficient of variation of 23.14 also indicate that the spread of the rating were relatively similar to others apart from the Economic factor. With regards to the rating as business enabler and challenger, Respondents gave a mean value of 3.22 and 2.59 respectively. This means that the factor is a good business enabler and poses average challenge to strategic management implementation. The standard deviations of 0.729, 0917 and 1.127 for frequency of analysis, rating as business enabler and rating as business challenger respectively show the relatively spread of the rating around the mean.
4.5 International Environmental Factor
The mean rating of International factor analysis in strategic management implementation was 3.17 indicating that they sometimes do. On the rating of the factor as business enabler and challenger, respondents had a mean rating of 3.48 and 1.63 respectively to indicate that the factor is a very good business enabler and also challenging to strategic management implementation which is next to Economic factor. The standard deviation scores of the areas of ratings show similar results to the other factors.
4.6 Ecological Environmental Factor
The study also aimed at the significance of the educational background of the respondents on the rating of frequency of analysis, rating as business enabler and rating as business challenger. The Mauchly’s Test of Sphericity was used to determine the homogeneity of covariance among the respondents in terms of their educational background. The hypothesis tested was;
H0: Manager’s educational level does not affect analysis of macroeconomic factors. H1: Manager’s educational level affects analysis of macroeconomic factors.
Table 2: Summary of Mauchly’s Tests of Sphericity Within
subjects effects
Mauchly’s W Approx.
Chi-Square df Sig.
Epsilona Greenhouse
Geisser
Huynh-Feldt
Lower-bound
Political 0.865 6.368 2 0.410 0.881 0.914 0.5
Economic 0.955 2.024 2 0.363 0.957 0.998 0.5
Socioculture 0.988 0.543 2 0.762 0.988 1.000 0.5
Technological 0.701 15.638 2 0.000 0.770 0.792 0.5
International 0.802 9.711 2 0.008 0.835 0.863 0.5
Ecological 0.912 4.060 2 0.131 0.919 0.956 0.5
From the summary of the Mauchly’s Tests of Sphericity, the p-values Political, Economic, Socioculture and Ecological were more than 0.05. The p-values of Technological and International were 0 and 0.008 respectively indicating a lower value below 0.05. Therefore, for those environmental factors with p-values greater than 0.05 there is no evidence of heterogeneity of covariance among the respondents. For the two factors with p-values lesser than or equal to 0.05, the researcher took a more conservative test such as Greenhouse-Geisser tests.
Table 3: Tests of Within Subjects Effects
Factor Df Sphericity Assumed Df Sphericity Assumed (error) F Sig.
Technological 2 90 5.595 0.050
International 2 90 50.151 0.000
The p-values for the Technological and International factors are significant beyond 5% level. The researcher can therefore conclude that the knowledge gained in technology and international affairs does affect the rating of that macroeconomic analysis. Thus:
(i) Technology F(2,90) = 5.595; p ≤ 0.05 (ii) International F(2,90) = 50.151; p ˂ 0.00
The researcher therefore concludes that the rating of frequency of analysis made by respondents, their rating of the macroeconomic factors as business enabler and challenging factors are not connected to the level of education.
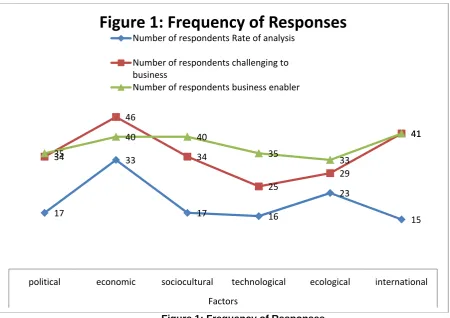
Figure 1: Frequency of Responses
From the figure 1 above, the numbers of the respondents who do macroeconomic analysis were below those numbers for the rating as business enabler and challenger. The first two factors analysed most by respondents were economic and ecological. Another set of three factors considered by respondents as enablers were economic, Socioculture and international. The two leading factors rated by most respondents as challenger were economic and international.
Apparently, more respondents accept that macro environment factors provide support and challenge to strategic implementation practices. However, less respondents do analysed them irrespective of their educational background. The worst gab exists in the international factor where 41 respondents rated the factor as both enabler and challenging but 15 do analysis during their strategic implementation practice. A close look at the economic factor reveals that, it scores highest in analysis and ratings in terms of business enabler and challenger. What then is the motivation? Perhaps, the economic factor provides what is needed and also serves as substance for strategic implementation success. The ecological factor also provides and interesting revelation. The question here is, do some managers apply the cognitive approach to business as emphasised by Craik and Lockhart (2008)? The cognitive psychology focus on ‘rationality’ which in this case may be based on business decisions on environmental factors that have greatest effect on organisations is a challenge in this context. Perhaps, the cause may be that business environmental analysis is less keen to such managers or are sleeping over the importance to gain in undertaking such valuable business activity. As small businesses hold promising opportunity to most economies, managers must be encourage on the use of business environmental lessons to gain competitive advantage in the global marketplace.
5.0 CONCLUSION
Business environment has been noted to be important to strategy implementation success. Considerable studies have been done to give prescriptive elements of macro environmental factors, consciousness of the macro environment effect on business success and the interrelationships and networking effects among macro environmental factors. As to whether managers are good at the usage of the macro factors in their strategy development remains less researched. This paper has statistically analysis the behaviour of managers on macro environment factors, hitherto, has been done qualitatively. The results have indicated political, economic and international factors as important to small organisations whose customers are in the export market. But analysis of these macro factors fall short of expectation. The continued scanning and analysis of macro environment remains important to small organisations such as those in handicraft exporting.
17
33
17 16
23
15 34
46
34
25
29
41 35
40 40
35
33
41
political economic sociocultural technological ecological international Factors
Figure
1:
Frequency
of
Responses
Number of respondents Rate of analysis
Number of respondents challenging to business
REFERENCES
Adair, J. (1984). Action Centred Leadership, McGraw-Hill.
Aguilar, F.J. (1967). Scanning the business environment. The Macmillan company. New York.
Albright, K.S. (2004). Evironmental scanning: Radar for success. Information Management Journal, 38(3), 38-45. Andrew, K.R. (1980). ‘The concept of corporate strategy: Revised edition’. Richard D. Irwin Inc. Homewood, Illinois. Astley, W.G. (1984). Toward an appreciation of collective strategy. Academy of Management Review, 9(3), 526-535. Astley, W.G. and Fombrun, C.J (1983). Collective strategy: Social ecology of organisational environments. Academy of
Management Review, 8(4), 576-587.
Barney, J. (1991). Firm resources and sustained competitive advantage. Journal of Management, 17(1), 99-120.
Barr, P.S. and Huff, A.S. ((1997). Seeing isn’t believing: Understanding diversity in the timing of strategic response. Journal of Management Studies, 34(3), 337-370.
Collins, R.J. (1997). The essential logic model: A method for documenting design rationale in safety critical systems. ESREL ’97.
Craik, F.L.M. and Lockhart, R.S. (2008). Levels of processing and Zinchenko’s approach to memory research. Journal of Russian and East European Psychology, 46(6), 52-60.
Drucker, P.F. (1994). The theory of business. Harvard Business Review, Sep/Oct, 95-104.
Schoemaker, P.J.H. and Day, G.S. (2009). Why we miss the signs. MIT Sloan Management Review, 50(2), 43-44.
Kaplan, R.S. and Norton, D.P. (2004). Strategy maps: Converting intangible assets into tangible outcomes. Boston, Harvard Business School Press: Massachusetts.
Horton, J., (2010). Strategy 2.0 Innovating: How we develop and execute strategy. MHD Suply Chain Solution, 56-59. Fuld, L. (2003). Be prepared. Harvard Business Review, 81(11), 20-21.
McEwen, T. (2008). Environmental scanning and organisational learning in entrepreneurial ventures. Entrepreneurial Executive, 13, 1-16
Pandza, K. And Thorpe, R. (2009). Creative search and strategic sense-making: Missing dimensions in the concept of dynamic capabilities. British Journal of Management, 20, S118-S131.
Kiesler, S. AND Sproull, L. (1982). Managerial response to changing environments: Perspectives on problem sensing from social cognition. Administrative Science Quarterly, 27, 548-570.
Tversky, B. (2005). Visuospatial reasoning. The Cambridge Handbook of Thinking and Reasoning, K.J. Holyoak and R.G. Morrison (eds). Cambridge: Cambridge University Press.
Berry, L. and Parasuraman, A. (1991). Marketing Services: Competing Through Quality. Free Press.
Bonoma, T. (1984). ‘Making your marketing strategy work’, Harvard Business Review, Vol. 62, No. 2, March-April, pp 68-76. Drummond, G. and Ensor, J. 2004. Strategic Marketing Planning and Control. Elsevier Butterworth-Heinermann. Oxford. Geert Duysters and John Hegedoorn. Strategic Group and Inter-Firm Networks in International High-Tech Industries.
Journal of Management Studies. Vol 32, Issue 2: pp 359 – 381, May 1995.
Geert Duysters and John Hegedoorn (1996). The Effect of Core Competence Building on Company Performance. www.merit.unu.edu/publications (date accessed: January 5th, 2015).
Kruehler, M. et al. (2012) Parenting Strategy: A Conceptual Answer, Journal of Business Strategy, Vol. 33, Issue 4. Lynch, R. (2003) Corporate Strategy, Pearson Education, England.
Mark Saunders, Philip Lewis, and Adrian Thornhill 2009. Research Methods for Business Students. Pearson Education. England.
Mintzberg, H. (1987) ‘Crafting Strategy’, Harvard Business Review, July-August.
Mintzberg, H. (1990) ‘The Design School: Reconsidering the Basic Premises of Strategic Management’, Strategic Management Journal, 11, pp176-95.
Mintzberg, H. (1994) ‘The Fall and Rise of Strategic Planning’, Harvard Business Review, January-February, pp107-14. Nightingale, F (1946). Note on Nursing: What it is, and What it is not. J. B. Lippincott Company, Philadelphia.
Peteraf, M. A. (1993). The cornerstones of competitive advantage’, Strategic Management Journal, 14, pp179-81.
Piercy, N. (1997). Market-led Strategic Change, 2nd edition, Butterworth-Heinemann.
Stacey, R. (1993) Strategic Management and Organisational Dynamics, Pitman Publishing, London.
Appendix 1: Political Environment Statistics
RATING_OF_ANALYSIS RATING_AS_ENABLER RATING_AS_CHALLENGER EDUCATIONAL_BACKGROUND
N Valid 46 46 46 46
Missing 0 0 0 0
Mean 3.00 3.17 1.87 3.09
Std. Deviation .894 .996 1.087 .865
Appendix 2: Political Environment - Mauchly's Test of Sphericityb
Measure:MEASURE_1 Within
Subjects
Effect Mauchly's W
Approx.
Chi-Square df Sig.
Epsilona
Greenhouse-Geisser Huynh-Feldt Lower-bound
factor1 .865 6.368 2 .041 .881 .914 .500
Tests the null hypothesis that the error covariance matrix of the orthonormalized transformed dependent variables is proportional to an identity matrix.
a. May be used to adjust the degrees of freedom for the averaged tests of significance. Corrected tests are displayed in the Tests of Within-Subjects Effects table.
b. Design: Intercept Within Subjects Design: factor1
Appendix 3: Political Environment - Tests of Within-Subjects Effects
Measure:MEASURE_1
Source Type III Sum of Squares Df Mean Square F Sig.
factor1
Sphericity Assumed 46.145 2 23.072 17.325 .000 Greenhouse-Geisser 46.145 1.763 26.182 17.325 .000 Huynh-Feldt 46.145 1.829 25.232 17.325 .000 Lower-bound 46.145 1.000 46.145 17.325 .000
Error(factor1)
Sphericity Assumed 119.855 90 1.332 Greenhouse-Geisser 119.855 79.313 1.511 Huynh-Feldt 119.855 82.298 1.456 Lower-bound 119.855 45.000 2.663
Appendix 4: Economic Environment - Descriptive Statistics
Mean Std. Deviation N
RATING_AS_ANALYSIS 3.67 .560 46
RATE_AS_ENABLER 3.63 .878 46
RATE_AS_CHALLENGER 1.35 .482 46
Appendix 5: Economic Environment - Mauchly's Test of Sphericityb
Measure:MEASURE_1
Within Subjects Effect Mauchly's W Approx. Chi-Square df Sig.
Epsilona
Greenhouse-Geisser Huynh-Feldt Lower-bound STR_IMPL_PRACTICES .955 2.024 2 .363 .957 .998 .500
Tests the null hypothesis that the error covariance matrix of the orthonormalized transformed dependent variables is proportional to an identity matrix.
a. May be used to adjust the degrees of freedom for the averaged tests of significance. Corrected tests are displayed in the Tests of Within-Subjects Effects table.
Appendix 6: Economic Environment - Tests of Within-Subjects Effects
Measure:MEASURE_1
Source Type III Sum of
Squares df
Mean
Square F Sig.
STR_IMPL_PRAC TICES
Sphericity Assumed 162.884 2 81.442 160.100 .000 Greenhouse-Geisser 162.884 1.914 85.104 160.100 .000 Huynh-Feldt 162.884 1.997 81.566 160.100 .000 Lower-bound 162.884 1.000 162.884 160.100 .000
Error(STR_IMPL_ PRACTICES)
Sphericity Assumed 45.783 90 .509 Greenhouse-Geisser 45.783 86.127 .532 Huynh-Feldt 45.783 89.863 .509 Lower-bound 45.783 45.000 1.017
Appendix 7: Socioculture Environment - Descriptive Statistics
Mean Std. Deviation N
RATE_OF_ANALYSIS 3.24 .673 46
RATING_AS_ENABLER 3.04 .698 46
RATING_AS_CHALLENGER 2.24 .874 46
Appendix 8: Socioculture Environment - Mauchly's Test of Sphericityb
Measure:MEASURE_1
Within Subjects Effect Mauchly's W Approx. Chi-Square Df Sig.
Epsilona
Greenhouse-Geisser Huynh-Feldt Lower-bound STR_IMPL_PRACTIC
E .988 .543 2 .762 .988 1.000 .500
Tests the null hypothesis that the error covariance matrix of the orthonormalized transformed dependent variables is proportional to an identity matrix.
a. May be used to adjust the degrees of freedom for the averaged tests of significance. Corrected tests are displayed in the Tests of Within-Subjects Effects table.
b. Design: Intercept Within Subjects Design: STR_IMPL_PRACTICE
Appendix 9: Socioculture Environment - Tests of Within-Subjects Effects
Measure:MEASURE_1
Source Type III Sum of Squares df Mean Square F Sig.
STR_IMPL_PRAC TICE
Sphericity Assumed 25.841 2 12.920 22.294 .000 Greenhouse-Geisser 25.841 1.976 13.079 22.294 .000 Huynh-Feldt 25.841 2.000 12.920 22.294 .000 Lower-bound 25.841 1.000 25.841 22.294 .000
Error(STR_IMPL_ PRACTICE)
Appendix 10: Technological Environment – Descriptive Statistics
Mean Std. Deviation N
RATING_OF_ANALYSIS 3.15 .729 46
RATE_AS_ENABLER 3.22 .917 46
RATE_AS_CHALLENGER 2.59 1.127 46
Appendix 11: Technological Environment - Mauchly's Test of Sphericityb
Measure:MEASURE_1
Within Subjects Effect Mauchly's W Approx. Chi-Square df Sig.
Epsilona
Greenhouse-Geisser Huynh-Feldt Lower-bound STR_IMPL_PRACTIC
ES .701 15.638 2 .000 .770 .792 .500
Tests the null hypothesis that the error covariance matrix of the orthonormalized transformed dependent variables is proportional to an identity matrix.
a. May be used to adjust the degrees of freedom for the averaged tests of significance. Corrected tests are displayed in the Tests of Within-Subjects Effects table.
b. Design: Intercept Within Subjects Design: STR_IMPL_PRACTICES
Appendix 12: Technological Environment - Tests of Within-Subjects Effects
Measure:MEASURE_1
Source Type III Sum of Squares df Mean Square F Sig.
STR_IMPL_PRACTI CES
Sphericity Assumed 11.058 2 5.529 5.595 .005 Greenhouse-Geisser 11.058 1.540 7.183 5.595 .010 Huynh-Feldt 11.058 1.583 6.983 5.595 .009 Lower-bound 11.058 1.000 11.058 5.595 .022
Error(STR_IMPL_P RACTICES)
Sphericity Assumed 88.942 90 .988 Greenhouse-Geisser 88.942 69.278 1.284 Huynh-Feldt 88.942 71.255 1.248 Lower-bound 88.942 45.000 1.976
Appendix 13: International Environment - Descriptive Statistics
Mean Std. Deviation N
RATING_AS_ANALYSIS 3.17 .677 46
RATE_AS_ENABLER 3.48 .888 46
RATE_AS_CHALLENGER 1.63 .951 46
Appendix 14: International Environment - Mauchly's Test of Sphericityb
Measure:MEASURE_1
Within Subjects Effect Mauchly's W Chi-SquareApprox. df Sig.
Epsilona
Greenhouse-Geisser Huynh-Feldt Lower-bound STR_IMPL_PRACTICES .802 9.711 2 .008 .835 .863 .500
Tests the null hypothesis that the error covariance matrix of the orthonormalized transformed dependent variables is proportional to an identity matrix.
a. May be used to adjust the degrees of freedom for the averaged tests of significance. Corrected tests are displayed in the Tests of Within-Subjects Effects table.
Appendix 15: International Environment - Tests of Within-Subjects Effects
Measure:MEASURE_1
Source Type III Sum of Squares df Square Mean F Sig.
STR_IMPL_PRACTIC ES
Sphericity Assumed 90.304 2 45.152 50.151 .000 Greenhouse-Geisser 90.304 1.669 54.094 50.151 .000 Huynh-Feldt 90.304 1.726 52.318 50.151 .000 Lower-bound 90.304 1.000 90.304 50.151 .000
Error(STR_IMPL_PR ACTICES)
Sphericity Assumed 81.029 90 .900 Greenhouse-Geisser 81.029 75.122 1.079 Huynh-Feldt 81.029 77.673 1.043 Lower-bound 81.029 45.000 1.801
Appendix 16: Ecological Environment - Descriptive Statistics
Mean Std. Deviation N
RATING_AS_ANALYSIS 3.28 .834 46
RATE_AS_ENABLER 2.83 .677 46
RATE_AS_CHALLENGER 2.30 .662 46
Appendix 17: Ecological Environment - Mauchly's Test of Sphericityb
Measure:MEASURE_1 Within
Subjects Effect
Mauchly's
W Approx. Chi-Square Df Sig.
Epsilona
Greenhouse-Geisser Huynh-Feldt Lower-bound
factor1 .912 4.060 2 .131 .919 .956 .500
Tests the null hypothesis that the error covariance matrix of the orthonormalized transformed dependent variables is proportional to an identity matrix.
a. May be used to adjust the degrees of freedom for the averaged tests of significance. Corrected tests are displayed in the Tests of Within-Subjects Effects table.
b. Design: Intercept Within Subjects Design: factor1
Appendix 18: Ecological Environment - Tests of Within-Subjects Effects
Measure:MEASURE_1
Source Type III Sum of Squares Df Mean Square F Sig.
factor1
Sphericity Assumed 22.043 2 11.022 16.921 .000 Greenhouse-Geisser 22.043 1.838 11.993 16.921 .000 Huynh-Feldt 22.043 1.912 11.526 16.921 .000 Lower-bound 22.043 1.000 22.043 16.921 .000
Error(factor1