A Statistical Analysis of Gross Revenue in Movie Industry
Andy W. Chen1 1
Sauder School of Business, University of British Columbia, Canada
Abstract:
In this paper, I investigate the impact of various factors on gross revenue using statistical models. I train linear regression models to explore the relationships between gross revenue, length of the movie, and movie budget. I find a positive relationship between gross revenue and budget with a correlation 0.74. I also find a slightly positive relationship between gross revenue and runtime with a correlation of 0.26. In addition, I find that there are approximately three clusters of the movie genres grouped by gross revenue.
Keywords: Movie Industry, Entertainment Industry, Statistics, Marketing
I. INTRODUCTION
The global movie industry generates hundreds of billions of revenues each year and is expected to grow to $50 billion in 2020[1]. There are various factors that affect the gross revenue of a movie such as year and month of release, genre, cast, director, and length of movie. In this paper, I explore the effect of various factors on gross revenue using statistical models. In particular, I build linear regression models of examine the relationships between gross revenue, length of movie, and movie budget.
Past research on the movie industry includes one by Chance et al.[2] used Markov chain Monte Carlo simulation to create a model for estimating revenue streams from innovations. Hennig-Thurau et al.[3] found that simultaneous release in theatres and rental home videos benefits U.S. movie studios but hurts theater chains. Moon et al.[4] study found that user ratings to be significant in predicting viewer satisfaction and that more movie viewing experience can actually cause viewers to give more critical comments. De Vany and Walls[5] found that movie piracy on the Internet decreases gross revenues of movies.
II. METHODS
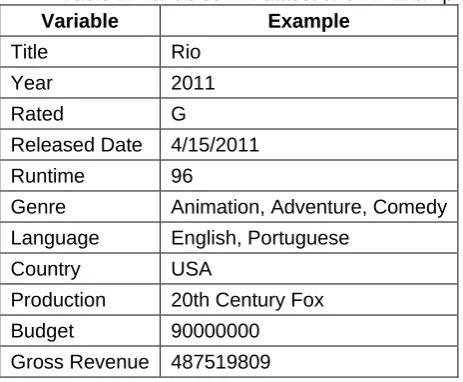
I gather a dataset with basic information of movies such as title, actor, budget, country, language, genre, budget, and gross revenue. Table 1 shows all the variables in the dataset and an example of a data point. The raw data contains 40,000 movies. There are some data points with mismatches between Year and Release Date. I remove such mismatches, but avoid removing more than 10% of the dataset. The final dataset contains 34,168 movies released between 1880's and 2010's
Table 1. Variables in Dataset and An Example
Variable Example
Title Rio
Year 2011
Rated G
Released Date 4/15/2011
Runtime 96
Genre Animation, Adventure, Comedy
Language English, Portuguese
Country USA
Production 20th Century Fox Budget 90000000
Gross Revenue 487519809
First I conduct some exploratory analysis such as plotting the distributions of some predictor variables such as length of movie, genre, and budget. I then build regression models of the response variable gross revenue vs. length of movie and budget to explore the relationship between the predictor and response variables.
III. RESULTS AND DISCUSSION
minutes. The peak is slightly less than 100 minutes. Figure 2 shows the boxplots of movie runtimes by decade. They show the medians and quartiles of the runtimes, with mean runtimes for all movies released during that decade at the top. These boxplots show that the mean and median movie runtime has an increasing trend since the 1880s. The inter-quartile range (25th to 75th percentile) has been decreasing over time, meaning that the middle 50% of movies are becoming more similar in running times. There are also some outliers with very long runtimes between 1970s and 2000s. It is worth noting that the ranking based on medians and means have some differences. Figure 3, the scatterplot of runtimes and budget, shows a positive correlation between them. The relationship is that more budgeted movies have longer running times. This is reasonable because more budget can be assumed to be spent on making extra footage. The variance in runtimes is higher for low budget movies, and this variance decreases as the budget increases.
Figure 1. Distribution of Movie Runtimes (Minutes)
Figure 2. Distribution and Means of Movie Runtimes by Decade
Figure 3. Movie Runtime vs. Budget
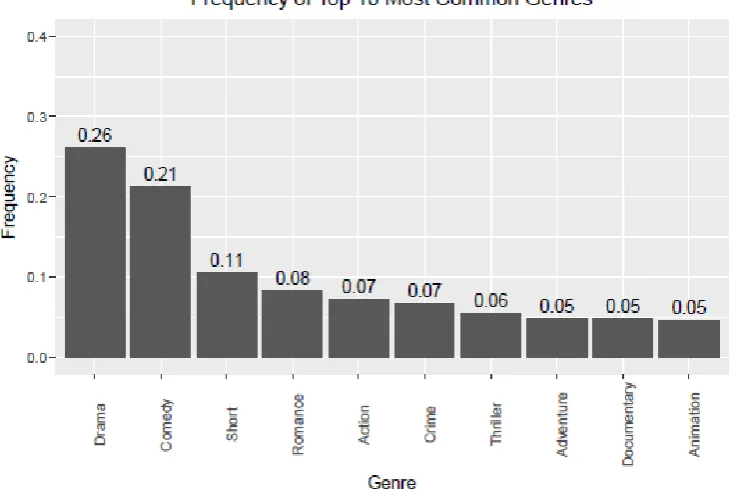
Next I show the distribution of top 10 genres in Figure 4. Among the top 10 common genres, the most common ones are drama, comedy, and short. The top two (drama and comedy) have significantly higher frequency than the rest (drama with 26% and comedy with 21%), while the other genres have no more than 11% occurrence among the top 10 genres. The least common ones are animation, documentary, and adventure. These three rare genres do not differ by much in frequency. Figure 5 shows that the distribution of runtimes is similar for the top 6 genres (similar inter-quartile ranges and mean of 96 to 99 minutes). The 8th longest genre, documentary, has a wider inter-quartile range than the rest. The shortest 2 genres, short and animation, have much shorter mean runtimes than the others (14 and 21 minutes) and have much smaller inter-quartile ranges. However, it is worth noting that for short and animation, the low means and medians could be due to a small number of data points. There are actually many data points above 75th percentile and many movies in these genres are in the 50 to 100 minutes range. It is worth noting that the ranking based on medians and means have some differences.
Figure 5. Distribution and Means of Movie Runtimes of Top 10 Most Common Genres
Figure 6 shows the relationship between gross revenue and budget, and Figure 7 shows the relationship between gross revenue and movie runtime. Figure 8 shows the pairwise relationships between gross revenue, budget, and runtime along with the correlation coefficients. The scatterplots show a positive relationship between gross revenue and budget (correlation coefficient of 0.74). However, the relationship between gross revenue and runtime is weaker (correlation coefficient of 0.26). The boxplots show the medians and quartiles of the gross revenue by genre, with mean runtimes at the top. There seem to be 3 groups of genres based on gross revenue. 6 genres (animation, adventure, action, family, sci-fi, and fantasy) are in the high group with over $150 million mean gross revenues and high medians. They also have greater variation in the distribution of gross revenues (large inter-quartile ranges). The median group includes 16 genres from adult to western (except news). This group has mean gross revenues from $45 to $95 million and smaller inter-quartile ranges. The low group consists of news, film-noir, and documentary with low mean gross revenues less than $25 million. They also have fewer movies than other genres. Adult films are the rare case where few movies average medium gross revenues. It is worth noting that the ranking based on medians and means have some differences.
Figure 6. Gross Revenue vs. Budget
Figure 7. Gross Revenue vs. Runtime of Movies
Figure 8. Pairwise Relationships Between Gross Revenue, Budget, and Runtime
IV. CONCLUSION
In this paper I present the results from statistical models that explore the relationships between gross revenue of movies and factors such as budget and movie runtime. The results show a positive relationship between gross revenue and budget, but a low correlation between gross revenue and movie runtime. The distributions of the variables also show interesting insights such as the bimodal distribution of movie runtimes, an increasing trend in movie runtime over time, and a positive correlation between budget and runtime. Future work may explore the relationship between gross revenue and ratings by users and critics, production company, director, and actor.
REFERENCES
[1] Fuller S. Film and Movie Industry - Statistics & Facts. Retrieved from https://www.statista.com.
[2] Chance DM, Hillebrand E, Hilliard JE. Pricing an Option on Revenue from an Innovation: An Application to Movie Box Office Revenue. Management Science. 2008;54(5):1015-1028.
[3] Hennig-Thurau T, Henning V, Sattler H, Eggers F, Houston MB. The Last Picture Show? Timing and Order of Movie Distribution Channels. Journal of Marketing. 2007;71(4):63-83.
[4] Moon S, Bergey PK, Iacobucci D. Dynamic Effects among Movie Ratings, Movie Revenues, and Viewer Satisfaction. Journal of Marketing. 2010;74(1):108-121.