Original Research Article
Patterns of physical activity among government and private school
children in coastal Karnataka
Gunjan Mahaur*, Sanjeev Badiger
INTRODUCTION
The wealth of a nation does not lie much in its economical and natural resources but more decidedly in the kind and quality of the health of its children and youth. It is they who will be the creators and shapers of a nation’s tomorrow. The children of today will be the adults of tomorrow. Their quality and personality will determine the kind of destiny that the nation will have. Therefore it becomes mandatory for every nation and every society to nurture a strong, healthy and intellectual youth. It is the responsibility of the adults to direct the youth in the desired direction.1
It's important for children to continue to lead a healthy lifestyle, including eating nutritious meals, as well as getting plenty of exercise and adequate sleep every day.
Children who embrace healthy eating and exercise habits during middle childhood will have a much easier time maintaining a healthy lifestyle through adolescence and adulthood than individuals who try to make the shift later
in life.1 WHO defines physical activity as a bodily
movement produced by skeletal muscles that
substantially elevate energy expenditure.2 Higher level of
physical activity is associated with low mortality rates for both adults and children. Those who are moderately active on a regular basis have lower mortality rates than those who are least active. Knowledge and understanding of the relationship between physical activity and health is important for the health care system to provide information regarding methods of treating and preventing illness through physical activity.3
ABSTRACT
Background: Higher level of physical activity is associated with low mortality rates for both adults and children. Those who are moderately active on a regular basis have lower mortality rates than those who are least active. Methods: A cross sectional study was conducted in private and government schools of Mangalore city from October 2015 to July 2017, study population was between 13 and 15 years adolescents. Sample size of 1000 was been obtained by using Proportional probability sampling. A pretested validated questionnaire was used for data collection. Data entry was done in Microsoft Excel and data analysis was done in SPSS version 22.
Results: Out of 1000 students, 130 was from government school and 870 from private schools. Physical activity level among government school children was found to be more than private school children (p<0.005). Government school children had more number of underweight students (70%) compared to private school children (37.5%).
Conclusions: This study showed that more research is necessary to evaluate intermediate factors and to determine which interventions are likely to be most effective to prevent childhood and adolescent obesity.
Keywords: Physical activity, Childhood obesity, Body mass index, Dietary behavior
Department ofCommunity Medicine, KSHEMA, NITTE University, Mangalore, Karnataka, India
Received: 14 June 2018 Revised: 26 July 2018 Accepted: 27 July 2018
*Correspondence: Dr. Gunjan Mahaur,
E-mail: [email protected]
Copyright: © the author(s), publisher and licensee Medip Academy. This is an open-access article distributed under the terms of the Creative Commons Attribution Non-Commercial License, which permits unrestricted non-commercial use, distribution, and reproduction in any medium, provided the original work is properly cited.
Promoting physical activity in children may increase physical activity in adulthood and help in reducing the
burden of chronic diseases such as diabetes,
hypertension, hypercholesterolemia, asthma, and
arthritis.4 A pattern of inactivity also known as
“Sedentism” begins early in life, and it promotes physical inactivity among children. For decades, physical activity has been associated with good health. Evidence also exists that physical education may enhance academic performance, self-concept and mental health. Current recommendation states that adults and children should strive for at least 30 minutes of moderate intensity physical activity daily, such as a brisk walk that makes
one feel warm and mildly out of breath.5
Recently we have reported that in boys physical activity explained a greater proportion of variation in BMI than their eating habits, while for girls it was their eating habits that explained the greater proportion of variation in
BMI.6
As there are very few studies conducted in this district, we have done this study to assess the knowledge and patterns of physical activity among school children.
METHODS
The present cross-sectional study was conducted in the selected schools of Manglore city from October 2015 to July 2017 in coastal Karnataka. The study population consist of 8th, 9th and 10th standard students of selected schools of Manglore city. Sample size was calculated using the technique and hypothesis for two proportions. The anticipated proportion of physical activity pattern in Government schools was assumed as 82% and the same in Private schools as 75% (Yashobant et al 2013) with
alter error as 5% and 80% power and two sided test.3
Thus the calculated sample size was 981, which was approximated to 1000.
n= {Z (1-α/22P(1-P) + Z1-βP1(1-P1)+ P2(1-P2)]2
(P1- P2)2
Where, P= (P1 + P2)/2
P1= proportion of first group (0.82)
P2= proportion of second group (0.75)
α= significance level 1-β=power (1.28) 1- α/2=1.96
The total number of senior secondary schools in urban settings of Mangalore is 115 out of which 25 are government and 90 are private. By using the lottery method, 3 schools were selected from government sector and 9 were from private sector (10% of schools).
Total no. of students in government school = 3,465 Total no. of students in private schools = 22,819 Total students in both schools = 26,284
3465/26284×100= 13.18= 13% 22819/26284×100= 86.8= 87%
By taking 13% from sample size for government school students which came to 130 students. Similarly, 87% for private schools was, 870 students.
Simple random sampling using lottery method was used for schools and Proportional probability sampling method was used for children. Inclusion criteria was students who were studying in 8th, 9th, 10th standard and who had studied for at least 6 months in the same school were included in the study. Students who were absent at the time of data collection were excluded from the study. To meet the above-mentioned objectives, the questionnaire was primarily developed based on similar studies done elsewhere3, which was validated by 3 experts in the field of community medicine. Linguistic and content validation was done. A pilot study was conducted to assess the validity and feasibility of the questionnaire and changes were made accordingly. The data was collected by self-administration method from the students. An English questionnaire was used in English medium schools. Kannada questionnaire was used in the Kannada medium schools.
The questionnaire consists of close ended questions related to demographic details which include name, age, sex and class. Activities done during spare time, activities during recess other than lunch were asked. Duration of time the students spend in sports, dancing and playing games .The answers for each item start from the lowest activity response being 1 and the highest activity response being 5. A physical activity composite score was calculated. Based on final PA score, children were categorized into three groups i.e. Mild, Moderate and Vigorous PA.
Anthropometric measurements were taken. Weight was measured using a standard weighing scale. Every time before measurement, it would be ensured that the value is calibrated to zero. Height was measured with a measuring tape. Students were made to stand erect without foot wear with feet together and head touching the wall. Both height and weight were taken using the standard
measures recommended by the World Health
Organization (WHO). These cut-offs are appropriate for developed as well as developing countries.
The current questionnaire consists of the following sections:
Section I- Basic demographic characteristics
Section II- Knowledge and physical activity patterns
Section III- Anthropometry
Section I- Basic demographic characteristics
Section II- Knowledge and physical activity patterns
Students are asked about the activities they have done in past 7 days like playing games, what they do in lunch break and free time, how many times they play sports, dance or other games during holidays, what type of transport they use for coming to school and their knowledge, source of information about physical activity, how many hours they spend in watching Television, playing video games and surfing internet.
Section III- Anthropometry
Height and weight of the students to calculate BMI.
The content of the tool was validated by 3 experts from the field of community medicine. Ethical clearance was obtained from the Institutional Ethics Committee of K.S.Hegde Medical Academy, Nitte University. Data entry was done using Microsoft Excel and data analysis was done using Statistical Package for Social Sciences (SPSS) version 22. Frequencies were calculated for categorical data and descriptive statistics was used to
calculate continuous data. Chi Square, likelihood ratio and multiple linear regression were used for data analysis.
P<0.05 was considered as significant. If ≤20% of the cells have expected count <5 then Chi square test was used, and if its >20% Likelihood ratio was used.
RESULTS
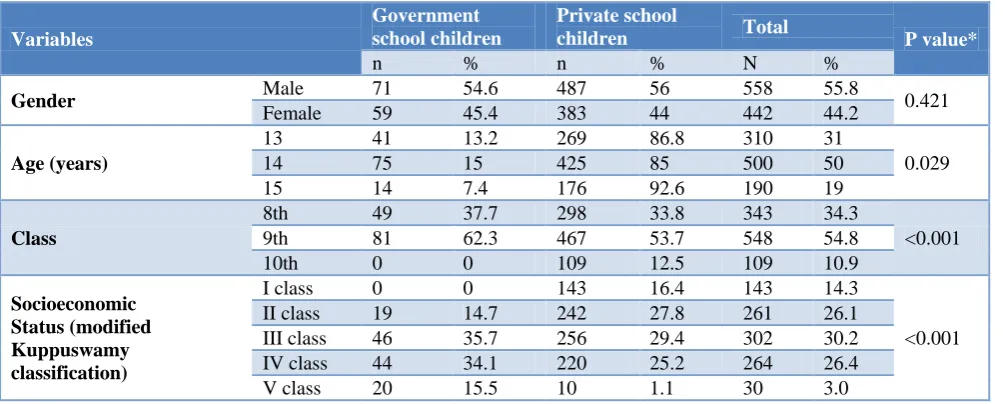
Table 1 shows sociodemographic characteristics of the study population. Total number of school children under study is 1000, under which government students 130 and private schools is 870. Total no of males are 558 (55.8%) and females are 442 (44.2%). In which number of males in government schools are 71(56.6%) and females are 59 (45.4%). Number of males in private schools are 487 (56%) and females are 383 (44%). Three age groups are been taken as 13, 14 and 15 year of age. Out of which 31% belongs to 13 years age group, 50% belongs to 14 years of age group and 19% belongs to 15 years of age group.
Table 1: Socio-demographic characteristics of study subjects (n=1000).
Variables
Government school children
Private school
children Total P value*
n % n % N %
Gender Male 71 54.6 487 56 558 55.8 0.421
Female 59 45.4 383 44 442 44.2
Age (years)
13 41 13.2 269 86.8 310 31
0.029
14 75 15 425 85 500 50
15 14 7.4 176 92.6 190 19
Class
8th 49 37.7 298 33.8 343 34.3
<0.001
9th 81 62.3 467 53.7 548 54.8
10th 0 0 109 12.5 109 10.9
Socioeconomic Status (modified Kuppuswamy classification)
I class 0 0 143 16.4 143 14.3
<0.001
II class 19 14.7 242 27.8 261 26.1
III class 46 35.7 256 29.4 302 30.2
IV class 44 34.1 220 25.2 264 26.4
V class 20 15.5 10 1.1 30 3.0
*Chi square and p<0.05 is considered significant.
Table 2: BMI among government and private school children (n=1000).
BMI (WHO)
Government school children Private school children Total
P value*
N % n % n %
Under weight 91 70 326 37.5 417 41.7
<0.001
Normal 39 30 277 31.8 316 31.6
Pre-obese 0 0 250 28.7 250 25
Obese-I 0 0 15 1.7 15 1.5
Obese-II 0 0 2 0.2 2 0.2
Total 130 100 870 100 1000 100
*Likelihood ratio; p<0.05 is considered significant.
Class 8th have 34.3% of the total population, class 9th have 59.8% and class 10th have 10.9% of the total population. Also 14% of the study population belongs to
maximum no of children belongs to class III and IV i.e. 35.7% and 34.1% respectively whereas no children in government schools belongs to class I. In private schools maximum number of school children belongs to class II
and III i.e. 27.8% and 29.4% respectively. Only 1% belongs to class V, which is statistically significant (p<0.001).
Table 3: Levels of physical activity in government and private school children (n=1000).
Physical activity
Government school children Private school children Total P value*
n % n % n %
0.001
Mild PA 33 25 245 28.2 278 27.8
Moderate PA 90 69.2 536 61.6 626 62.6
Vigorous PA 7 5.4 89 10.2 96 9.6
Total 130 100 870 100 1000 100
*Chi square test, p<0.05 is considered significant.
Table 2 shows BMI of government and private schools. Out of total 1000 student 41.7 are Under weight, 31.6% are Normal weight, 25% are Pre obese and 1.5% are Obese class I and only 0.2% are Obese class II. Government school children have more no. of Underweight children (70%) as compared to Private schools (37.5%), whereas normal weight students are almost equal in both the schools i.e. 30% in government and 31% in private schools. None of the students are pre-obese or pre-obese in government schools whereas in private schools around 28.7% are Pre-obese and 1.9% are obese in private schools which is statistically significant.
In Table 3 out of total study subjects (n=1000), 278 (27.8%) are engaged in mild physical activity, 626 (62.6%) are doing moderate physical activity and 96(9.6%) are doing vigorous physical activity. Mild level of physical activity was observed more in Private school students (28.2%) as compared to government school students (25%). Moderate level of physical activity was more in government school students (69.2%) than private (62.6%), whereas vigorous level of activity in private school students was almost double (5.4%) that government school students (10.2%). It is statistically significant with P-value of <0.005.
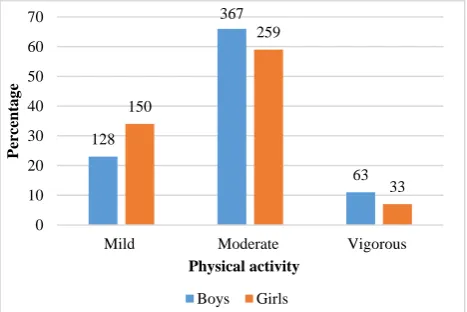
Figure 1: Physical activity level among boys (n=558) vs. girls (n=442).
*Chi square test; p=0.01 (<0.05 is considered as significant)
Figure 1 shows physical activity level boys and girls. Mild level of physical activity is seen more in girl students 34% as compared to boys 23%.whereas moderate physical activity level was seen more in boys (66%) as compared to girls (59%). Vigorous level of activity is seen more in boys (11%) as compared to girls (7%), with p value of 0.01 which is statistically significant.
DISCUSSION
Daily active play and physical activity have traditionally been an important part of life for children and adolescents. Today, computers and social media have decreased the need and desire for children to move and play. Participation in physical activity decreases with age. The challenges associated with getting children active every day should be met with age appropriate physical activities, enthusiastic leadership, and support from family and friends. Keeping all these things in mind this study has been conducted among adolescent age group in Mangalore school children. In the present study, mild level of physical activity was observed more in private school students (28.2%) as compared to government school students (25%). Moderate level of physical activity was more in government school students (69.2%) than private (62.6%), whereas vigorous level of activity in private school students was almost double (10.2%) than that government school students (5.4%). Though mid and vigorous level of physical activity was more in private school children, the overall level of physical activity was more in government school children as compared to private (p<0.005).
Similar findings were observed in a study done by Tayyem et al where a higher rate of inactivity was found
among students attending private schools.7
We also got opposite findings in a comparative cross
sectional study conducted by Yasobant.3 It was observed
that 82.4% of children were doing high physical activity in government schools whereas it was only 62.7% among private school children. But 37.3% of private school children were involved in moderate physical activity
128
367
63 150
259
33
0 10 20 30 40 50 60 70
Mild Moderate Vigorous
Perc
entag
e
Physical activity
whereas it was only 17.6% among government school children. This difference could be due to the small sample size used by Yasobant (sample size=102) whereas it was bigger in study done by Tayyem (sample size=735).
PA among boys and girls: In the present study, mild level of physical activity was seen more in girl students (34%) as compared to boys (23%) whereas moderate physical activity level was seen more in boys (66%) as compared to girls (59%). Vigorous level of activity was seen more in boys (11%) as compared to girls (7%) with p-value of 0.01. We observed similar findings in a comparative cross-sectional study done in Chennai by Yasobant et al which showed that physical activity level was high among male children (85%) whereas it was 61% among
females.3 But 38.8% of female children were involved in
moderate type of physical activity whereas only 17% of male children were moderately active (p=0.014). A study done by Pearson et al also found that boys were more active than girls (p<0.001).8 A study done by Kelishadi
also supports these findings.9 The reason why boys are
found to be more active that girls has been explained by the types of games they play and sedentary lifestyle in the rest of the discussion. A study conducted by Lu et al states that the parental physical activity was positively
associated with physical activity level in children.10
To assess the BMI of the student, height and weight of the students were measured at the time of visit to the respective schools. BMI was calculated using the formula
BMI= weight/(height)2. In this study we found that out of
1000 students, 41.7% were under weight, 31.6% were normal weight, 25% were pre obese, 1.5% were obese class I and only 0.2% were Obese class II . In a cross sectional study conducted by Madhavi et al in 1266 school children in Dehradun, Uttarakhand (2013), it was found that 15.6% of the children were over weight of
which 5.4% were obese.11 Also in a study was conducted
by MahaNubani-Husseini et al, the prevalence of
overweight and obesity was 22.2% and 7.6% respectively, with private schools having the highest rates
with 29.6% and 12.8% respectively (p=0.001).6
In the present study 28.7% were pre-obese and 1.9% were obese in private schools. None of the students were pre-obese or obese in government schools. Government school children had more no. of underweight children (70%) as compared to private schools (37.5%), whereas normal weight students are almost equal in both the schools i.e. 30% in government and 31% in private schools. This was found to be statistically significant (p≤0.001).
Similar findings were revealed by a study done by Jagadesan et al, Ashok et al and Tayyem et al where prevalence of obesity was significantly higher among adolescents in private (26.0%) than in public schools
(16.7%).12,13,7 Also a study done by Sangwan showed that
the BMI of private school students was significantly
higher than that of government school students.14
The children from private and government schools have different level of economic status and lifestyle patterns. Family members and parents of the children also have different amount of expectations from their kids. So, all these factors and many other factors collectively influence physical activity behaviour.
CONCLUSION
This study highlighted the patterns of physical activity among adolescent school children. It was observed that the level of physical activity varies from government to private schools. For example, the mid and vigorous level of physical activity was more in private school children but the overall level of physical activity was more in government school children as compared to private school children. Boys were found more active than girls. Children spend more time sitting (talking, reading, doing school work) during lunch break rather than playing around in past 7 days. In the present study more than 50% of the government students walk to schools but only 16% of the private school students go to school by walk which shows sedentary lifestyle of private school students. So this study showed that more research is necessary to evaluate intermediate factors and to determine which interventions are likely to be most effective to prevent childhood and adolescent obesity. Also there is a need for developing effective intervention programs to promote regular physical activity among school children.
Limitations of the study
Use of a self-reported questionnaire in schoolchildren could have influenced its validity and reliability. However, studies show that results from self-administered questionnaires tend to minimize social desirability bias compared to interviewer-administered questionnaires. Since the past 7 days activities were asked, there may be a chance for recall bias.
Funding: No funding sources Conflict of interest: None declared
Ethical approval: The study was approved by the Institutional Ethics CommitteeofNitte University
REFERENCES
1. Importance of Healthy Lifestyles - Child
Development Theory: Middle Childhood (8-11).
Library.aumhc.org. 2017 Available at:
http://library.aumhc.org/poc/view_doc.php?type=do c&id=37675&cn=1272. Accessed on 3 October 2017.
2. Gulati A, Hochdorn A, Paramesh H. Physical
activity patterns among school children in India. Indian J Pediatr. 2014;81:47-54.
3. Yasobant S, Meenujothsna N, Jeniferjebarani J,
schools of Chennai. Online Int Interdiscipl Res J. 2013;3(3):8-14.
4. Swaminathan S, Selvam S, Thomas T, Kurpad AV,
Vaz M. Longitudinal trends in physical activity patterns in selected urban south Indian school children. Indian J Med Res. 2011;134:174-80.
5. Dhanpal S, Pavitthra MB, Pruthvish S. A study on
physical activity and obesity amongst secondary school children. Res Rev J Med Health Sci. 2014;3(2):112-7.
6. Nubani-Husseini M, Berry E, Abdeen Z, Donchin
M. Dietary patterns and physical activity among Palestinian female schoolchildren in East Jerusalem (Original research). South Eastern European J Pub Health. 2016. Doi: 10.4119/UNIBI/SEEJPH-2016-92.
7. Tayyem RF, Bawadi HA, AbuMweis SS, Allehdan
S, Agraib L, Ghazzawi HA, et al. Dietary habits and physical activity levels in Jordanian adolescents attending private versus public schools. EMHJ. 2014:20(7):416-23.
8. Pearson N, Atkin AJ, Biddle SJH, Gorely T,
Edwardson C. Patterns of Adolescent Physical Activity and Dietary Behaviours. Int J Behavioral Nutr Physical Acti. 2009;6:45.
9. Omar H, Rager K. Prevalence of obesity and lack of
physical activity among Kentucky adolescents. Int J Adolesc Med Health. 2005;17(1):79-82.
10. Lu C, Stolk RP, Sauer PJJ, Sijtsma A, Wiersma R,
Huang G, et al. Factors of physical activity among Chinese children and adolescents: a systematic review. Int J Behav Nutr Phys Act. 2017;14:36.
11. Bhargava M, Kandpal S, Aggarwal P. Physical
activity correlates of overweight and obesity in school-going children of Dehradun, Uttarakhand. J Fam Med Prim Care. 2016;5(3):564.
12. Jagadesan S, Harish R, Miranda P, Unnikrishnan R,
Anjana R, Mohan V. Prevalence of overweight and obesity among school children and adolescents in Chennai. Indian Ped. 2014;51(7):544-9.
13. Ashok N, Kavitha H, Kulkarni P. A comparative
study of nutritional status between government and private primary school children of Mysore city. Int J Health Allied Sci. 2014;3(3):164.
14. Sangwan D. A study of body mass index between
private and government school children. Int J Physical Edu Sports Health. 2016;3(1):63-5.