Abstract—This paper presents the final investigation within the series of qualitative and quantitative investigations carried out for the processing and analysis of geographic land-use data in an agricultural context. The geographic data was made up of crop and cereal production land use profiles. These were linked to previously recorded climatic data from fixed weather stations in Australia that was interpolated using ordinary krigeing to fit a grid surface. In this study, the profiles for the stochastic average monthly temperature and rainfall for a selected study area were used to determine their simultaneous effects on crop production at the shire level. The temperature and rainfall were sampled for a selected decade of crop production for the years from 2001 to 2010. The evaluation was carried out using graphical, correlation and data mining regression techniques in order to detect the patterns of crop production in response to the climatic effect across the cropping shires of agricultural region. Data mining classification algorithms within the WEKA software package were used with location as the classifier to make comparisons between predicted and actual wheat yields. The predicted patterns suggested that crop production is affected by the climate variability especially at certain stages of plant growth for some shires.
Index Terms—Arc GIS grass, quantum GIS, land-use, temperature, rainfall, crop production.
I. INTRODUCTION
Although crop production has been linked to a number of factors such as seasonal temperature, temperature variations, radiation, evaporation, soil moisture and crop management practices [1], this work investigated the effect of rainfall in conjunction with temperature variability on crop production. It formed part of a continuation of the previous work of the effect of rainfall and temperature separately on crop production. The aim of this work was to determine the relationship between climate variables such as rainfall and temperature taken together on the actual crop production at the shire level that was scaled to a grid cell resolution of 1000m. The research was carried out in order to verify the agricultural land use at these locations as well as to provide the agricultural industries an insight for crop decision making. Consequently, this work was site-specific and also had a grid-cell spatial significance. In addition, the research was carried out to possibly predict the crop production at certain locations within the agricultural region, given the prevalent rainfall and temperature conditions. According to Olesin and Bindi (2002) the factors of rainfall, radiation, temperature
Manuscript received July 23, 2012; revised September 3, 2012. The authors are with the School of Computer & Security Science, Edith Cowan University, Mt.Lawley, WA 6050, Australia (e-mail: [email protected]; j.xiao@}ecu.edu.au)
and temperature variation all affect yield to some degree with increased temperature variability especially increasing the crop yield variability [2]. The winter wheat crop yield is especially conducive to cold winters and hot summers when taken in conjunction with other management factors such as rainfall, sowing time, stage of plant growth, fertilization and harvesting over the growing season of wheat from May to September in the agricultural region of South Western Australia [1].
Spatial scales are important in that the scale related results are specific to the related group or agency. For example, the national scale may be used by governments to determine their economic strategy from food reserves [3], while results from smaller scale relationships, being used to detect food shortages and associated mitigation possibilities [4], and for seasonal forecasting by farmers at the farm level [5]. This study will investigate the correlations between these factors on a spatial scale that is somewhere between the farm level (small) and the whole agricultural region level (large). This intermediate level was the shire level (medium) and the temperature and rainfall readings were aggregated upwards from the fine resolution of 1000m of a GIS grid cell. This was due mainly to the availability of crop yield data on the shire level as well as the way in which the Western Australia system operates. For the purposes of focus and scope as well as to highlight the relationships between temperature variability, rainfall and yield variability, 10 specific production years from 2001 to 2010 were selected.
II. RELATED WORK
The effect of observed seasonal climatic conditions such as rainfall and temperature variability on crop yield prediction has been undertaken by Trnka et al. through an empirical crop model [2]. Interactions between input variables such as temperature variability and output variables such as crop yield have been shown to be important and have affected the yields statistically [2]. In particular, the relevance of changing temperatures was emphasized at critical phenological growth stages of a crop such as wheat [6]. Previous research has found that the yields of winter wheat are reduced when temperatures rise, due to the consequent reduction of the growth phases of the plant [7], [8]. There are two approaches for developing models and these are the process based crop models (CM) for the establishment of non-linear relationships between weather variables and crop yield and general circular models (GCM) of the coupling of the ocean and the atmosphere. The use of GCMs for prediction at a seasonal lead-time, suffer from the problem of simulation of too many low intensity temperature instances
A Data Mining Perspective of the Dual Effect of Rainfall
and Temperature on Wheat Yield
within each grid cell [9]. Other problems with these models include the coarse granularity of the spatial resolution and the less than accurate simulation of the local current climate [10]. As short term weather forecasting rather than long-term climate forecasting is important [11], this study was therefore more suited to the CM approach. Furthermore, there are two approaches to investigating the impact of climate change on crop production which include the crop suitability approach and the production function approach [10]. The crop suitability approach, also known as the agro-ecological zoning (AEZ) approach, uses climate to determine crop suitability at an agricultural location using simulated rather than measured crop yields [12]. On the other hand, the production function approach uses either an empirical or experimental production function to measure the relationship between crop production and climate change [13]. The complexity of any crop model can be based on the level of detail of the analysis [14], or they can be less detailed with only estimations of moisture content [15]. Other approaches have been the use of normalized difference vegetative index (NDVI) for grouping homogeneous regions to establish the scale [16]. There have also been approaches to crop modelling using the derivation of a probability distribution function (PDF) for the assessment of quantifying the risks and benefits of making weather based decisions [17]. Although according to Sivakumar (2006), notwithstanding that considerable improvements in understanding and predicting climate variability have been made, the need to further develop understanding and refine tools is ever increasing [18], especially because the atmosphere is intrinsically a chaotic system as well as due to the phenomenon of climate change [19].
III. MATERIALS AND METHODS
The study area was a rectangular grid of 104328 cells of 1000m2 each, stretching from Busselton in the west to Esperance in the east across the South Western Agricultural region of Western Australia. The ArcGIS, ERMapper and GeoMedia software packages were used to create the study area and the land use profiles. In addition, all the datasets were fitted specifically to the extraction region of the selected study area. Each of the shires within the study area was made up of a number of the 100 hectare grid cells. The climate data included both rainfall and temperature. Historical temperature and rainfall data existed only at specified sparsely located weather stations within the study area. In order to overcome the limitation of a sparse dataset associated with the weather stations, a process of interpolation was carried out using an R script resulting in temperature and rainfall data points at each 100ha cell of the study area grid for the 12 months for the years 2001 to 2010. The temperature and rainfall profiles were fitted onto the high resolution grid surface. This was done for maximum temperature, minimum temperature, temperature variation and rainfall for the growing season months of April to September. The monthly climate data was scaled to match the annual production data using an R script where the final aggregated data was sorted in shire order. This dataset was then analysed for the wheat crop yield in relation to the
rainfall and temperature variants across the shires.
IV. EXPERIMENTAL RESULTS AND ANALYSIS There were a number of aspects to the data handling and the analyses. They included the pre-processing and metrics, the analysis of the rainfall, temperature and the individual wheat crop yields as part of the macroscopic phase. In addition, there was the DM analysis of the individual wheat crop yields which formed the microscopic phase.
A. Pre-processing and Metrics
The study area within the South West Australian agricultural zone encompassed a number of shires. Normalisation of the differently sized shires was calculated by dividing the tonnes delivered in each shire by the delivery area of the shire in order to determine the crop yields in tonnes/hectare. The rainfall, maximum, minimum and variation in temperature for the years 2001 to 2010 and the months from April to September were averaged for each shire using an R script individually. These were then collated with the wheat crop yield data for the same 10 year period in MS ACCESS for each of the shires to produce one aggregated file in preparation for the DM analyses in WEKA. The visual inspection of the graphs required a uniform method of evaluation. This was in the form of a baseline metric of classifying the shires into rainfall categories of high yield (HY) of over 45,000 tonnes per shire and low yield (LY) of less than 45,000 tonnes per shire per annum. Accordingly, the HY shires were Dumbleyung, Esperance, Gnowangerup, Jerramungup, Katanning, Kent, Kulin, Lake Grace, Ravensthorpe and Wickepin. The LY shires were Boddington, Boyup Brook, Broomehill, Cranbrook, Kojonup, Narrogin, Tambellup, Wagin, West Arthur, Williams and Woodanilling.
B. Analysis of Climate Variables
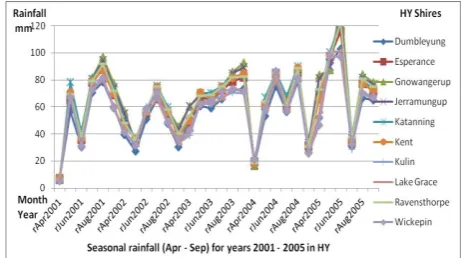
The first stage in the analysis was the general visual inspection of the data which was part of the exploratory data mining (EDM) process for the rainfall and temperature for the crop growing season months of April through to September for the 21 crop yielding shires in the agricultural region of the South West of Western Australia. The variations in average monthly rainfall were plotted for the selected years in the decade from 2001 – 2010 as two 5 year datapoint time series charts of which only the first 5 year plot were depicted in Fig. 1 (HY shires) and Fig. 2 (LY shires).
Fig. 2. Average monthly rainfall for the LY shires in the 2001-2005 decade.
It was evident from the graphs that the rainfall patterns were similar for both the HY and LY shires except that the LY shires experienced a marginally higher rainfall. For example the HY shire of Jerramungup received a lower rainfall of 89.7 mm (Fig. 1) as opposed to the LY shire of Tambellup which received a higher rainfall of 96.7 mm (Fig. 2) for September 2003. In addition, the steep rise to high rainfalls in June and July and sharp declines to September, were very pronounced for 2001, 2002 and 2005. The rainfall patterns of 2001, 2003 and 2005 were prominent especially with the high rainfall year of 2003 were rainfall was low in August and September. The rainfall trends for the following five years from 2006 to 2010 were not depicted here graphically for the sake of brevity. However, the trend was similar in that both the HY and LY shires matched each other more closely. For example, the HY shire of Katanning received a rainfall of 125.9 mm as opposed to the LY shire of Tambellup which also received a high rainfall of 124.3 mm for July 2009.
Fig. 3. Ave max monthly temperature for the HY shires over 2001-2005.
The maximum temperature for the all the shires in the study area for the decade from 2001 – 2010 was plotted, of which only the first 5 years are shown in Fig. 3 (HY shires) and Fig. 4 (LY shires). The visual inspection of the datapoint plot for the maximum temperature in Fig. 3 and Fig. 4 showed some interesting features. The highest maximum temperature occurred at the HY shire of Gnowangerup (28.6°C) and at the LY shire of Boyup Brook(29.6 °C) in April 2001. The lowest maximum temperature was at Wickepin (14.9°C) and at Woodanilling(14.7°C) in June 2005. The highest mean maximum temperature for the 5 years in HY shires was 25.6°C in Apr 2001 and lowest mean maximum temperature was 15.7°C in Jul 2004.
Fig. 4. Ave max monthly temperature for the LY shires over 2001-2005.
The temperature trend for the following five years from 2006 to 2010 was not depicted here graphically for the sake of brevity. However, the trend was similar in that the highest maximum temperature was recorded at the LY shire of Williams (25.8°C) in April 2009 and at the HY shire of Ravensthorpe (25.8°C). The lowest temperature occurred at Woodanilling (14.6°C) in July 2008 and at Wickepin (14.8°C) in July 2009. The highest mean maximum temperature for the 5 years in the HY shires was 26.1°C in April 2001 and lowest mean maximum temperature was 15.8 °C in June 2005. The maximum temperature ranged from 15°C to 30°C for both the HY and LY shires. Overall the maximum temperature for the 5 years was lower for the LY shires than the for the HY shires.
The preceding rainfall and temperature visual inspections were followed by an examination of the wheat yield across all the shires in the study area for the decade from 2001-2010. This process marked the beginning of the exploratory data mining of the wheat yield.
C. Analysis of the Wheat Crop Yield
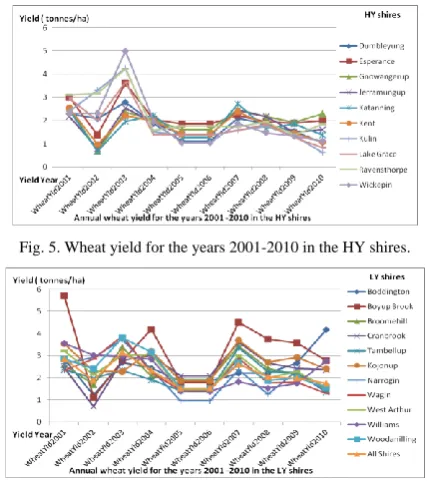
The EDM was the analysis of annual wheat crop yields over the decade for the years 2001 to 2010 across all the shires in the study area of the agricultural growing region. This was a two stage process where the wheat yields were taken both individually and in conjunction with rainfall and temperature variables. The individual wheat yields for the HY and LY shires were shown in Fig. 5 and Fig. 6 respectively. The wheat yields for 2003 were the highest for most of the HY shires especially for the shire of Wickepin, with low yields at some of the HY shires such as Gnowangerup for the year 2002. This corresponded well with the rainfall for those two years. Conversely, the wheat yields for the LY shires revealed that the shire of Boddington performed well in 2001, 2004 and 2007 with the shire of Woodanilling producing a low yield in 2002 and high in 2003.Overall the LY shires had higher annual wheat yields than the HY shires in all of the years from 2001 to 2010 with notably high yielding exceptions such as the shire of Boyup Brook.
Fig. 5. Wheat yield for the years 2001-2010 in the HY shires.
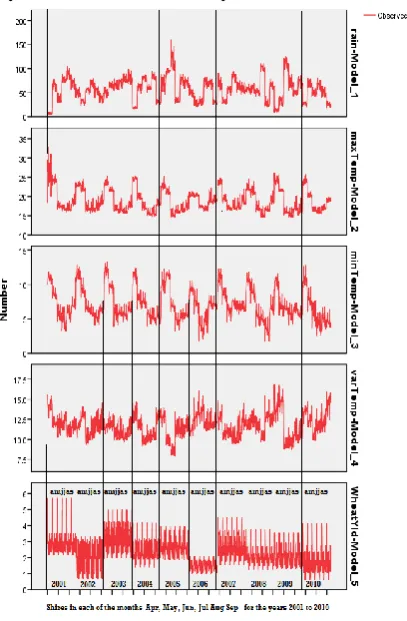
The second stage of the EDM of the wheat yield was the examination of the combined effect of rainfall and temperature on the wheat yield. The dataset included the April to September snapshots for the attributes for rainfall, temperature (maximum, minimum, variation) and the annual wheat yield. The results were plotted simultaneously as a time-series chart in SPSS as shown in Fig. 7.
The visual inspection of the rainfall graph highlighted the year 2005 as a particularly wet year, with some shires receiving rainfall around 150mm in June and July. However, the wheat yields were not correspondingly high for 2005. The dry years were also visible as 2002, 2006 and 2010. The wheat yields for these years were correspondingly very low in general and for 2006 in particular, and extremely low in some shires for 2002 and 2010. The wheat yield in 2001 was very high in most shires and was exceptionally high for the LY shires with a wheat yield of 5.7 tonnes/ha for the shire of Boyup Brook as per Fig. 6. The only outstanding characteristic was the higher maximum temperatures in 2001 at the LY shires as opposed to the other years in the selected decade. Although the year 2003 was a low rainfall year, the rainfall steadily increased over the growing season months. In addition the maximum and minimum temperatures were fairly uniform over the growing season. This steady rainfall increase and temperature consistency produced a reasonable wheat yield for 2003. The wheat yield for 2007
Fig. 7. Time series sequence chart for the 10 years.
was similarly characterizedfor rainfall and temperature except the variation in temperature was higher. The wheat yield for 2007 was therefore similar to the year 2003. The wheat yield for 2009 was slightly lower than for 2005 and the year 2009 had higher rainfall for the growing season months. For the purposes of clarification, a mean seasonal rainfall below 50mm was rated as dry, 51-60mm as average and over
60mm as wet. Mean seasonal temperatures between 18 to 18.5 degrees were rated as low, 18.51 to 19.00 degrees as medium and over 19.00 degrees as high. Wheat yields of 1.50 to 2.00 tonnes/hectare were rated as low, 2.01 to 2.50 tonnes/hectare as medium, and 2.51 to 3.00 tonnes/hectare as high and over 3.01 tonnes/hectare as very high. These observations were summarized in Table I.
Accordingly, one could expect the wheat yield to be high when the rainfall was above 56mm and the seasonal temperature was over 18.51 degrees Celcius. However, it was uncovered that the yield could still be high with lower temperatures, provided that the rainfall was very high such as 76.45mm for the year 2005.
It was also apparent from the simultaneous plot in Fig. 7, that rainfall affected the maximum temperature, as was evident for the years 2003 and 2005. Generally, the wheat yield was high when the rainfall was high and the maximum temperature low. Under these conditions, the LY shires produced higher yields. High temperature variations also decreased the wheat yield. The conclusions from these observations were as a result of visual correlations constructed from the data.
In order to augment the correlation analyses, a facility for prediction through the use of regression was necessary. Consequently, DM was explicitly chosen for this purpose in order to reveal potentially hidden patterns and relationships that would otherwise be obfuscated by the multiplicity as well as the opposing nature of the variables.
D.Data Mining Analysis
The next step in the individual scrutiny of the exercise was the use of regression in order to determine if the relationship established through simple observed correlation could be supported by a mechanism of predicting the wheat crop yield through the variation in temperature across the growing months from April through September. This was carried out using the classification technique of DM in the Waikato Environment for Knowledge Analysis (WEKA) software. The aggregated data for average monthly rainfall, maximum, minimum and variation in temperature together with the wheat crop yields for the 21 shires was used for this activity. In addition, an average of all the shires was added for the mean crop yield and temperature variables. The shires were sorted into HY and LY groups. The aggregated wheat crop yield and the average monthly maximum temperatures and rainfall dataset was split up into a training set and a test set.
TABLE I: GENERAL WHEAT YIELD RESPONSE TO MEAN SEASONAL RAINFALL AND MAXIMUM TEMPERATURE.
Year Mean Rainfal l
Rainfal l rating
Mean Temp
Temp Ratin g
Annual Yield
Yield Ratin g 2001 56.84 Ave 19.93 High 2.85 High 2002 49.32 Dry 19.22 High 1.89 Low
2003 68.62 Wet
18.75 Med
3.15
The training set comprised the data for the years 2001, 2004 and 2006 and the test set was made up of the data for years 2002, 2003, 2005, 2007, 2008, 2009 and 2010. The choice of the years for the test set was based on obtaining a mix of predictions for the dry, wet and productive years. The exploratory part of the DM activity was to use the training set to determine the best-fit algorithm using a simple model of crop yield as a function of the location class and the average maximum monthly temperatures for the growing season months as the attributes. A test of all of the classification algorithms that used regression for predicting continous values in response to input values, was made to determine correlation results and root mean square errors (RMSE). The correlation and RMSE results were omitted here for brevity. The algorithm with the best performance in these criteria turned out to be GP with a correlation of 0.9874 and a RMSE for the training set of 0.3336 as well as a RMSE of 0.6724 for the cross validation run and RMSE of 0.8168 for the test set. Consequently, the results for using the GP algorithm were used for the analyses and split into two tables of actual and predicted wheat crop yields, one for the years 2003 and 2005 and another for the years 2007 and 2009 as Table II and Table III respectively.The shires in both tables were grouped into HY and LY shires, where the LY shires were denoted by blue shading. The average of all the shires was denoted as the All
Shires location and was unshaded.
With reference to Table II, there were both underestimated and overestimated predictions for the shires for the high crop yield year of 2003. None of the HY shires had positive prediction errors. On the other hand, only the LY shires of Boddingtion and Williams had positive prediction errors for the year 2003. On a discerning grade scale, good predictions were considered to have a percentage error of less than 20%, with average predictions a percentage error of 21-40% and weak predictions a percentage error of over 40%. Accordingly in 2003, the HY shires of Dumbelyung (17.2%), Esperance (17.2%), Jerramungup (19.7%), Katanning (19.1%), Kulin (5.9%), Lake Grace (11.3%), Ravensthorpe (16.1%) and Wickepin (1.3%) except Gnowangerup (33.2%) and Kent (37.2%) had good predictions. Conversely, the LY shires performed worse than the HY shires with good predictions for the shires of Boddington (1.0%) and Narrogin (3.2%). The shires of Broomehill (38.0%), Cranbrook (39.5%), Kojonup (44.7%), Wagin (25.2%), Williams (22.0%) and Woodanilling (39.5%) all had average predictions. Only the shires of Boyup Brook (42.5%), Tambellup (42.6%), West Arthur (54.0%) had weak predictions. Overall both HY and LY together had an average prediction with a prediction error of 27.4%.
The prediction results for the wet year 2005 were slightly better. Overall there were more negative prediction errors for the year 2005 for both the HY and LY shires. All of the HY shires had negative prediction errors whilst all except the shire of Boyup Brook (0.2) had negative prediction errors. On the good, average and low scale, all of the HY shires had good predictions. The HY shires of Dumbleyung (9.2%), Esperance (16.7%), Gnowangerup (2.5%), Jerramungup (0.5%), Katanning (0.7%), Kent (2.1%), Kulin (16.2%), Lake Grace (5.7%) and Ravensthorpe (12.2%) all had good predictions with a weak prediction for Wickepin (21.4%)
only. On the other hand the LY shires of Boyup Brook (13.9%), Broomehill (14.2%), Tambellup (18.8%), Williams (14.2%), Wagin 12.0%), Narrogin (0.7%) had good predictions whilst Cranbrook (33.9%), Kojonup (23.4%), West Arthur (39.5%) and Woodanilling (29.8%) had average predictions with the only weak prediction for Boddington (43.1%). Overall, all the shires together had good predictions of 14.7%. Generally the prediction errors relative to the combined effect of rainfall and temperature were better in 2005 than in 2003.The DM results using the GP algorithm for the years 2007 and 2009 were shown in Table III.
In 2007, the HY shires of Dumbelyung (4.2%), Esperance (0.6%), Jerramungup (10.0%), Katanning (18.7%), Wickepin (17.3%), Gnowangerup (10.6%), Kent (7.7%) had good predictions whilst Kulin (37.9%), Lake Grace (39.6%), Ravensthorpe (28.2%) had average predictions. Conversely, the LY shires performed worse than the HY shires with good predictions for the shires of Boddington (1.1%), Narrogin (6.5%) and Woodanilling (16.1%) had good predictions
TABLE II: WHEAT YIELD WEKA GP RESULTS ALL FEATURES.
HIGH YIELD YEAR 2003 HIGH RAINFALL YEAR 2005 Rural Shire HY+ LY Actual Yield ton/ha Pred. Yiel d ton/h a % Error Actual Yield ton/ha Pred. Yield ton/h a % Error Dumbleyun
g 2.69 2.19
17.2
1 2.46 2.23 9.23
Esperance 2.78 2.23 17.2
3 2.68 2.23 16.7
2 Gnowanger
up 3.37 2.30
33.2
3 2.29 2.23 2.49 Jerramungu
p 2.77 2.25
19.7
1 2.22 2.23 0.54
Katanning 2.79 2.22 19.1
4 2.22 2.24 0.68
Kent 3.6 2.26
37.1
7 2.28 2.23 2.06
Kulin 2.37 2.26 5.95 1.92 2.23 16.2
5
Lake Grace 2.55 2.23 11.2
9 2.11 2.23 5.69 Ravensthor
pe 1.96 2.26
16.1
7 2.54 2.23 12.2
0
Wickepin 2.21 2.28 1.31 1.84 2.23 21.4
1
Boddington 2.28 4.47 0.96 3.93 2.24 43.0
8 Boyup
Brook 4.26 5.57 42.5
4 2.6 2.24 13.8
8
Broomehill 3.65 3.01 38.0
5 2.61 2.23 14.4
1
Cranbrook 3.73 2.97 39.4
6 3.38 2.23 33.9
1
Kojonup 4.22 4.82 44.7
2 2.92 2.24 23.4
2 Narrogin 2.33 3.54 3.26 2.22 2.24 0.72
Tambellup 3.89 2.87 42.6
0 2.75 2.23 18.8
0
Wagin 3.00 2.74 25.2
0 2.54 2.24 12.0
1
West Arthur 5.00 4.87 53.9
6 3.7 2.24 39.5
1
Williams 2.97 4.68 21.9
9 2.61 2.24 14.2
1 Woodanilli
ng 3.80 4.12
39.5
3 3.19 2.24 29.8
4
All Shires 3.15 3.60 27.4
0 2.62 2.24 14.6
whilst the shires of Broomehill (34.9%), Cranbrook (37.9%), Kojonup (39.1%), Tambellup (34.3%), Wagin (23.5%), West Arthur (25.7%) and Williams (23.5%) all had average predictions. Only the shire of Boyup Brook (49.4%) had a weak prediction. Overall both HY and LY together had an good prediction of 14.9% for 2007.
The prediction results for the wet year 2009 were slightly better. Overall there were more negative prediction errors for the year 2007. All of the HY shires had negative prediction errors. Similarly, all except the shire of Boyup Brook (0.2) had negative prediction errors. On the good, average and low scale, all of the HY shires had good predictions. The HY shires of of Esperance (17.9%), Gnowangerup (15.7%) both had good predictions with an average prediction for Katanning (20.9%) and weak predictions for Dumbleyung (44.8%), Jerramungup (48.1%), Kent (55.0%), Kulin (65.0%), Lake Grace (73.4%), Ravensthorpe (59.7%) and Wickepin (68.0%). On the other hand the LY shires performed much better with the shires of Boddington (16.2%), Broomehill (4.5%), Cranbrook (7.4%), Tambellup (0.8%), Narrogin (3.4%), Woodanilling (12.9%) and West Arthur (1.2%) had good predictions whilst Boyup Brook
(37.1%), Kojonup (22.9%), Williams(28.1%) and Wagin (24.2%) had average predictions. There were no weak predictions for 2009. Generally, the prediction errors relative to the combined effect of rainfall and temperature were better in 2009 than in 2007.
V. DISCUSSION
In establishing a relationship between stochastic average monthly rainfall, temperature and crop yield, a number of considerations had to be made such as: the multi-faceted nature of the temperature variables; the overall temperature; location specificity; the climatic and geographic resolution; the effect of stochastic and scaled measurements.
Notwithstanding these effects and interactions, a pre-cursory relationship using a simple crop model was used where the classification entity was the rural shire and the average monthly rainfall and temperature variables used as predictors of the wheat crop yield. The results from the two stage analysis showed that there was some correlation between stochastic average monthly climate and wheat yield. Data mining classification algorithms were utilized in order to supplement the simple correlations that were established between rainfall, temperature and crop yield with a facility for prediction. The results showed that the crop yield prediction improved from an average prediction (27.4%) in 2003 to a good prediction (14.7%, 14.9%) in 2005 and 2007, and to a good prediction (13.2%) for 2009 for the overall maximum temperature average decrease of just 0.5 degrees. The trend shown was that the HY shires performed better than the LY shires in 2003, 2005 and 2007 and worse in 2009. Taken together it was apparent that a marginal decrease in temperature at the higher (15-20 degrees) end and middle (10-12 degrees) of the scale resulted in significant improvement in the wheat crop yield. This was in opposition to the low (6-9 degrees) end of the scale where a marginal decrease in temperature resulted in a marginal improvement to the crop yield. Nevertheless, there was a considerable amount of error in the predicted wheat yields which created uncertainty for the outcomes.
VI. CONCLUSION
The wheat yield predictions across the years 2003 (27.4%), 2005 (14.7%), 2007 (14.9%), 2009 (13.2%) were significant in that they showed a gradual improvement. This seems to indicate that the accuracy of the predictions improved as the actual yields dropped. In addition, the LY shires had better crop yields as well as better predictions overall due to the slightly lower temperatures prevalent in them. This amounted to a complex relationship between temperature and the wheat crop yield prediction where the crop yield could be expected to be better at higher temperatures and worse at lower temperatures. However slight drops at the higher end of the temperature scale caused significant improvement to the crop yield, whilst slight drops at the lower end of the scale caused marginal improvement to the crop yield. The use of the data mining classification function GP showed that the correlation between the stochastic average monthly TABLE III: WHEAT YIELD WEKA GP RESULTS ALL FEATURES.
HIGH YIELD YEAR 2007
HIGH RAINFALL YEAR 2009 Rural Shire
HY+ LY
Actual Yield ton/ha
Pred. Yiel
d ton/h
a % Error
Actual Yield ton/ha
Pred. Yield ton/h
a % Error
Dumbleyun
g 2.1 2.19 4.24 1.54 2.23 44.8
1
Esperance 2.23 2.22 0.58 1.89 2.23 17.8
8 Gnowanger
up 2.47 2.21 10.57 1.93 2.23 15.7 Jerramungu
p 2.43 2.19 10.04 1.5 2.22 48.1
3
Katanning 2.72 2.21 18.68 1.85 2.24 20.8
6 Kent 2.39 2.21 7.7 1.44 2.23 55
Kulin 1.59 2.19 37.86 1.35 2.23 64.9
6
Lake Grace 1.57 2.19 39.62 1.28 2.22 73.4
4 Ravensthor
pe 1.73 2.22 28.21 1.39 2.22 59.6
4
Wickepin 1.88 2.21 17.29 1.33 2.23 67.9
7
Boddington 2.2 2.22 1.09 2.67 2.24 16.2
5 Boyup
Brook 4.51 2.28 49.42 3.57 2.25 37.1
1 Broomehill 3.42 2.23 34.91 2.14 2.24 4.49 Cranbrook 3.61 2.24 37.95 2.42 2.24 7.4
Kojonup 3.7 2.25 39.14 2.91 2.25 22.8
5 Narrogin 2.37 2.22 6.5 2.32 2.24 3.41 Tambellup 3.36 2.21 34.26 2.25 2.23 0.76
Wagin 2.88 2.2 23.51 1.8 2.24 24.2
2 West Arthur 3 2.23 25.7 2.27 2.24 1.19
Williams 1.82 2.25 23.52 1.75 2.24 28.0
6 Woodanilli
ng 2.67 2.24 16.14 1.99 2.25 12.9
1
All Shires 2.6 2.21 14.88 1.98 2.24 13.1
temperature and wheat yield was a strongly positive one and that as a result generally, wheat yield in the South West agricultural region can be expected to increase with an increase in temperature associated with a decrease in rainfall, but there could be an increasing under-estimation error in predicting the wheat yields. The uncertainty of the prediction was thought to be related to the influence of other factors as well as to the sparseness related to the intrinsic shire yield measurement of the dataset. Further investigation may be needed in order to investigate the effect of other factors such as soil type respective to the shire area under scrutiny.
ACKNOWLEDGMENT
The author acknowledges Mr. Phil Goulding from DAFWA for his invaluable assistance in data provision and suggestions.
REFERENCES
[1] S. Priya and S. R, “National spatial crop yield simulation using GIS-based crop production model,” Ecological Modelling, vol. 136, pp. 113-129 , 20 January 2001 2001.
[2] M. Trnka, et al., “Projections of uncertainties in climate change scenarios into expected winter wheat yields,” Theoretical and Applied Climatology, vol. 77, pp. 229-249, 2004.
[3] D. A. Atwood, “Aggregate food-supply and famine early warning,” Food Policy, vol. 16, pp. 245–251, 1991.
[4] M. B. Smith and S. Davies, “Famine early warning and response:The missing link,” Intermediate Technology Publications. vol. 320. 1995. [5] H. Eakin, “Seasonal climate forecasting and the relevance of local
knowledge,” Physical Geography, vol. 20, pp. 447–460, 1999.
[6] T. R. Wheeler, et al., “Temperature variability and the annual yield of crops,” Agricultural Ecosystem Environment, vol. 82, pp. 159–167, 2000.
[7] G. R. Batts, et al., “Effects of CO2 and temperature on growth and yield
of crops of winter wheat over four seasons,” European Journal of Agronomy, vol. 7, pp. 43-52, 1997.
[8] R. A. Brown and N. J. Rosenberg, Agric. Forest. Meteor, vol. 83, pp. 171-203, 1997.
[9] A. V. M. Ines and J. W. Hansen “Bias correction of daily GCM rainfall for crop simulation studies,” Agricultural and Forest Meteorology, vol. 138, pp. 44-53, 2006.
[10] M. J. Foulkes, et al., “Raising yield potential of wheat.,” Journal of Experimental Botany, vol. 62, pp. 469-486, 2011.
[11] A. J. Challinor, et al., “Toward a combined seasonal weather and crop productivity forecasting system: Determination of the working spatial scale,” ed, 2003.
[12] J. Piaget, Structuralism. New Yordk: Basic Books, 1970.
[13] O. Bakewell and a. Garbutt, “The use and abuse of the logical framework approach,” International NGO Training and Research Centre 2005.
[14] R. J. Brooks, et al., “Simplifying Sirus: Sensitivity analysis and development of a meta-model for wheat yield prediction,” European Journal of Agronomy, vol. 14, pp. 43–60, 2001.
[15] R. V. Martin, et al., “Seasonal maize forecasting for South Africa and Zimbabwe derived from an agroclimatological model,” Journal of Applicable Meteorology, vol. 39, pp. 1473–1479, 2000.
[16] B. Basso, et al., “Spatial validation of crop models for precision agriculture,” Agric. Syst., vol. 68, pp. 97–112, 2001.
[17] P. Cantelaub and J. M. Terres, “Seasonal weather forecasts for crop yield modelling in Europe,” Tellus A, pp. 476-487, 2004.
[18] M. V. K. Sivakumar, “Climate prediction and agriculture: current status and future challenges,” Climate Research, vol. 33, pp. 3-17, 2006. [19] P. Shah and T. Akhtar, “Varietal improvement of rice under rainfed