Lokesh Kumar Meena
1*, Shoji lal Bairwa
2, Meera Kumari
3and M.K. Wadhwani
4 1Assistant Professor-cum-Junior Scientist, Department of Agricultural Economics, Bihar Agricultural University, Sabour, Bhagalpur,Bihar-813210, India 2Assistant Professor-cum-Junior Scientist, Department of Agricultural Economics, Kalam Agriculture College, Kishangang, Bihar Agricultural University, Sabour, India 3Assistant Professor-cum-Junior Scientist, Department of Agricultural Economics, Bihar Agricultural University, Sabour-813210, India 4Professor-cum- HOD, Department of Agricultural Economics, Bihar Agricultural University, Sabour-813210, India
ABSTRACT
Present study was conducted in Bihar state to measure the performance of onion for this purpose 40 years secondary data were collected and compiled for period from 1974 to 2014. Decade wise as well as whole period analysis was done i.e. 1975-1984, 1985-1994, 1995-2004, 2005-2014 and 1975-2014. Results of the study shows that in the first decade onion gain the area at the compound growth rate of 1.7% per annum. The production of onion registered highest growth rate during this decade that was 2.9 %, despite an increase in productivity was at slow pace. During the second decade performance of the onion in area and production was much better than first decade but onion lost the productivity at the compound growth rate of 0.3% per annum. Onion in the third decade shows very poor performance and onion lost the area and production. Performance of onion was recorded much better and onion gained recorded area, production and productivity with highest growth rate in the fourth decade. Finally during the whole study period best performance of onion was found in production followed by area and productivity. The similar trend was found in the calculated value of the mean, standard deviation, coefficient of variation and compound growth rate during the study period. Keywords: Growth, trends, standard deviation, coefficient of variation and onion.
Address for correspondence
Lokesh Kumar Meena: Assistant Professor-cum- Junior Scientist, Department of Agricultural Economics, Bihar Agricultural University, Sabour-813210, India
E-mail: [email protected] Access this article online
Publisher Website:
http://www.ndpublisher.in
DOI: 10.5958/0976-4666.2016.00038.3
provides livelihood to more than 65 percent of the labour force. Under agriculture sector horticultural crops play very important role to economy (Meena et al. 2013). Due to low operational holdings, it is really not easy by the small farmers to get better their earnings only by raising the yields of the existing crops by using crop specialization, mainly cereals. They should shift on high value crops like vegetable with available modern farm inputs may provide a stable economic base of the poor peasants (De and Chattopadhyay, 2010; Meena Agriculture is the backbone of our country and has
et al. 2016). Vegetables being a rich and cheap source of vitamins and minerals, occupy an important place in the food basket of Indian consumers, a majority of whom are vegetarian by either choice or lack of access. This persistent vegetarianism coupled with rising per capita income is fuelling a rapid growth in consumption of vegetables (Sant Kumar et al. 2004). Onion (Allium cepa L.) is a most important bulbous crop among the cultivated vegetable or horticultural crops and it is of universal importance (Purse glove 1972 and Meena
et al. 2013). India has varying climatic conditions and provides an opportunity for growing a large number of horticulture crops including vegetables. It is regarded as a highly export oriented crop and earns valuable foreign exchange for the country (Kulkarni et al. 2012). Onion is an important vegetable crop grown and consumed widely across the world. As a culinary ingredient it adds to the taste and flavour in a wide range of food preparations and it is also used as a salad. India produces all three varieties of onion – red, yellow and white. In some part of the country, onion is grown in all the three seasons. In the northern part of the country, onion is usually grown in winter (Rabi) season. However, in the southern and western States of Andhra Pradesh, Karnataka, Tamil Nadu, Gujarat and Maharashtra, it is grown in winter (Rabi) as well as in the rainy (kharif) seasons. Thus there is a steady increase in the demand for onion across the world.
China is the leading producer of onion constituting about 27 per cent of the world total production (205.07.76 Lakh tonnes) Gummagolmath (2012). In India it has been grown in 1173.3 thousand hectares with the production of 18777.5 thousand tonnes (2013-14). India being a second major onion producing country in the world has a productivity of 16.0 MT/ha only (Indian Horticulture Database, 2011 and Anonymous, 2012). The reasons for lower productivity of onion in India could be attributed to the limited availability of quality seed and lack of development of hybrids in onion is the major limiting factors among the others (Kulkarni et al. 2012). Although onion is produced in all the States in India, the key onion producing states are Maharashtra, Karnataka, Madhya Pradesh, Rajasthan, Gujarat, Andhra Pradesh and Bihar which together
constitute around 70 percent of the area under onion in the country. During recent years, Rajasthan, Madhya Pradesh and Bihar have emerged as an important onion growing States. On the contrary, Orissa, Uttar Pradesh and Tamil Nadu have lost their proportion in the total area under onion in the country. Maharashtra state covers maximum area and production of onion in India. Bihar state has 5th position in area (10.64 lakh tonnes) while 4th position in both production (1064.17 thousand tonnes) and productivity (19.86 tonnes/hectare) of onion in India (Gummagolmath 2012).
D
ataanDM
ethoDologyPresent study was conducted in Bihar state and based on the secondary data and was collected from various published sources such as institute of social and economic change (ISEC), Bangluru, directorate of economic and statistics (DES) and state horticultural board (SHB) of Bihar. 40 years time series data on area, production and productivity of onion was collected and collected period from 1975 to 2014. Whole set of data was divided in to four decade and analysis was done decade wise as well as whole period i.e. 1975-1984, 1985-1994, 1995-2004, 2005-2014 and 1975-2014. Simple statistics and economic tools average, coefficient of variation, standard deviation and compound growth rate were used for measuring performance of onion.
The analytical economic and statistical tools
Complete behavior of time series cannot be understood by any single statistical tool, therefore following important statistical measures were used to analyse the data.
(a) Arithmetic mean: The mean was worked out by using given formula.
1
x x
n
=
∑
Standard deviation
C.V. = 100
Mean × ×
( )
2 2Y Y / N
S.D. =
N
Σ Σ
Where, Y= area, production and productivity N= Number of observation (years)
(c) Growth rate and trend analysis: The following linear model was fitted to area, and production and productivity.
Régression équation
Y = a ± bx+E Where,
Y = Area/production/productivity, a= Constant or intercept value;
b = Regression coefficient, x = Time period..
E = Error term with mean zero and constant variation
Where regression coefficient (b) was worked out as follows:
byx = 2
2
( x)( y) xy
-n ( x ) x -n
∑ ∑
∑
∑
∑
SE of byx =
2 2 2 2 2 2 ( ) ( ) ( ) ( 2) y x
xy b x
n n x n x n − − − − −
∑
∑
∑
∑
∑
∑
t = b/SE of b
The intercept value (a) was estimated as following formula a = ỹ - bx
The linear growth rates of area, production of onion has been worked out by fitting the linear function. Linear growth rate (%) = b/ ỹ×100
b = Trend value, ỹ = Average of production
The compound growth rate for production of onion was worked out by fitting the following functional from Y = abt or, log Y=loga+t logb or, U=A+Bt
Where,
Y = Area/ Production/Productivity a = Constant or intercept value b = Régression coefficient t = Time variable
U = log Y a = log a B = log b
b = 1+r, with ‘r’ as the compound growth rate a = antilog (A)
b = antilog (B)
Compound growth rate (%) = [Antilog (B)-1]×100 The trend value of b for study period was tested for significance using following formula
t = b/SE of b Where,
b = Trend value of study period, SE of b= Standard error of b
R
esultsanDD
iscussionTable 1: Mean of area, production and production of onion in Bihar
Mean Period Area (‘000
ha) Production (‘000 MT) Productivity (Tonne/ha)
1975-1984 13.52 98.05 7.24
1985-1994 15.23 131.63 8.65
1995-2004 16.98 151.20 8.83
2005-2014 41.90 827.54 17.28
1975-2014 21.91 302.10 10.50
the whole study period mean value of production was increased more as compare to area and productivity. From this we can concluded that farmers of Bihar state were growing more onion from last four decades because its high value and high foreign earning crop. Greater increased in area during fourth decade was mainly due vast increase in area of onion from year 2007 to year 2008. Because of the rise in prices of onion during October, 2005 was mainly due to delayed sowing of kharif onion in major producing States. However, the policy decision to import onion again led to steep fall in the prices of onion. The prices of onion during October and November, 2005 were in the range of ` 1000-1500 in major markets and declined to ` 300-500 during January and February, 2006. Again prices of onion during from 2007 to December, 2010 revealed that, the price touched a high of more than ` 6000 in the case of major market
of India (Gummagolmath 2012). Mean value of area, production and Productivity were found during whole period 21.91(‘000 ha), 302.10 (‘000 MT) and 10.50 (Tonne/ ha) respectively.
Table 2: Standard Deviation of area, production and production of onion in Bihar
Standard Deviation
Period Area Production Productivity
1975-1984 1.12 14.00 0.75
1985-1994 1.60 13.52 0.37
1995-2004 2.95 40.30 1.12
2005-2014 18.44 497.18 6.46
1975-2014 14.63 385.30 5.05
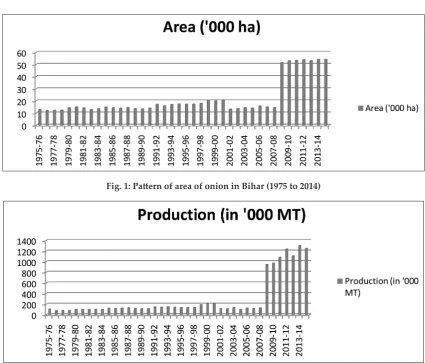
Fig. 1: Pattern of area of onion in Bihar (1975 to 2014)
Above table indicated that standard deviation of area and production and productivity of onion were continually increased from first decade to fourth decade. But value of SD was found more during the fourth decade i.e. 2005-2014. It was due sudden increased in area in the year 2008 (51.6 thousand hectare) just from 2007 (14.6 thousand hectare). It was due to either price of onion was very high in 2007 which added more area in next year 2008 by the state. Standard deviation of area, production and Productivity found during period were 14.63, 385.30 and 5.05 respectively
Table 3: Coefficient of variation of area, production and
production of onion in Bihar
Coefficient of variation
Period Area Production Productivity
1975-1984 8.32 14.28 10.30
1985-1994 10.48 10.27 4.23
1995-2004 17.35 26.65 12.71
2005-2014 44.01 60.08 37.41
1975-2014 66.78 127.54 48.13
Above table indicated that coefficient of variation of area and production and productivity of onion were continuously increased from first decade to fourth decade. Based on the value of the coefficient of variation greater instability was observed in fourth decade followed by third, second and first decade and lowest
instability in area of onion was observed in first decade while lowest instability in production and productivity of onion was found during the second decade. In whole study period coefficient of variation of area, production and productivity of onion were found 66.78, 127.54 and 48.13 respectively. Means higher instability was found in production of onion followed by area and yield of onion.
Table 4: Compound growth rate of area, production and production of onion in Bihar
Compound Growth Rate (%)
Period Area Production Productivity
1975-1984 1.7 2.6 0.9
1985-1994 2.6 2.3 -0.3
1995-2004 -3.5 -2.7 0.8
2005-2014 17.5 34.4 14.4
1975-2014 3.2 5.8 2.5
Table 4 indicated that compound growth rate of area and production and productivity of onion. Growth performance of the onion in Bihar during the last four decade is concluded that during the first decade onion gain the area at the compound growth rate of 1.7% per annum. The production of onion registered highest growth rate during this decade that was 2.9 %, despite an increase in productivity was at slow pace. During the second decade performance of the onion in area and
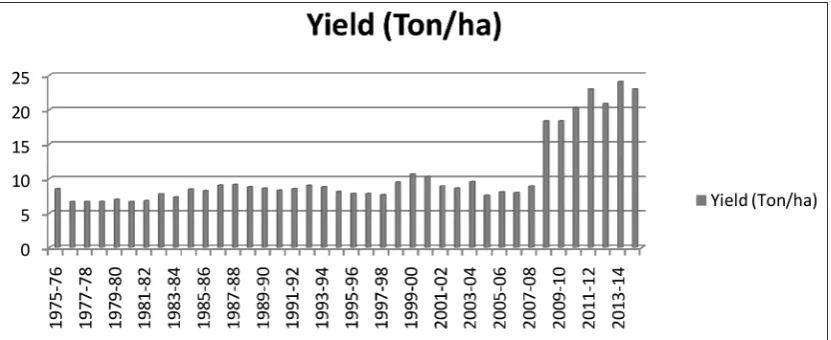
production was much better than first decade but onion lost the productivity at the compound growth rate of 0.3% per annum. During the third decade performance of onion was very poor and onion lost the area and production with compound growth rate 3.5 % and 2.7 % per annum due to the area of onion in 2001 was reduced as compare to 2000 it was due to price reached at recorded level (` 26.32/ kg) in 1998 and after 1999 to 2000 it started decline due market interventions involve in stabilization of price through procurement of onion when/ where the price were low and distribution to consumer at reasonable price when the ruling retail market price were high and due to low price of onion in 2000 the area of onion in 2001 was reduced as compare to 2000. During the fourth decade performance of onion was recorded much better and onion gained area, production and productivity at a compound growth rate 17.5%, 34.4% and 14.4% per annum during the study period. It was due to increased in area in the year 2008 (51.6 thousand hectare) just from 2007 (14.6 thousand hectare) because of the rise in prices of onion during the year 2006 and 2007 was mainly due to delayed sowing of kharif onion in major producing States. Finally onion gains the area and production and productivity at a compound growth rate 3.2%, 5.8% and 2.5% per annum. The similar trend was found in the calculated value of the mean, standard deviation, coefficient of variation and compound growth rate during the study period
c
onclusionGrowth performance of the onion in Bihar during the last four decade is concluded that during the first decade onion gain the area at the compound growth rate of 1.7% per annum. The production of onion registered highest growth rate during this decade that was 2.9 %, despite an increase in productivity was at slow pace. During the second decade performance of the onion in area and production was much better than first decade but onion lost the productivity at the compound growth rate of 0.3% per annum. Onion in the third decade
shows very poor performance and onion lost the area and production. During the fourth decade performance of onion was recorded much better and onion gained recorded area, production and productivity with highest growth rate. It was due to increased in area in the year 2008 because of the rise in prices of onion during the year 2006 and 2007 was mainly due to delayed sowing of kharif onion in major producing States. Finally during the whole study period best performance of onion was found in production followed by area and productivity. The similar trend was found in the calculated value of the mean, standard deviation, coefficient of variation and compound growth rate during the study period.
R
efeRencesAnonymous 2012 “A Report on Competitive Assessment of Onion Markets in India” Competition Commission of India
De, U.K. and Chattopadhyay, M. 2010. Crop diversification by poor peasants and role of infrastructure: Evidence from West Bengal. Journal of Development and Agricultural Economics2(10): 340-350.
Gummagolmath, K.C. 2012. Report on Trends in Marketing and Export of Onion in India Prepared by NIAM
Kulkarni, B.S., Patil, S.M. and Ramchandra, V.A. 2012. Growth trends in area, production and export of onion from India -An economic analysis. International Journal Commerce and Business Management5(2): 159-163.
Kumar, S., Pal, S. and Joshi, P.K. 2004. Vegetable Sector in India: An Overview. National Centre for Agricultural Economics and Policy Research, p. 23.
Meena, L.K., Bairwa, S.L., Lakra, K. and Sirohiya, L. 2014. Analysis of the profile on participating and non-participating farmers in chickpea production technology. Agriculture Update9(1): 31-36. Meena, L.K., Sen, C. and Bairwa, S.L., Jhajharia and Raghuwanshi,
N.K. 2013. Economics of Garlic Production in Baran District of Rajasthan; Break Even Analysis, Asian Journal of Agriculture and Rural Development3(10): 697-701.
Meena, L.K., Sen, C. and Kushwaha, S. 2016. Implications of The Methods of Crop Diversification: A comparative study,
International journal of environment, ecology, family and urban
studies (IJEEFUS)6(1): 95-102.