2nd International Conference on Current Research Trends in Engineering and Technology © 2018 IJSRSET | Volume 4 | Issue 5 | Print ISSN: 2395-1990 | Online ISSN : 2394-4099 Themed Section: Engineering and Technology
Dengue Fever Classification Based on Grey Level Co-occurrence
Matrix Feature
Ragini Deshmukh
1, Dr. Sheshang Degadwala
2, Arpana Mahajan
3 1ME Student Computer Department, Sigma Institute of Engineering, Vadodara, Gujarat, India 2Head of Department Computer Department, Sigma Institute of Engineering, Vadodara, Gujarat, India3Assistant Professor Computer Department, Sigma Institute of Engineering, Vadodara, Gujarat, India
ABSTRACT
White blood cells have attracted tremendous interest in recent times due to their promise in providing innovative new treatments for a great range of currently debilitating diseases. This is due to their potential ability to regenerate and repair damaged tissue, and hence restore lost body function, in a manner beyond the body’s usual healing process. White blood cells have potential to divide themselves (through mitosis) to produce more White Blood Cells. Any disease that results in cellular and tissue destruction can potentially be treated by WBC cells. Detection of WBC cells has become an important part in modern medicine to diagnose any disease at its prior onset. But due to their characteristics to change their shape, size and colour at different intervals of time it becomes quite difficult to detect and segment them, as this research is going on to detect WBC cells by using the most efficient algorithm among all that have been studied in the literature survey. Keywords: K-means, CMYK-LAB Model, Gray level Co-occurrence Matrix (GLCM), Support Vector Machine (SVM) and Artificial Neural Network (ANN).
I.
INTRODUCTIONWhite Blood Cells play a crucial role in medical therapy due to their ability to renew themselves through cell division and to differentiate into a wide range of specialized cell types. White Blood Cells motility is a useful index to evaluate the viability of the White Blood Cells. Recently, the most widely used method to observe White Blood Cell activity qualitatively is visual inspection through a microscope.
However manually performing quantitative assessments of cell behavior is time consuming and prone to human error. A computer aided analysis tool is thus required for an effective analysis of White Blood Cells.
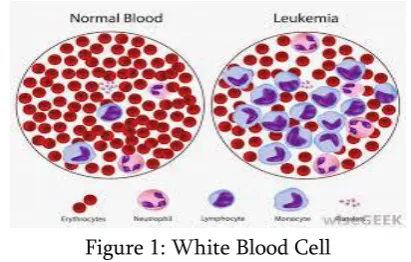
Moreover detection and segmentation of White Blood Cells is difficult as White Blood Cells have special characteristics to change their shape size and color at different intervals of time.
Figure 1: White Blood Cell
specialized cell. It needs brought traditional prescription under another defining moment what’s more consequently turned paramount previously, advanced medication. Despite these properties White Blood Cells have a unique characteristic of changing their shape, size and colour with subject to micro environment. Hence the detection of White Blood Cells among different cells of the body becomes quite difficult. If they are easily detected it becomes easier to identify any disease at its prior onset.
II.
METHODS AND MATERIALFigure 2: Proposed Block Diagram The block diagram consists of the following steps:
Pre-processing
Cell Segmentation
Feature Extraction
Classification
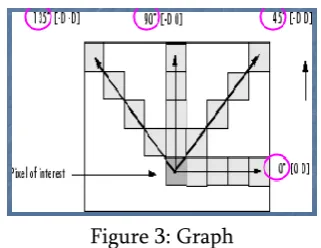
The block diagram for proposed work is shown in the figure. In the block diagram the input dataset is an RGB image which will be initialized to calculate the dimensions of the image. Then image registration will be performed to resize the image dimensions if it does not match the dimensions of the trained data image. After the image registration, Gray level co-occurrence matrix (GLCM) will be computed. The Haarlick features are used to extract textural features for image classification. These features capture information about the patterns that emerge in texture of an image. The features are calculated by construction of a Gray Level Co-occurrence Matrix (GLCM).The GLCM calculates how often a pixel with gray-level (gray scale intensity) value i occurs either horizontally, vertically, or diagonally to adjacent pixels with the value j.
GLCM direction of analysis:
Horizontal (0°)
Vertical (90°)
Diagonal :
Bottom left to top right (-45°)
Top left to bottom right (-135°)
Denoted as P₀, P₄₅, P₉₀& P₁₃₅ respectively.
Ex : P₀( i,j ) where i and j are gray level values (tones) in the image.
Example of Directional Analysis P₀, P₄₅, P₉₀& P₁₃₅.
Figure 3: Graph
A. Hybrid Cluster and Colour based Segmentation: Step 1: Read WBC Image.
Step 2: Apply Histogram Equalization to Enhance Image.
Step 3: Extract CMYK and LAB Colour Model.
Step 4: Use 7x7 median Filter on M channel to highlight the cells.
Step 5: Use 7x7 median Filter on B channel to highlight the cells.
Step 6: Subtract B channel from M channel. Step 7: Initiate Cluster value and apply K-means. Step 8: Finding the Centre of the Clusters.
Step 9: Apply binary mapping to highlight WBC cell Step 10: Apply Erosion to remove Unwanted Segmented region.
Step 11: Apply Dilation to elaborate the segmented region.
Step 12: Get the Segmented Results.
After the segmentation of the image vector computation of the Haarlick features are calculated. And the output is given to the SVM classifier. The SVM classifier classifies trained and tested data according to the image.
A classifier takes a model in calculations that examines information and also distinguishes designs which takes a chance to be utilized for arrangement. Machine taking in methodology depends on the acclaimed ml calculations on unravel. Likewise a general quick order issues that makes utilization of syntactic or semantic features.
Quick order Definition: we have a set for preparation records d = {X1, X2,...,Xn} the place every record is marked will An population. The order model will be identified with those offers in the underlying record on a standout amongst those population labels. Then for a provided for example about obscure class, the model may be used to foresee a class mark for it. i) Classifiers Support Vector Machines (SVM)
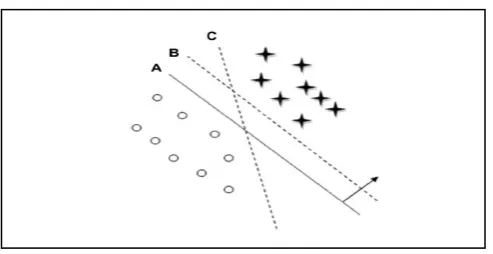
The primary standard of SVM may be on determining straight separators in the scan space which might best separate the different classes. Over figure 3. 2 there would 2 classes x, o and there would 3 Hyperplanes A, b Furthermore c's. Hyperplane An gives those best division between those classes, on those ordinary separation about whatever of the information focuses will be the largest, thereabouts it speaks to the most extreme edge for detachment.
Figure 4: Classification SVM
SVM is a supervised learning algorithm, meaning it infers its function from labelled training data. In our proposed method SVM is trained for 50 images of cancerous stem cell and 50 non-cancerous stem cells. The SVM classifier is fed with features values and the support vectors produced from the training process. The given data is trained and tested for 200 sample images and the classifier is fed with two classes i.e. positive for cancerous results and negative for non-cancerous results.
ii) Artificial Neural Network (ANN)
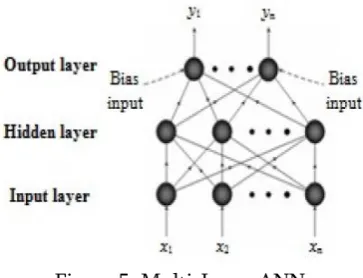
Over machine learning in and psychological science, mimicked neural frameworks (ANN) are a team about models pushed eventually neural systems are used to survey or evaluate limits that may depend on upon a broad sum for information sources. Reproduced neural systems require help all things considered displayed as structures for interconnectedness "neurons" which exchange messages between each other. The affiliations require numeric weights that ought an opportunity to be tuned in perspective of experience, making neural nets adaptable to inputs besides gifted for taking in. Those Multilayer Perceptron neural framework is an empowered forward neural framework with one then again a more noteworthy sum covered layers.
Simulated neural networks need aid by and large exhibited as frameworks for interconnectedness “neurons” which trade messages between one another. The associations need numeric weights that could a chance to be tuned In view of experience, making neural nets versatile should inputs furthermore skilled for taking in.
Figure 5: Multi-Layer ANN
III. RESULTS AND DISCUSSION
The experimental result shows the results of the segmented cell after the extraction of the GLCM’s textural features. And the classification is shown both by SVM and ANN classifier. The given figure through GUI shows, classification of the segmented image after the Haarlick’s feature extraction, which is positive means it is cancerous cell. The classification is done by the training and testing by ANN classifier.
Figure 6: GUI Main
The above figure shows the segmented White Blood Cell through k-means clustering from the blood sample image and the Haarlick features extracted for that segmented cell. A classify button is provided which shows the whether the segmented cell is cancerous or not.
Figure 7: SVM Results
The results show that the accuracy of the SVM classifier after the computation of the Haarlick’s features is 92.41%.
The above figure shows the segmented cell after k-means clustering segmentation and thereafter, ANN classifier is used for classification. The results show that the image is positive i.e. the detected cell is cancerous.
The results show that the accuracy of the ANN classifier after the computation of the Haarlick’s features is 96.50%.
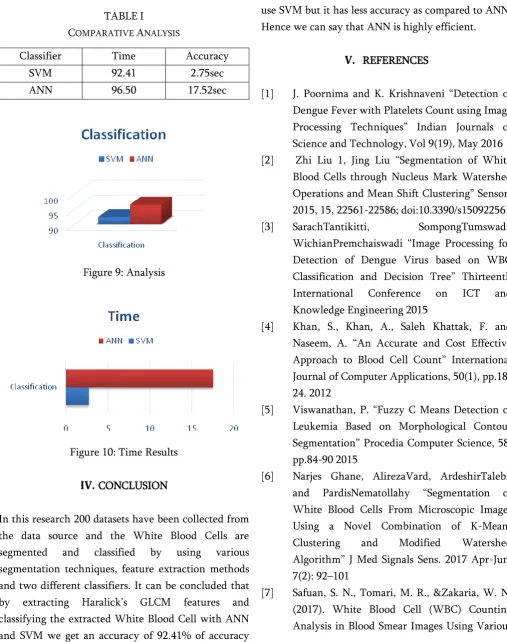
TABLEI
COMPARATIVE ANALYSIS
Classifier Time Accuracy
SVM 92.41 2.75sec
ANN 96.50 17.52sec
Figure 9: Analysis
Figure 10: Time Results
IV. CONCLUSION
In this research 200 datasets have been collected from the data source and the White Blood Cells are segmented and classified by using various segmentation techniques, feature extraction methods and two different classifiers. It can be concluded that by extracting Haralick’s GLCM features and classifying the extracted White Blood Cell with ANN and SVM we get an accuracy of 92.41% of accuracy
with SVM classifier. Moreover if we extract all the 13 Haralick’s Features and classify the cell with SVM and ANN we get better results by ANN i.e. 96.5%. The time consumption for computation is very less if we use SVM but it has less accuracy as compared to ANN. Hence we can say that ANN is highly efficient.
V.
REFERENCES[1] J. Poornima and K. Krishnaveni “Detection of Dengue Fever with Platelets Count using Image Processing Techniques” Indian Journals of Science and Technology, Vol 9(19), May 2016 [2] Zhi Liu 1, Jing Liu “Segmentation of White
Blood Cells through Nucleus Mark Watershed Operations and Mean Shift Clustering” Sensors 2015, 15, 22561-22586; doi:10.3390/s150922561
[3] SarachTantikitti, SompongTumswadi,
WichianPremchaiswadi “Image Processing for Detection of Dengue Virus based on WBC Classification and Decision Tree” Thirteenth International Conference on ICT and Knowledge Engineering 2015
[4] Khan, S., Khan, A., Saleh Khattak, F. and Naseem, A. “An Accurate and Cost Effective Approach to Blood Cell Count” International Journal of Computer Applications, 50(1), pp.18-24. 2012
[5] Viswanathan, P. “Fuzzy C Means Detection of Leukemia Based on Morphological Contour Segmentation” Procedia Computer Science, 58, pp.84-90 2015
[6] Narjes Ghane, AlirezaVard, ArdeshirTalebi, and PardisNematollahy “Segmentation of White Blood Cells From Microscopic Images Using a Novel Combination of K-Means
Clustering and Modified Watershed
Algorithm” J Med Signals Sens. 2017 Apr-Jun; 7(2): 92–101
Color Segmentation Methods. Measurement. doi:10.1016/j.measurement.2017.11.002
[8] Ogado, L. H., Veras, R. D., Andrade, A. R., Silva, R. R., Araujo, F. H., & Medeiros, F. N. (2016). Unsupervised Leukemia Cells Segmentation Based on Multi-space Color Channels. 2016 IEEE International Symposium
on Multimedia (ISM).
doi:10.1109/ism.2016.0103
[9] Robert M. Haralick, K. Shanmugam, And Its'hakDinstein ”Textural Features for Image Classification” IEEE transactions on systems, man, and cybernetics, \o smc(-3, no. 6, November 1973
[10] Gautam, A., &Bhadauria, H.”White blood nucleus extraction using K-Mean clustering and mathematical morphing” 5th International Conference - Confluence The Next Generation Information Technology Summit (Confluence). doi:10.1109/confluence.2014.694922
[11] Savkare, S. S., &Narote, S. P. ”Blood cell segmentation from microscopic blood
images”International Conference on
Information Processing (ICIP).
doi:10.1109/infop.2015.7489435