Available online on 15.07.2019 at http://jddtonline.info
Journal of Drug Delivery and Therapeutics
Open Access to Pharmaceutical and Medical Research
© 2011-18, publisher and licensee JDDT, This is an Open Access article which permits unrestricted non-commercial use, provided the original work is properly cited
Open Access
Research Article
Method Development and Validation for Simultaneous Estimation of
L-Glutathione and Vitamin-C in Effervescent Tablet by RP-HPLC
Alhat Babita R.
1*, Kokate Shekhar V.
21 VJSM’S Institute of Pharmacy for Women, A/P: Ale, Tal. : Junnar, Dist.: Pune, Maharashtra, India 2 VJSM’S Institute of Pharmacy, A/P: Ale, Tal. : Junnar, Dist.: Pune,, Maharashtra India
ABSTRACT
A simple, linear, precise, accurate and sensitive RP-HPLC method has been developed and validated for estimation of L-Glutathione and Vitamin-C in effervescent tablet. Isocratic elution at a flow rate of 1 ml/min tried on C18 column (ODS) 250 mm × 4.6 mm, 5µM on usin g a mobile phase consisting mixture of Acetonitrile:Methanol (6:4 v/v). The retention time of L-Glutathione was 7.208 minutes and Vitamin-C 3.825 minutes. The eluent was detected at 255 nm. Linearity was observed in the concentration range of 30-70μg/ml for L-Glutathione and 80120μg/ml for VitaminC. The method is validated as per ICH guidelines. The proposed method can be successfully applied for estimation of L -Glutathione and Vitamin-C in effervescent tablet.
Keywords: L-Glutathione, Vitamin-C, RP-HPLC Method, Mobile phase, validation.
Article Info:Received 17 May 2019; Review Completed 24 June 2019; Accepted 30 June 2019; Available online 15 July 2019
Cite this article as:
Alhat BR, Kokate SV, Method Development and Validation for Simultaneous Estimation of L-Glutathione and Vitamin-C in Effervescent Tablet by RP-HPLC, Journal of Drug Delivery and Therapeutics. 2019; 9(4):348-353
http://dx.doi.org/10.22270/jddt.v9i4.3058
*Address for Correspondence:
Ms. Babita R. Alhat, VJSM’S Institute of Pharmacy for Women, A/P: Ale, Tal. : Junnar, Dist.: Pune, Maharashtra, India
INTRODUCTION
[1]Glutathione: Glutathione (GSH) is an important antioxidant
in plants, animals, fungi and some bacteria. Preventing damage to important cellular components caused by reactive oxygen species such as free radicals and peroxides. It is a tripeptide with a gamma peptide linkage between the carboxyl group of the glutamateside-chain and the amine group of cysteine (which is attached by normal peptide linkage to a glycine). Chemically it is (2S)-2-Amino-4-{[(1R)-
1-[(carboxymethyl)carbamoyl]-2-sulfanylethyl]carbamoyl}butanoic acid. It is the most abundant thiol of low molecular weight (307.3 g/mol) found
in animal cells[2]. Glutathione acts on the melanin maturation
pathway, reducing melanin maturation & controlling skin darkening effect.
Fig.1: Structure of L-Glutathione
Vitamin-C:[3,4,5,6,7]
Vitamin-C, also known as ascorbic acid and L-ascorbic acid. It is a vitamin found in food and used as a dietary supplement .As a supplement it is used to treat and prevent scurvy. Vitamin C is an essential nutrient involved in the repair of tissue. Foods that contain vitamin C include citrus fruit, tomatoes, red peppers, and potatoes.
Fig.2: Structure of L-Glutathion
Few analytical methods such as UV-visible spectroscopy, Potentiometry, HPLC are available for estimation of
L-Glutathione and Vitamin-Cin API and Dosage forms [8-14] but
simple, reliable and economic RP-HPLC method for routine analysis of L-Glutathione and Vitamin-C
MATERIAL AND METHOD
Instruments and analytical condition:
The HPLC analysis is carried out on Shimadzu lc-2010HTHPLC system equipped with UV-visible detector with Auto sampler running on HPLC Workstationsoftware. The column used is C18,(ODS) 250 × 4.6 mm, 5μm and detection was performed at 255 nm. The injection volume was 20μL and run time was 10 minutes. The mobile phase was used Acetonitrile and methanol in the ratio of 6:4 (v/v) with flow rate of 1 ml/min. The mobile phase was filter with 0.45μm membrane filter and degassed before use.
Chemicals and Solvents:
L-Glutathione and Vitamin-C(AR grade) is obtained as gift sample from SciTech laboratory Musalgaon MIDC, Sinnar, Nashik. HPLC Grade solvents Acetonitrile, Methanol (Merck) are used for study.
Selection of mobile phase:
After various trial ideal mobile phase selected is combination of Acetonitrile and Methanol in the ratio of 6: 4 (v/v).
Preparation of Standard solution:
a) Weigh accurately 25 mg of Glutathione in a 50 ml
volumetric flask, add sufficient mobile phase Acetonitrile: Methanol (6:4v/v) to dissolve it and sonicate for 3 minutes. Further diluent 2 ml to 20 ml with mobile phase Acetonitrile: Methanol (6:4v/v).
b) Weigh accurately 25 mg of Vitamin C in a 50 ml
volumetric flask, add sufficient mobile phase Acetonitrile: Methanol (6:4v/v) to dissolve it and sonicate for 3 minutes. Further diluent 2 ml to 20 ml with mobile phase (Acetonitrile: Methanol (6:4v/v). Preparation of Sample solution:
a) Crush 20 tablet finely. Weigh accurately sample
equivalent to 500 mg of Glutathione in 100 ml volumetric flask, add 50 ml mobile phase Acetonitrile: Methanol (6:4v/v) to dissolve the sample completely. Sonicate for 10 minutes. Further make up the sample with mobile phase Acetonitrile: Methanol (6:4v/v). Sonicate for 2 minutes. Stirr the sample on magnetic stirrer for 5 minutes. Filter the sample with whatman no.20 and collect the filtrate. Discard first few ml of the filtrate. Further diluent 1 ml to 100 ml with mobile phase Acetonitrile: Methanol (6:4v/v). Sonicate for 2 minutes and directly inject to the HPLC.
b) Crush 20 tablet finely. Weigh accurately sample
equivalent to 1050 mg of Vitamin C in 100 ml volumetric flask, add 50 ml mobile phase Acetonitrile: Methanol (6:4v/v) to dissolve the sample completely. Sonicate for 10 minutes. Further make up the sample with mobile phase Acetonitrile: Methanol (6:4v/v). Sonicate for 2 minutes. Stirr the sample on magnetic stirrer for 5 minutes. Filter the sample with whatman no.20 and collect the filtrate. Discard first few ml of the filtrate. Further diluent 1 ml to 100 ml with mobile phase Acetonitrile: Methanol (6:4v/v). Sonicate for 2 minutes and directly inject to the HPLC.
Method Validation [15-17]
Objective of method validation is demonstrating that the
ICH guidelines. The method was validated in terms of linearity, range, precision, accuracy, limit of detection (LOD) and limit of quantitaion (LOQ), robustness.
Linearity and Range
Five different concentrations (30, 40, 50, 60 and 70μg/ml) of L-Glutathione and five different concentrations (80, 90, 100, 110 and 120μg/ml) of Vitamin-C were prepared for linearity studies. The responses were measured as peak area. The calibration curves obtained by plotting peak area against concentration showed linearity in the concentration range of 30-70ppm of L-Glutathione and 80-120ppm of Vitamin-C.
Table No.1 Linearity Result of L-Glutathione Sr.
No. Glutathione Conc.
L-(µg/ml)
Peak area
1 30 929936
2 40 938276
3 50 946607
4 60 954891
5 70 961604
Fig.3: Calibration curve of L-Glutathione Table No.2 Linearity Result of Vitamin C
Sr. No. Conc. Vitamin C (µg/ml) Peak area
1 80 1756422
2 90 1832458
3 100 1918149
4 110 2011621
5 120 2106212
Fig.4: Calibration curve of Vitamin C
y = 0.001249x +1131.61 R² = 0.99917
925000 930000 935000 940000 945000 950000 955000 960000 965000
0 20 40 60 80
Ar ea concentration Series1 Linear (Series1) 1700000 1750000 1800000 1850000 1900000 1950000 2000000 2050000 2100000 2150000
0 50 100 150
Precision
Precision of the method was established by measurements of QC standards (50 µg/ml Glutathione and 100 µg/ml Vitamin C) selected at Five Sample across the calibration range.
The results were recorded for area, retention time, theoretical plates, and found to be in agreement with each
other. The area for each QC standard was statistically evaluated for standard deviation and percent RSD.The percent RSD obtained was in conventionality with the ICH principle. As a consequence, it was accomplished that the method was precise for the specified range Result is given in table no 3 and 4respectively.
Table No.3 Precision results of L-Glutathione
Sr. No. Sample No Concentration Area Assay % assay
1 SPL 1 100 1912349 99.34 99.34
2 SPL 2 100 1911945 99.323 99.32
3 SPL 3 100 1911265 99.288 99.28
4 SPL 4 100 1912226 99.338 99.33
5 SPL 5 100 1913456 99.402 99.40
AVG 99.334
STDEV 0.043359
%RSD 0.0411258
Table No.4 Precision Results of Vitamin C
Sr. No. Sample No Concentration Area Assay % assay
1 SPL 1 50 946590 50.01 100.03
2 SPL 2 50 946662 50.04 100.042
3 SPL 3 50 946596 50.017 100.035
4 SPL 4 50 946542 50.015 100.03
5 SPL 5 50 946649 50.020 100.041
AVG 100.035
STDEV 0.05771
% RSD 0.042565
LIMIT-% RSD should NLT 2.0 %
Accuracy
Accuracy of analytical procedure should be established across the specified range of analyte. The accuracy was determined by using data obtained from precision study and determined from the calibration curve.
Accuracy determination of Glutathione & Vitamin-C, respectively prepared a three level sample i.e. 80, 100, 120
of Glutathione and Vitamin-C, and concentration of level sample Glutathione is 40µg/ml, 50µg/ml, 60µg/ml and 80µg/ml, 100µg/ml, 120µg/ml of Vitamin-C and find out the concentration and % Recovery. From the results obtained it was established that the method was accurate at three levels of QC standards across range and it passed for the test of accuracy as per ICH guideline Q2R1. The Result is within limit as shown in table no. 5 and 6 respectively.
Table No.5 Recovery Results of L-Glutathione
Sr. No. Recovery Level Amount
added Area Recovered Amount % Recovery
1 80 40 749052 39.56 98.9
2 100 50 945623 49.94 99.88
3 120 60 1145654 60.51 100.85
Table No.6 Recovery Results of Vitamin C
Sr. No. Recovery Level Amount added Area Amount
Recovered % Recovery
1 80 80 1525624 79.78 99.23
2 100 100 1956472 101.331 101.33
LOD and LOQ:
The lowest concentration which can be detected by HPLC and LOQ is the lowest concentration which can be quantified with precision and accuracy both of these can be determined
by regression line[18]. The result is given in table no.7 and 8
respectively.
Table No.7 LOD and LOQ Result of L-Glutathione
Sr. No Concentration Area
1 0 0
2 30 929936
3 40 938276
4 50 946607
5 60 954891
6 70 961604
AVG 41.66 946262.8
CO-REL 0.99917
LOD 9.2701
LOQ 28
Table No.8 LOD and LOQ Result of Vitamin C
Sr. No Concentration Area
1 0 0
2 80 1756422
3 90 1832458
4 100 1918149
5 110 2011621
6 120 2106212
AVG 83.33 1924972.4
CO-REL 0.99902
LOD 5.24
LOQ 15.89
Robustness:
Robustness is a reliability of analysis with respect to intentional change in method parameter. Robustness testing is done by slight change in mobile phase composition and varying flow rate. The method is found robust.The result for robustness is shown in table 9,10,11 and 12 respectively.
Table No.9 Results of robustness study for mobile phase ratio variation of L-Glutathione
Sr. No. Mobile phase
ratio (μg/ml) Conc. RT Area % Assay (98-102%) Limit
1 60:40(Std) 50 7.208 946590 99.99 Passed
2 62:38(High) 50 7.217 946542 99.993 Passed
3 58:42(Low) 50 7.233 946596 99.999 Passed
TableNo.10Results of robustness study for mobile phase ratio variation of Vitamin C
Sr. No. Mobile phase
ratio (μg/ml) Conc. RT Area % Assay (98-102%) Limit
1 60:40(Std) 100 3.825 1912226 99.99 Passed
2 62:38(High) 100 3.815 1911265 99.94 Passed
3 58:42(Low) 100 3.833 1913456 100.06 Passed
Table No. 11 Robustness flow rate changes in L-Glutathione
Sr. No Flow Rate (ml/min) Concentration R.T. Area % assay
1 1.0 (STD) 50μg/ml 7.208 946649 100.004
2 1.1 (High) 50μg/ml 7.217 946596 99.99
3 0.9 (Low) 50μg/ml 7.233 946662 100.06
Table No.12 Robustness flow rate changes in Vitamin C
Sr. No Flow Rate (ml/min) Concentration RT Area % assay
1 1.0 (STD) 100μg/ml 3.825 1912226 99.999
2 1.1 (High) 100μg/ml 3.815 1911265 99.94
3 0.9 (Low) 100μg/ml 3.833 1913456 100.06
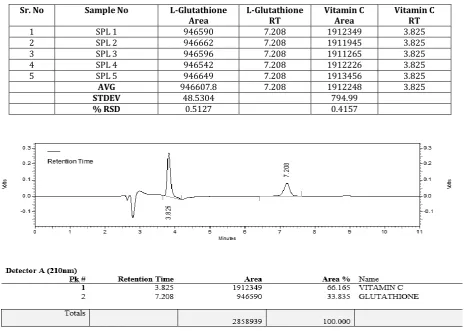
System Suitability Testing:
System suitability is defined as examination of system previous to or during analysis to ensure system concert. For the determination of reproducibility and better resolution system suitability test was performed. System suitability test
Table No.13: Results of System Suitability Testing
Sr. No Sample No L-Glutathione
Area L-Glutathione RT Vitamin C Area Vitamin C RT
1 SPL 1 946590 7.208 1912349 3.825
2 SPL 2 946662 7.208 1911945 3.825
3 SPL 3 946596 7.208 1911265 3.825
4 SPL 4 946542 7.208 1912226 3.825
5 SPL 5 946649 7.208 1913456 3.825
AVG 946607.8 7.208 1912248 3.825
STDEV 48.5304 794.99
% RSD 0.5127 0.4157
Fig.5: Chromatogram of System Suitability Replicate 1 of L-Glutathione and Vitamin-C
Chromatographic Conditions:
The following optimized parameters were used as a final method for the estimation of L-Glutathione and Vitamin-C in effervescent tablet.
TableNo.14 Chromatographic Conditions
Column : C18,(ODS) 250 mm × 4.6 mm ,5 µM
Flow Rate 1 ml/min
Wavelength 255 nm
Injection volume 20μl
Temperature 30oC
Run Time 10 minutes
Mobile Phase Acetonitrile : Methanol (6:4 v/v)
RESULT AND DISCUSSION
Several mobile phase compositions were tried to enhance the peaks of Glutathione and Vitamin C. The optimum mobile phase containing Acetonitrile:Methanol (6:4v/v) was selected because it gives sharp peak. A linearity study show good linear co relation exists between conc. and absorbance between concentration range 30-70ug/ml of Glutathione and Vitamin C 80-120ug/ml The limit of detection (LOD) and limit of quantitaion (LOQ) were found to be 9.2701ug/ml and 28ug/ml of Glutathione and 5.24ug/ml and15.89ug/ml of Vitamin C respectively.The values indicate that the method is sensitive. The precision (%RSD) was found to be below 1%. Also accuracy study is carried out .The lower values of % RSD indicate that the method is precise and accurate. Analysis of marketed tablets was carried out using optimized mobile phase.
Table No.15 Summary of Results of Validation Parameters
Parameters L Results
Glutathione Vitamin C
Linearity Range (μg/ml) 30-70μg/ml 80-120μg/ml
Correlation coefficient 0.99917 0.99902
Precision(% RSD) 0.0411 0.0425
Accuracy 99.87% 100.52%
LOD 9.2701μg/ml 5.24μg/ml
LOQ 28μg/ml 15.89μg/ml
Robustness Robust Robust
CONCLUSION
The method has short analysis time. Based on the results obtained, it can be concluded that the proposed RP-HPLC method for the simultaneous estimation of Glutathione and Vitamin C in Effervescent tablet is simple, linear, sensitive, precise, accurate and reproducible. The method was developed and validated in accordance with regulatory guidelines. The utility of the developed methods have been demonstrated by analysis of marketed tablet formulation. Hence this method can be conveniently adopted for routine analysis of Glutathione and Vitamin C in Effervescent tablet.
REFERENCES
1. https://en.wikipedia.org/wiki/Glutathione.
2. Wu G., Fang Y., Yang S., Lupton J.R., Turner N.D.. Glutathione mwtabolism & its implications for health, Journal of Nutrition, 2004, Vol.134 (pg.489-492)
3. "Ascorbic Acid". The American Society of Health-System Pharmacists. Retrieved 8 December 2016.
4. "Fact Sheet for Health Professionals - Vitamin C". Office of Dietary Supplements, US National Institutes of Health. 11 February 2016.
5. WHO Model Formulary 2008 (PDF) World Health Organization. 2009. p. 496. ISBN 9789241547659. Retrieved 8 December 2016.
6. "Ascorbic acid Use During Pregnancy, Drugs.com". www.drugs.com. Retrieved 30 December 2016.
7. https://en.wikipedia.org/wiki/Vitamin C.
8. Kartinasari W.F., Palupi T., Indrayanto G., Journal of Liquid Chromatography & Related Technologies, 2007, 27(4): 737-7. 9. Khanvilkar V., Tambe A., Dalvi V., Parmar D., Kadam V., Indo
American Journal of Pharmaceutical Research, 2013,45(1): 5196-9.
10. Donda S.T., Baviskar V.B., Bari S.B., Deshmukh P.K., Deore D.S., Girase N.M., Khan Z.G., Patil P.O., J. Chil. Chem. Soc., 2016, 61(2):56-8
11. Sinha M., Verma V., Journal of Drug Delivery & Therapeutics. 2014, 4(1):63-2.
12. Karunakaran K, Navaneethin G, Elango K P, Trop J Pharm Res, February, 2012, 11(1): 99-7.
13. Gan S.H., Ismail R., Wan Adman W.A., Wan Z. Journal of Chromatography B, 2002, 772(1):23–7.
14. Chandra P, Rathore A. S., Lohidasan S., Mahadik K. R., Sci Pharm., 2012, 80, 337-14.
15. Snyder L R., Joseph Kirkland J., Joseph Glajch L., Practical HPLC Method Development. 2nd Edition, John Wiley and Sons, INC, Canada, 1997, pp. 2-9.
16. International Conference on Harmonization, Draft Guideline on Validation of Analytical Procedures: Definitions and Terminology, Federal Register, 60, 1995, 11260, 1996(1-8). 17. Center for Drug Evaluation and Research, Food and Drug
Administration, Reviewer Guidance, Validation of Chromatographic Methods. 1994.