http://www.sciencepublishinggroup.com/j/ajce doi: 10.11648/j.ajce.20170506.20
ISSN: 2330-8729 (Print); ISSN: 2330-8737 (Online)
Morphometric Analysis of Asa and Oyun River Basins,
North Central Nigeria Using Geographical Information
System
Mudashiru Rofiat Bunmi, Olawuyi Maryam Yusuf, Amototo Ismail Oladapo,
Oyelakin Mutiu Adekunle
Department of Civil Engineering, Federal Polytechnic Offa, Offa, Nigeria
Email address:
[email protected] (M. R. Bunmi) *Corresponding author
To cite this article:
Mudashiru Rofiat Bunmi, Olawuyi Maryam Yusuf, Amototo Ismail Oladapo, Oyelakin Mutiu Adekunle. Morphometric Analysis of Asa and Oyun River Basins, North Central Nigeria Using Geographical Information System. American Journal of Civil Engineering.
Vol. 5, No. 6, 2017, pp. 379-393. doi: 10.11648/j.ajce.20170506.20
Received: October 23, 2017; Accepted: November 8, 2017; Published: December 14, 2017
Abstract:
Geographical Information System (GIS) and image processing techniques can be used for the identification of morphological features and analyzing properties of basin. The morphometric parameters of basin include the linear, aerial and relief aspects. The present study focused on the evaluation and analysis of the morphometric parameters such as Stream Order (Nu), Stream Length (Lu), Bifurcation Ratio (Rb), Drainage Density (Dd), Stream Frequency (Fs), Texture Ratio (T), ElongationRatio (Re), Circulatory Ratio (Rc) and Form Factor (Rf) e.t.c. The study areas are Asa River Basin and Oyun River Basin. The
GIS based morphometric analysis of these River Basins revealed that both the Asa River Basin and Oyun River Basins are fourth order basins which indicates their drainage pattern to be mainly dendritic type thereby showing homogeneity in texture and less of structural control. Total stream number of Asa River Basin is 54, in which 37 are first order, 12 are second order, 4 are third order and 1 is fourth order, and while the total stream number of Oyun River Basin is 56, in which 45 are first order, 7 are second order, 2 are third order and 2 are fourth order streams. The length of stream segment is maximum for first order stream and decreases as the stream order increases. The drainage density (Dd) of study area of Asa River Basin is 0.39km/km
2
and Oyun River Basin is 0.36km/km2, an indication that the two River Basins are not much affected by structural disturbance. The study and result from the findings will help in determining peak runoff in the basin which helps in managing the water resources in the basins for sustainable development of the basin area.
Keywords:
Geographic Information System, Morphometric Parameters, River Basins1. Introduction
Morphometry is the measurement and mathematic analysis of the configuration of the earth’s surface and the shape and dimension of its location [1]. Morphometry also represents the topographical expression of land by way of area, shape, length etc. these parameters affect catchment stream flow pattern through their influence on concentration time [17]. The significance of these land scape parameters was pointed out by [19], who observed that stream flow can be expressed as a general function o geomorphology of a watershed. The ascertained still stand valid following [16], [22] and [15] who reported that the geomorphic characteristics of river
characteristics of drainage basins such as size, shape, slope of drainage area, drainage density, size and length of the tributaries etc. [25]. Remote sensing data can be used in conjunction with conventional data for delineation of ridgelines, characterization, priority evaluation, problem identification, assessment of potentials and management needs, identification of erosion prone areas, evolving water conservation strategies, selection of sites for check dams and reservoirs etc. [6]. Morphometric analysis of river catchment helps in the interpretation of the landscape and also serves as a powerful means of comparing the form and process of river catchment that may be widely separated in spare and time [7]. In the early days, most river were described as well drained or poorly drained, or they were signified descriptively in the division scheme as being youthful, mature or old [10]. The mechanics of how river channels actually form within a basin and how water gets into the channels was only understood in vague terms by both geologist and hydrologists. Measurement and quantitative expression of river catchment began with the work of James Hutton in 1775. Subsequently, a great step forward was made by [14] when he crystallized previous works added new measures and proposes general method for the description of river catchment characteristic [10].
This study adopted Digital Elevation Model and GIS technology to effectively compute basin morphometric characteristics such as linear, areal and relief parameters of the Asa and Oyun River basins. This analysis aided in understanding the hydrological, geological and topographical characteristics of the basins. The watershed characteristics and storm can be used in synthetic hydrograph analysis to determine design peak runoff in the sub-basin [30, 28 and 29]. The quantitative analysis of morphometric parameters was discovered to be of immense utility in river catchment evaluation, watershed prioritization for soil and water conservation and natural resources management. The influence of catchment morphometric system is very vital in understanding the landform processes, soil physical properties and erosion characteristic. Geographical Information System (GIS) is now used for assessing various terrain and morphometric parameters of the river catchment and watersheds, as it provides a flexible environment and a powerful tool for the manipulation and analysis of spatial information. The main objective of the present study is to analyze the linear and areal morphometric characteristic of Oyun and Asa river catchment by using (GIS). And so far no exhaustive work and the morphometric investigation of the region has been carried out. This study gives an insight into the different geo-hydrological characteristic of the river catchment which in turn help in the management of the water and other natural resources of the areas.
1.1. Literature Review
According to [23] who conducted the morphometric analysis of Tungabhada drainage basin using Arc-GIS software, they studied linear, relief and aerial aspect of drainage basin and found out, the total numbers of streams
are 11894, in that 6058 are first orders, 3446 are second orders, 1345 are third orders and 1045 are fourth order streams. The stream was found to be dendritic in drainage pattern. The length of stream segments was maximum for first order stream and decreased as the stream order increased. The result of the drainage density showed the value 0.11 per square kilometres in the study area, which suggested that the area has highly permeable subsoil. The result of aerial aspect showed the texture of drainage is moderate and the result of elongation ratio indicated the drainage is high relief and steep ground slope. The result of the relief aspect showed the study areas is of high relief and high stream density.
[11] revealed that geographical information system (GIS), global positioning system (GPS), and spatial information system (SIT) has proved to be an efficient tool in deliberation of river pattern and water resources management. GIS and image processing techniques were adopted for the identification of morphometric features and analyzing their properties of the lower Gostani River basin area in Andhra Pradesh state, India. The authors computed morphometric parameters, such as linear and aerial aspect of the river basin. The study revealed that the area is occupied by 96% Khondalite group (quartz-feldspar-garretsillimanite gneiss) of rocks. It is 7th order drainage basin and drainage pattern mainly in sub dendritic to dendritic type, it was observed that the drainage density value is low which indicates the basin is highly permeable subsoil and thick vegetative cover. The circulatory ratio values revealed that the basin is strongly elongated and highly permeable homogenous geologic materials. The author concluded the study would help the local people to utilize the resources for sustainable development of the basin area.
[18], however expressed basin morphometric as a means of numerically analyzing or mathematically quantifying of different aspects of a drainage basin. The authors studied the morphometric analysis of the Manas drainage basin using earth observation data and Arc-GIS. The morphometric parameters considered for analysis included the linear, aerial and relief aspects of the basin. The Manas basin covers an area of 31.480 square km and is an 8th order drainage basin with mainly dendritic drainage pattern. The mean Bifurcation ratio is 3.81 indicating the basin is largely controlled by structure. The basin has medium drainage density of 0.78 per km2 and is elongated in shape. The length of overland flow values of the basin is 0.64, indicating high relief. The study has strengthened in understanding the hydrological, geological and geomorphological characteristics of the Manas drainage basin area.
method based the morphometric analysis found the drainage basin as 4th order drainage basin and drainage pattern mainly in sub dendritic to dentritic type thereby indicating homogeneity in texture and lack of structural control. The total number of stream was 148, in which 95 are first order, 37 are second order, 12 are third order and the fourth order streams are 14. The length of stream segment is maximum for first order stream and decrease as the stream order increases. The drainage density (Dd) of study area is 1.45km/km2. This study would help the local people to utilized the resources for sustainable development of the basin area.
[2] analyzed the morphometric parameters of Ogbere and Ogunpa River basin located on basement complex rock in Southwestern part of Nigeria. Data used were generated from topographical map of Ibadan North east on scale 1:25; 000 published by Federal survey of Nigeria (1975). The result obtained indicated that the studied basins exhibits high spatial variation in their morphometric parameters. The study further revealed that morphometric properties of Ogunpa drainage basin are likely to induce high magnitude flood compare to morphometric properties of Ogbere drainage
basin. The study thus suggested number of management properties that can be used in reducing rates of environmental degradation in the basin.
1.2. Study Area
The study areas in this investigation are in Ilorin and Offa, in Kwara State in the North Central part of Nigeria. Asa River Basin and Oyun River Basin are the Rivers which are being investigated for the purpose of the study. Asa River Basin is located at the South Western part of Kwara State which is at the boundary of the state between longitudes 8°9°N - 4°43’E and between latitudes 4°12’N - 4°29’N, while Oyun River Basin is located in the South Eastern Part of Kwara State between longitudes 4°38’E - 4°03’E and latitudes 9°50’N - 8°24’N. The total area of Oyun River Basin is about 452.80km2 while the total perimeter is 191.5/m2. And Asa River Basin has the total area of 471.95km2 while the total perimeter is 165.98m2 from the analysis carried out. Figure 1 below shows the basins on the map of Nigeria.
Figure 1. Map showing Oyun and Asa River Basin on Nigeria Map.
1.2.1. Geology of Study Area
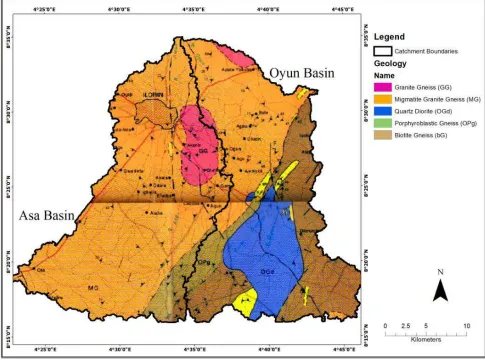
Geology of the Asa River Basin is classified into basements complex rocks of the older granite type and also undifferentiated types. Basement complex is classified into three types which include Granite Gneiss (GG), Migmatite Granite Gneiss (MG) and Porphyroblastic Gneiss (OPG). The Granite Gneiss and Migmatite Granite Gneiss consist of those pre-cambrian era. The pre-cambrian rocks of Asa River Basin consist of granite, shists and gneiss. Those rocks were weathered in depth of 30m to 100m, showing sand/gravel like materials which form unconfined aquifer. This aquifer is
distributed in large scale of the Northern part of Asa River Basin, and suitable for water sources of rural water supply. In addition to above, fractured zone of basement complex also forms aquifer, though distribution of fractured aquifer is not limited compared with weathered aquifer.
rocks. These rocks were also weathered in-situ. Oyun River Basin also form unconfined aquifer. This aquifer is distributed in small scale of the half of Western part of Oyun River Basin, and suitable for water sources of rural area. The southern part of Oyun River consists of Quartz diorite which is an igneous, plutonic (intrusive) rock, of felsic composition, with phaneritic texture. Quartz diorite is present between 5% and 20% of the rock, while the south-eastern part is dominated with Biotite Gneiss (BG) which is a high grade
metamorphic rock, meaning that it has been subjected to higher temperatures and pressures than schist. It is formed by the metamorphosis of granite are sedimentary rock. Oyun River Basin also dominated little porphyroblastic gneiss (OPG) at the south western part, which is a large mineral crystal in a metamorphic rock which has grown within the finer grained ground mass. Figure 2 below describes the geology of the basins.
Figure 2. Map showing Geology of the Asa and Oyun River Basins.
1.2.2. Slope of Study Area
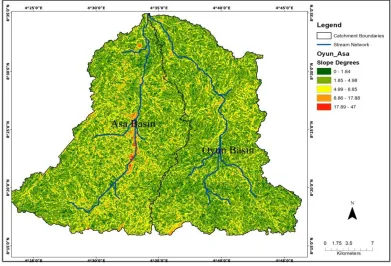
Slope is an important parameter in morphometry studies. An understanding of slope distribution is essential as it plays a significant role in determining infiltration and run-off relation. Infiltration is inversely related to slope i. e. gentler is the slope, higher is infiltration and less is runoff and vice-versa. The slope analysis showed in the study area of Asa River Basin and Oyun River Basin showed that the slope in the study area varies from 0 to 47° with the highest degree of 47 and lowest degree of 1.84.
High slope is witnessed in Asa River Basin in the South Western Part of the watershed which is dominated with the range of 4.99° - 8.85°, with the average slope percentage of
0.07%. These -shows that the slope at Asa River Basin is not very steep and is an open undulating landscapes.
Figure 3. Map showing Slope of the Oyun and Asa River Basins.
1.2.3. Elevation of Study Area
The elevation of a geographic location is determined by the height above and below a fixed reference point, it is mainly used when referring to points on the Earth’s surface and also used for points above the surface. The elevation analysis shown in Asa River Basin and Oyun River Basin varies from 151km lowest point to 520km highest point. The study area shows that the elevation influences climate, as well as where and how people live at the average of 151km to 520km. Above
this elevation, the climate becomes too cold which there is not enough oxygen in the air to sustain human life and also the climate becomes too cold for growing crops. The surrounding area of the study areas are steep and the interior mostly barren-looking with a scattering of volcanic cones. These indicating that the study area of Asa River Basin and Oyun River Basin elevation are less hill with steep slope, thus that people can live and crops can be grown influence with the tropical climate due to the elevation point in the study area.
1.2.4. Soil Distribution of the Study Area
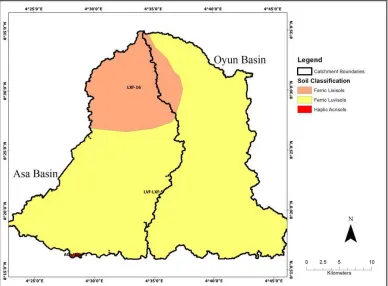
Soil distribution of Asa River Basin and Oyun River Basin consists of ferric luvisols. Oyun River Basin is mainly dominated with ferric luvisols of 99% over Asa River Basin which is dominated at 75% luvisols. The luvisols are technically characterized by a surface accumulation of humus overlying an extensively leached layer that is nearly devoid of clay and iron-bearing minerals. The mixed mineralogy, high nutrient content, and good drainage of these soils make them suitable for a wide range of agriculture.
Oyun River Basin soil distribution is occupying by ferric luvisols than Asa River Basin. These types of soil show that (grains, orchards and vineyards) i. e. crop and fruit trees that require more water for their growth and development are good to grow in the surrounding area.
Ferric lixisols in the study areas are dominated in the upper
Northern part of Asa River Basin which is highly greater than Oyun River Basin. Most ferric luvisols thin, brown, ochric surface horizon over a brown or reddish brown which is indicated in Figure 4 above, the area is indicated at the upper Northern part of Asa River Basin and some part at the Nortwest of Oyun River Basin which are free-draining and lack evidence of water saturation, the ferric luvisols that are dominated in Asa River Basin and Oyun River Basin are strongly weathered soils with low levels of available nutrients and low nutrient reserves. However, the chemical properties of the above area are generally better than ferralsols and arcrisols because of their higher soil pH and the absence of serious Al-toxicity. The areas that contain lixisols in Asa River Basin and Oyun River Basin are under natural savannah or open woodland vegetation and are widely used for low volume grazing.
Figure 5. Map showing Soil Distribution of Oyun and Asa River Basins.
1.2.5. Land Use of Study Area
Bare surface does exist in both Asa River Basin and Oyun River Basin, which indicates that the study area is not cover with physical materials at the surface of the earth such as bare ground, trees, asphalt, and building. Vegetation is used in ecology to describe the overall characteristic of plant cover in an area. Oyun River Basin is highly covered with vegetation than Asa River Basin. People habiting around there are using it for farming such as planting of crops and vegetation which is largely increase in Oyun River Basin than Asa River Basin. Built up areas occur in the upper Northern part of Asa River Basin and lightly occur in the
Northwest of Oyun River Basin but not widely dominated as Asa River Basin. This means that the areas dominated by the built up areas in the study area indicates that people are living in the environment.
Farmland has been innovated at multiple different point and places in Asa River Basin than Oyun River Basin. Farmland indicated in Asa River Basin are owned and operated by a single individual, family, community, co-operation or a company. They produce poultry farms which are devoted to raising chickens (egg layers or broilers) and other fowl, production of prison farm which serve as prisons for people sentenced to hard labour by a court, or prison
farms inmates run the important tasks of a farm and producing crops and also farming such as vineyard (grapes), orchard (nuts and other fruit) and other form of combined with raising livestock, specialist farms are other denoted as such as fish farm milk farm are highly practice in Asa River Basin than River Basin. Table 1 below shows the areas used by each of the river basins.
Figure 6. Map showing Land Use of Oyun and Asa River Basins.
Table 1. Land Uses Parameters and Area covered by the Basins.
Land Use Class Oyun (km2) Asa (km2) Total
Built up Areas 25.47 115.04 140.51
Farm lands 131.14 189.09 320.24
Vegetation 270.01 93.03 363.05
Waterbody 13.15 14.79 27.95
439.78 411.96 851.75
1.2.6. Stream Orders of Asa River Basin and Oyun River Basin
The stream orders of Asa River Basin and Oyun River Basin analysis is determined in the present study; the channel segment of the River Basin was ranked according to Strahler’s stream ordering system. The smallest fingertip tributaries are designated as order 1; where two first-order channels join, a channel segment of order 2 is formed; where two of order 2 join, a segment of order 3 is formed and so forth. The trunk stream through which all discharge of water
Figure 7. Map showing Stream Orders of Study Area.
2. Methodology
The present study is based on the secondary data. The shuttle Radar Topographic Mission data was downloaded from Global Land Cover Facility website. The ArcGIS software was used to analyze the stream order of River Basin. The contour map was prepared from the downloaded topographic elevation data. The Triangulated Irregular Network (TIN) map was created from the prepared contours, using TIN as an input file, the output Digital Elevation Model (DEM) derived. The created DEM was corrected using FILL tool (which removes the errors such as sinks and eliminates discontinuities) in ArcGIS Hydrology toolset. Stream Order tool in strahler method (which assigns a numeric order to segments of a raster representing branches of a linear network) was used to find out pattern of stream in
study area. Pour points were selected to delineate the watershed boundary from the main river joining points of Asa and Ogun River Basin. Number of stream orders was calculated using raster file itself and length of each stream have been calculated using the feature (.shp) file in ArcGIS. The length, perimeter and area of River Basin were calculated using suitable tools in software. The fundamental parameter namely; stream length, area, perimeter, number of streams and basin length were derived from drainage layer. The values of morphometric parameters namely; stream length, bifurcation ratio, drainage density, stream frequency, form factor, texture ratio, elongation ratio and circularity ratio were calculated based on the formulae suggested by Horton [13], [20], [26], [31] and [21]. The formulas adopted in calculating the above mention morphometric parameters are tabulated in Table 2 below.
Table 2. Method of calculating morphometric parameters of River Basin.
Morphometric Parameters Method References
LINEAR
Stream order (u) Hierarchical order Strahler, 1964
Stream length (Lu) Length of the stream Horton, 1945
Mean stream length (Lsm)
Lsm = Lu/Nu; where Lu = mean stream length of a given order (km), Nu = Number
of stream segment Horton, 1945
Stream length Ratio (RL) RL = Lu/Lu - 1; where, Lu = Total Stream length of order (u), Lu - 1=The total
stream length of its next lower order Horton, 1945
Bifurcation Ratio (Rb)
Rb = Nu/Nu+1; where, Nu = Number of stream segments present in the given order Nu + 1 = Number of segments of the next higher order
Schumn, 1956
RELIEF
Basin relief (Bh) Vertical distance between the lowest and highest points of basin Schumn, 1956
Relief Ratio (Rh) Rh = Bh/Lb where, Bh = Basin relief, Lb = Basin Length Schumn, 1956
Ruggedness Number (Rn) Rh = Bh x D where, Bh = Basin relief, Dd = Drainage Density Schumn, 1956
AERIAL
Drainage Density (Dd) Dd = L/A wehre, L = Total length of stream. A = Area of the basin Horton, 1945
Stream Frequency (Fs) Fs = N/A where, N = Total number of stream, A = Area of the basin Horton, 1945
Texture Ratio (T) T = Ni/P where Ni = Total Number of first order stream, P = Perimeter of basin Horton, 1945
Form Factor (RF) RF = A/(Lb)2 where, A = Area of Basin, Lb = Basin Length Horton, 1932
Circulatory Ratio (Rc) Rc = 4ΠA/P2 where A = Area of Basin, Π=3.14, P = Perimeter of Basin Miller, 1953
Elongation Ratio (Re) R = where A = Area of Watershed, Π=3.14, Lb = Basin Length Schumn, 1956
Length of overland flow (Lg) Lg = 1/2Dd where, Dd = Drainage density Horton, 1945
Constant Channel Maintenance (c) Lof = 1/Dd where, Dd = Drainage Density Horton, 1945
3. Results
The results of the morphometric analysis for both the Asa and Oyun River basins adopting the formulas in Table 2 are presented in Tables 3-8.
Table 3. Result of linear parameters of Asa River Basin Area.
Stream Order Number of streams Stream Length (km) Mean Stream Length Stream Length Ratio Bifurcation Ratio
1 37 106.74 1.977 1.68 0.32
2 12 52.45 0.971 3.46 0.33
3 4 18.16 0.336 10.36 0.25
4 1 0.46 0.007 329.3 -
Table 4. Result of linear parameters of Oyun River Basin Area.
Stream Order Number of streams Stream Length Mean Stream Length Stream Length Ratio Bifurcation Ratio
1 45 93.07 1.66 1.74 0.15
2 7 32.14 0.57 5.16 0.28
3 2 8.48 0.15 21.47 1.00
4 2 26.93 0.48 6.19 -
Table 5. Result of relief parameters for Asa River Basin.
Stream Order Relief Ratio Ruggedness Number Basin Relief
1 2.80 67.6 299
2 5.70 33.2 299
3 16.46 11.5 299
4 650 0.29 299
Table 6. Result of relief parameters for Oyun River Basin.
Stream Order\ Relief Ratio Ruggedness Number Basin Relief
1 3.14 61.50 292
2 9.30 20.7 292
3 35.26 5.5 292
4 11.10 17.4 292
Table 7. Result of Aerial Parameters for Asa River Basin.
Stream Order Drainage Density Stream Frequency Texture Ratio Form Factor
1 0.23 0.08 0.22 0.02
2 0.11 0.03 0.07 0.02
3 0.04 0.008 0.02 0.02
4 0.01 0.002 0.006 0.02
Table 7. Continued.
Stream Order Circulatory Ratio Elongation Ratio Length of Overland Flow Constant Channel Maintenance
1 0.22 0.074 0.115 4.35
2 0.22 0.074 0.055 9.09
3 0.02 0.074 0.02 25.00
4 0.22 0.074 0.005 100
Table 8. Result of Aerial Parameters for Oyun River Basin.
Stream Order Drainage Density Stream Frequency Texture Ratio Form Factor
1 0.21 0.08 0.27 0.01
2 0.07 0.02 0.04 0.01
3 0.02 0.004 0.01 0.01
4 0.06 0.004 0.01 0.01
Table 8. Continued.
Stream Order Circulatory Ratio Elongation Ratio Length of Overland Flow Constant Channel Maintenance
1 0.16 0.063 0.105 4.76
2 0.16 0.063 0.035 14.29
3 0.16 0.063 0.01 50.00
The morphometric parameters results obtained for both the Asa and Oyun River Basin were compared and tabulated in Table 9 below while Figure 8-10 shows the comparison of the results of the morphometric parameters of both basins.
Table 9. Comparison of morphometric parameters of Asa River Basin and Oyun River Basin.
Morphometric Parameters Asa River Basin Oyun River Basin
Linear
Total stream number 54 56
Mean stream length 3.29 2.86
Stream length ratio 408 34.6
Bifurcation ratio 0.9 1.4
Total stream length 177.81 160.62
Relief
Relief ratio 1.80 1.52
Ruggedness number 112.59 105.1
Basin relief 299 292
Aerial
Drainage density 0.39 0.36
Stream frequency 0.12 0.11
Texture ratio 0.32 0.33
Form factor 0.02 0.01
Circulatory ratio 0.22 0.16
Elongation ratio 0.14 0.15
Length of overland flow 0.195 0.153
Constant channel maintenance 138.44 85.72
Figure 8. Graph for the comparison of Linear Parameters for Asa and Oyun River Basin.
Figure 10. Graph for the comparison of Relief Parameters for Asa and Oyun River Basin.
4. Discussion of Results
4.1. Linear Aspect
The morphometric analysis includes stream order, stream length, mean stream length, stream length ratio and bifurcation ratio
i. Stream Length: the stream length for stream order 1, 2, 3 and 4 for Asa River Basin are given as 106.74km, 52.45km, 18.16km, 0.46km respectively as shown in the Table 3 and the stream length for stream order 1, 2, 3 and 4 for Oyun River Basin are given as 93.07km, 32.14km, 8.48km and 26.93km respectively as shown in Table 4. The length of stream segments is maximum for first order stream and decreases as the stream order increases. If there is any deviation from its general behavior indicates that the terrain is characterized by high relief/moderately steep slopes, underlain by varying lithology and probable uplift across the River Basin.
ii. Mean Stream Length: the result for mean stream length for stream length of Asa River Basin varies from 0.007 to 1.977 while result for mean stream length for stream order 1, 2, 3, and 4 for Oyun River Basin varies from 0.48 to 1.66. Mean stream length is a property related to the river network components and its associated to basin surface. The mean stream length of any given order is greater than that of the lower order and lesser than in the watershed, mean stream length decreases with increase in stream order. Such anonymity might be due to variations in slope and topography.
iii.Stream Length Ratio: the result for the stream length ratio for stream order 1, 2, 3, and 4 for Asa River Basin are 1.68, 3.46, 10.36 and 329.3 shown in Table 3 while the result for the stream length ratio for stream basin order 1, 2, 3, and 4 for Oyun River Basin as 1.74, 5.16,
21.47 and 6.19 respectively as shown in Table 4. The stream length of ratio can be defined as the ratio of the mean stream length of a given order to the mean stream length of the next lower order and having important relationship with surface flow and discharge and erosion stage of the basin [13]. The values of stream length ratio of Asa River Basin vary haphazardly from one another. It is derived that it is characterized by the late youth to early mature stage of Asa River Basin. The stream length ratio in the Oyun River basin varies between 1.74 to 21.47. This variation might be attributed to variation in slope and topography because the stream length ratio does not reduce as the stream order increase, these indicating the late youth stage of geometric development in the stream of the study area. iv.Bifurcation Ratio: the result for the bifurcation ratio for
4.2. Relief Aspect
i. Relief Ratio: the result for the relief ratio for stream order 1, 2, 3, and 4 for Asa River are 2.80, 5.70, 16.46 and 650 as shown in Table 5 while the result for the relief ratio for stream order 1, 2, 3, and 4 for Oyun River Basin are 3.14, 9.30, 35.26 and 11.10 respectively as shown in Table 6. The maximum relief to horizontal distance along the longest dimension of the basin parallel to the principal River Basin line is termed as relief ratio. It is the ratio of basin length. The high value of the relief ratio of Asa River Basin and Oyun River Basin shown in Table 5 and 6 shows characteristic of hill regions, and low values are characteristic of Pedi plains and valley. The lowest values may indicate the presence of basement rocks that are exposed in form of small ridges and mounds with lower degree of slope. Low relief ratios also indicate that the discharge capabilities of the Asa River Basin and Oyun River Basin are low and chances of groundwater potential are good.
ii. Ruggedness Number: the result for the ruggedness number for stream order 1, 2, 3, and 4 for Asa River Basin are 67.6, 33.2, 111.5 and 0.29 as shown in Table 5 while the result for the ruggedness number for stream order 1, 2, 3, and 4 for Oyun River Basin are 61.5, 20.7, 5.5, and 17.4 respectively as shown in Table 6. An extreme high value of ruggedness number of the above River Basin in Table 5 and 6 occurs when both variables are large and slope is steep.
iii.Basin Relief: the result for the basin relief for stream order 1, 2, 3, and 4 for Asa River Basin is 2.99 which are constant throughout the order as shown in Table 5. The result for the basin relief for stream order 1, 2, 3, and 4 for Oyun River Basin is 2.92 which is also constant throughout the stream order. The basin relief describes the maximum vertical distance between the highest and the lowest elevation within the basin. The basin relief plays a significant rate in landforms development, drainage development, surface and subsurface water flow, permeability and erosional properties of the terrain. The maximum relief of Asa River Basin is 450km and minimum relief is 151km while the maximum relief of Oyun basin is sign and minimum relief is 227km, these indicates that the elevation of the Asa River Basin and Oyun River Basin represent that the land has gentle to moderate slope.
4.3. Aerial Aspect
i. Drainage Density: the result for the drainage density for stream order 1, 2, 3, and 4 for Asa River Basin are 0.23, 0.11, 0.04 and 0.01 as shown in Table 7 while the result for the drainage density for stream order 1, 2, 3, and 4 for Oyun River Basin are 0.21, 0.07, 0.02 and 0.06 respectively as shown in Table 8. Drainage density is defined as the total length of stream of all orders per drainage area. It is the measure of closeness of spacing
of channels. Slope gradient and relative relief are the main morphological factors controlling drainage density. Land drainage density values of Asa River Basin and Oyun River Basin shown in Table 7 and 8 reveals fine drainage texture. The drainage density depends on annual rainfall, infiltration capacity of rocks, vegetation cover, surface roughness and run off intensity. Low drainage density favors regions of highly resistant and permeable subsoil and low relief. High drainage on the other hand is favored in regions of impermeable rocks and high relief. The drainage density of Asa River Basin 0.39 km/km2 and also the whole drainage density of Oyun River Basin is 0.36 km/km2, an indication that the two River Basin are not much affected by structural disturbance.
ii. Stream Frequency: the result for the stream frequency for stream order 1, 2, 3, and 4 for Asa River Basin are 0.08, 0.03, 0.008, 0.002 as shown in Table 7 while the result for the steam frequency for stream order 1, 2, 3, and 4 for Oyun River Basin are 0.08, 0.02, 0.004, and 0.004 respectively as shown in Table 8. The total number stream segme\nt of all orders per unit area is known as stream frequency. The total value of stream frequency for Asa River Basin is 0.12 while the total values of the stream frequency of Oyun River Basin is 0.108 which shows that the basin exhibit positive correlation with the drainage density value of the area indicating the increase in stream population with respect to increase in drainage permeable subsurface material.
iii.Texture Ratio: the result for the Texture ratio for stream order 1, 2, 3, and 4 for Asa River Basin are 0.22, 0.07, 0.02 as shown in Table 7 and 0.006 while the result for the stream order 1, 2, 3, and 4 for Oyun River Basin are 0.27, 0.04, 0.01 and 0.01 respectively as shown in Table 8. Texture ratio also is one of the important concepts of geomorphology which means the relative spacing of drainage lines. The texture ratio depends upon climate, rainfall, vegetation, rock and soil type, infiltration capacity, numerous over impermeable areas than permeable areas. Texture ratio is the product of drainage density and stream frequency and has classified drainage texture into five different textures. The drainage texture less than 2 indicates very coarse, the drainage texture between 2 and 4 is related to coarse, the drainage texture between 6 and 8 is fine and the drainage texture greater than 8 is very fine. The drainage texture for the whole Asa River Basin is 0.32 and the drainage texture for the whole Oyun River Basin is 0.33. This shows that the two River Basin is indicating very coarse texture ratio values for the four orders as given in Table 7 and 8.
factor is defined as the ratio of the basin area to the square of the basin length. This factor indicates the flow intensity of a basin of a defined area [14]. The form factor value should be always less than 0.79 (the value corresponding to a perfectively circular basin). The smaller the value of the form factor, the more elongated the basin will be. Basins with high form factors experience larger peak flow shorter duration whereas elongated watersheds with low form factors experience lower peak flows of longer duration. The form factor of Asa River Basin value for study area shown in Table 7 is 0.02, and the form factor for Oyun River Basin value for the study area shown in Table 8 is 0.01. This indicates that both watersheds are elongated and experience low peak flows per long duration.
v. Circulatory Ratio: the result for the circulatory ratio for stream order 1, 2, 3, and 4 for Asa River Basin is constant throughout which is 0.22 as shown in Table 7 while the result for circulatory ratio for the stream order 1, 2, 3, and 4 for Oyun River Basin value is also constant throughout which is 0.16 as shown in Table 8. Circulatory ratio is influenced by the length and frequency of streams, geological structures, land use/land cover, climate, relief and scope of the basin. Circulatory ratio that is approaching one indicates that the basin shapes are like circular and as a result, it gives scope for uniform infiltration and takes a longer time to reach excess water at basin outlet [20]. He also described the basin of the circulatory ratios range from 0.4 to 0.5 which indicates strongly elongated and highly permeable homogenous geologic materials. The values of circulatory ratio of present study of Asa River Basin and Oyun River Basin are 0.22 and 0.16 respectively as shown in Table 7 and 8, which shows that the basin is elongated in shape, low discharge of runoff and highly permeable subsoil condition.
vi.Elongation Ratio: the result for the elongation ratio for stream order 1, 2, 3, and 4 for Asa River Basin is constant throughout which is 0.074 as shown in Table 7 while the result for the elongation ratio for stream order 1, 2, 3, and 4 for Oyun River Basin value is also constant throughout which is 0.063 as shown in Table 8. Elongation ratio is the ratio between the diameter of the circle of the same area as the River Basin and the maximum length of the basin. The discharge characteristics of any watershed are controlled by the elongation ratio. Elongation ratio also determines the shape of the watershed and can be classified based on these values as circular (0.9-1), Oval is (0.8-0.9), less elongated is (0.7-0.8), elongated (0.5-0.7), and more elongated is (less than 0.5). Regions with low elongated ratio values area susceptible to more erosion whereas regions with high values correspond to high infiltration capacity and low run off. The elongation ratio of Asa River Basin value is 0.14 as shown in Table 7 and Oyun River Basin value is 0.15 as shown
in Table 8. These indicating that both Asa River Basin and Oyun River Basin is less than 0.5 which is more elongated and susceptible to more erosion.
vii.Length of Overland Flow: the result for the length of overland flow for stream order 1, 2, 3 and 4 for Asa River Basin are 0.115, 0.055, 0.02 and 0.005 as shown in Table 7 while the result for the length of overland flow for stream order 1, 2, 3 and 4 for Oyun River Basin are 0.105, 0.035, 0.01 and 0.003 respectively as shown in Table 8. Length of overland flow is one of the most important independent variables affecting hydrologic and physiographic development of River Basin. The average length of overland flow is approximately half the average distance between stream channels and is therefore approximately equals to half of reciprocal of drainage density [14]. Higher value of length of overland flow is indicative of high surface runoff and low relief and whereas lower value of length of overland flow is indicative of low surface runoff and high relief. The whole length of overland flow value for Asa River Basin is 0.195 and the whole length of overland flow value for Oyun River Basin is 0.153. These two River Basin indicate that the length of overland flow shows low surface runoff and high relief of the study areas.
viii. Constant Channel Maintenance: the result for the constant channel maintenance for stream order 1, 2, 3 and 4 for Asa River Basin are 4.35, 9.09, 25.00 and 100 as shown in Table 7 while the result for the constant channel maintenance for stream order 1, 2, 3 and 4 for Oyun River Basin are 4.76, 14.29, 50.00 and 16.67 respectively as shown in Table 8. Constant channel maintenance is the inverse of drainage density as a property termed constant of stream maintenance. This constant is in units of square feet per foot, has the dimension of length and therefore in magnitude as the scale of the land-form unit increases. Specifically, the constant provides information of the number of square foot of watershed surface which is required to sustain one linear foot of stream. The constant also indicates the relative size of land form unit in drainage basin and has a specific genetic connotation [31]. The whole value for Asa River Basin is 138.44 and the whole value for Oyun River Basin is 85.72. It means that on an average 138.44 and 85.72sq. ft. Surface is not needed in the basin for creation of one linear foot of the stream channel.
5. Conclusion
homogeneous nature and there is less structural disturbance. Relief Ratio, Ruggedness Number and Visual Interpretation of Digital Elevation Model (DEM) of study areas indicate moderate and low relief, low run off and low in filtrations with late youth mature stage at erosion development.
Drainage density, texture ratio, circulatory ratio and elongation ratio shows that texture of basin is moderate and shape of basin almost elongated. The complete morphometric analysis of River Basin indicates that the given areas have good surface water prospect. The study will help in analyzing peak runoff, flood estimation and land use extent of the basins which will help manage the water resources and hydraulic structures in the entire basins.
References
[1] Aditya P. Nilawar and M. L. Walker (2014), Investigation on Change Detection in Chandpur Watershed area by using RS and GIS. International Jour. of Multidisciplinary and Current Res. V. 2, 2321-3124.
[2] Ajibade, L. T., Ifabiyi, I. P., Iroye K. A., \Ogunteru, S. (2010). Morphometric Analysis of Ogunpa and Ogbere Drainage Basins, Ibadan, Nigeria. Ethiopian Journal of Environmental Studies and Management, 3 (1), 13-19.
[3] Al-Saud M., (2009). Morphometric Analysis of Wadi Aurnah Drainage System, Western Arabian Peninsula. The Open Hydrology Journal, 3, 1-10.
[4] Bilewu, S. O. Bolaji Sule, Ayanniyi Ayanshola (2009), Optimum Parameter Selection for the Morphemetric Description of Watersheds: A case Study of Central Nigeria.
[5] Chopra, R., Dhiman, R. D., Sharma, P. K. (2005), Morphometry from maps, in: Dury, G. H. (Ed), Essays in Geomorphology, American Elsevier Publ. Co., New York, Pp. 235-274.
[6] Dutta, D., Sharma, J. R., &Adiga, S. (2002). Watershed characterization, prioritization, development planningand monitoring remote sensing approach, technical report ISRO-NNRMS-TR-103-2002 Bangalore: ISRO.
[7] Easternbrook (2000), Surface Processes and Landforms, Macmillian Publishing Co., New York, Pp. 325.
[8] Easthernbrook, D. J. (1993), Surface Processes and Landforms, Macmillian Publishing Co., New York, 325pp.
[9] Eze E. B., Efiong J., (2010). Morphometric Parameters of the Calabar River Basin: Implication for Hydrologic Process. Journal of Geography and Geology, 2 (1\), 18-16.
[10] Gregory, K. J. and Walling, D. E. (2006), Drainage Basin Form and Process. A Geomorphological Approach, Edward Arnold, London, Pp. 456.
[11] Hari Kristina, M., Nageswara Rao K., Swarna Latha P., and Arun Kumar P. (2008). Morphometric Analysis of Gostani River Basin in Andhra Pradesh State, India using Spatial Information Technology, Department of Civil Engineering, GIT, GITAM University, Visakhapatnam - 530, p. 45.
[12] Horton R. E. (1932) in Waikar M. L. and Aditya P. N., (2014). Morphometric Analysis of a Drainage Basin Using Geographical
Information System: A Case study. International Journal of Multidisciplinary and Current Research. Pg 179-184.
[13] Horton, R. E. (1945) in Waikar M. L. and Aditya P. N., (2014). Morphometric Analysis of a Drainage Basin Using Geographical Information System: A Case study. International Journal of Multidisciplinary and Current Research. Pg 179-184.
[14] Horton, R. E. (2010), Drainage Basin Characteristics, Transaction. American geophysical Union, 13, Pp. 350-361.
[15] Ifabiyi, I. P. (2004), A Reduced Rank Model of Drainage Basin Response to Runoff in Upper Kaduna Catchment of Northern Nigeria. Geostudies Forum, 2 (1), 109-117.
[16] Jain, V. and Sinha, R. (2003) Evaluation of Geomorphic Control on Flood Hazard Through Geomorphic Instantaneous Unit Hydrograph. Current Science, 85 (11), 26-32.
[17] Jones (2007), Global Hydrology Processes Resources and Environmental Management, Longman, Pp. 399.
[18] Jenita Mary and Zahid Husain (2011). Morphometric Analysis of the Manas River Basin using Earth Observation Date and Geographical Information System, International Journal of Geomatics And Geosciences, Volume 2, No. 2, 647-654.
[19] Morisahla M. E., (1999), Relation of Morphometric Properties to Runoff in the little Mill Creek, Ehin, Drainage Basin”, Tech Report 17, Columbia University, Department of Geology, New York.
[20] Miller, V. C (1999). A Quantitative Geomorphic Study of Drainage Basin Characteristic in the Clinch, Mountain Area, Verdinia and Tennesser, Project NR 389-042. Tech. Rept. 3 Columbia University, Department of Geology, ONR, Geography Branch, New York.
[21] Nookaratnam, K., Srivastava, Y. K., Venkateswarao, V., Amminedu, E. and Murthyk. S. R., 2005, Check dam positioning by prioritization of micro watersheds using SYI model and morphometric analysis Remote sensing and GIS perspective, journal of the Indian Society of Remote Sensing, 33 (1), pp 2528.
[22] Okoko, E. E. and Olujinmi, J. A. B. (2003), The Role of Geomorphic Features in Urban Flooding: The case of Ala River in Akure, Nigeria, Int. Journal of Environmental Issues, 1 (1), 192-201.
[23] P. Jayashree, B. Mahalingam, and Ramu (2013), Morphometric Analysis of Tungabhadra Drainage Basin in Karnataka using GIS, Journal of Engineering, Computers and Applied Science, Vol. 2, No. 7.
[24] Pranjit K. S., Kalyanjit S., Prem K. and Ankita S. (2013). Geospatial study on morphometric characterization of Umtrew River basin of Meghalaya, India. International Journal of Water Resources and Environmental Engineering. Vol. 5 (8), pp. 489-498, August, 2013.
[25] Rastogi, R. A. and Sharma, T. C. (1976) Quantitative analysis of drainage basin characteristics. Jour. Soil and water Conservation in India, v. 26 (1&4), pp. 18-25.
[26] Reddy P. J. R., (2008). Hydrological Principles Published by University Science Press, India.
[28] SCS. Soil Conservation Service (1972). National Engineering Handbook, section 4, Hydrology. US Government Printing Office, Washington DC, 544.
[29] SCS. Soil Conservation Service (2002). Design of hydrograph. US Department of Agriculture. Washington, DC 2002.
[30] SCS. Soil Conservation Service. (1957). Use of storm and watershed characteristics in synthetic hydrograph analysis and application: V Mockus. U. S. Dept. of Agriculture, Washington, DC 1957.
[31] Strahler, A. N. (1957) in Waikar M. L. and Aditya P. N., (2014). Morphometric Analysis of a Drainage Basin Using Geographical Information System: A Case study. International Journal of Multidisciplinary and Current Research. Pg 179-184.