Smart Meter Integrated With Iot
Puppala Rajendhar, J Belwin EdwardAbstract: With the existing metering system, the system becomes very difficult in real time. By integrating the domestic energy meter with IoT, the present difficulties are solved. This research provides an IoT-integrated smart meter design and implementation. This System has been designed to measure the parameters of the appliances such as voltage, current, power factor, frequency. It also measures power and energy parameters. The design comprises of a smart sensing unit for monitoring the parameters that also detects and controls the status of the home appliances. The measured parameters have been displayed in pc using Arduino and these parameters have been interfaced with Internet of Things (IoT) devices using Ethernet. The Ethernet shield has been used to transmit the measured data to the dedicated webpage with the help of ThingSpeak webserve r, which has been developed by using HTML, CSS style and PHP. The development is cost-effective and user-friendly products easy to expand. The model built was tested and the results are very promising.
Index Terms: Home Energy Management Systems, Energy Monitoring, Internet of Things, Advanced Metering Infrastructure, Smart metering, Smart Sensing.
—————————— ——————————
1
INTRODUCTION
Energy meter is a device used to measure any residence or industrial establishment's energy consumption. Under the traditional metering scheme, the electricity consumption was determined by the hiring company of the energy provider, the individual who visits that area and manually records the reading of the energy meter. The reading of this meter was used to measure the electricity bill. Persons can exploit meter reading through various corrupt practices such as current reversal or CT reversal tampers, partial earth failure state, bypass meter, magnetic interference, etc. Especially in the rainy season, this process becomes very difficult. If the bill has not been charged by any customer, the worker must go to their homes to disconnect the power supply. It’s not an easy way to measure power consumption. Advanced metering infrastructure (AMI) smart meter technology offers two-way data communication and is able to report current and voltage measurements on a regular basis in addition to information on energy consumption. The benefits of a smart meter based on AMI include increased accuracy and reliability, as well as Power line connectivity and other technology such as Ethernet for a meter readingAuthors conducted their preliminary research in exploring HEMS' best modeling and hardware practices along with adoptable communication protocols and also concentrated on exploring how HEMS benefits from demand response and optimization techniques. Authors checked various smart grid modeling methods that can be used for smart HEMS [1]. Authors used ZigBees, NodeMCU, suitable sensors, and relays to prototype a substation online monitoring and control of electrical systems. The substation app is also developed using the MIT app developer [2]. Electrical parameters are measured in the article [3]. The voltage transformer used in this paper is the MYRRA developed step-down 127/4 voltage transformer for calculating the voltage. They used the new transformer ASM010 given by Talema in the current calculation.
For wireless transmission of electrical parameters, the output signals from the sensors are integrated and connected to the XBee unit. Such parameters are stored and evaluated in a database. The data collected will be displayed by (GUI) on the screen. The ZigBee was connected via the host computer's USB cable, which stores the data in a computer system server. There were three types of control techniques used to turn electrical appliances on / off, such as automatic control, manual control and remote control. The voltage and current transformers were used to detect the sinusoidal waveform from an electrical appliance to calculate the appropriate electrical parameters [4]. Used to transform the sinusoidal to a square wave, Zero Crossing Detector (ZCD). This output is provided to the 8051 microcontrollers external interrupt. All information that the microcontroller processes is sent through serial port communication through the XBee. The electrical parameters are transferred and displayed on the PC through this Xbee. Researchers developed power meters in the literaure [5] through the use of voltage and current transformers and the Arduino computing system. A series of voltage and current transformers were set up for preliminary tests to determine the parameters (Vrms, Irms, Power Factor) equipped with a reference power meter AXE MMX-P1 to measure the voltage, current and actual power of a variable array of portable appliances. Authors in article [6] uses the microcontroller module Arduino Uno Rev3 together with the chip ATmega328. The hardware that uses the Arduino microcontroller board, serving as the central controller. It will be connected to a current transformer through the current and voltage sensor circuit to control the electrical parameters. The system converts these measured raw data into digital data input for data acquisition and logs them to a SD card for data retention using the SD / MMC shield module. During testing, numerous data were dumped with loads resulting in distinct results. And the cost of the materials invested on the device is very practical for conventional use of the prototype
Figure 1 Block Diagram of the proposed smart meter
————————————————
• Puppala Rajendhar is currently pursuing doctoral degree program in school of electrical engineering in Vellore Institute of Technology, India, PH-00919492027713. E-mail: [email protected] • Dr. J Belwin Edward (corresponding author) is working as Associate
3365 [7] Focused on the design and development of an
Internet-of-Things (IoT) automatic meter reading (AMR) system for smart cities deployment. A ZigBee wireless sensor network (WSN) supports this framework. The administrator for ZigBee serves as a ZigBee portal responsible for connecting to the Internet. Before transmitting to the cloud, the gateway transforms a data packet (received either from energy or a network router node) from the ZigBee to the TCP / IP protocol. The system was developed in several nearby buildings at Newcastle University, AustraliaIn this paper [8], they first used static methods to evaluate the Power Factor of varying load and compensate. A power factor such as zero crossing detectors, opto-couplers and EXOR gate has been tested using different techniques. Super diode was used here to check voltage and current. And microcontroller shall measure these parameters. On the basis of these measurements, all other information available to assess the potential to solve the problem is determined. On this basis, condensers are automatically taken online or offline by flipping the solid state relay to compensate for the lagging power factor and microcontroller shall measure these parameters. On the basis of these measurements, all other information available to assess the potential to solve the problem is determined. On this basis, condensers are automatically taken online or offline by flipping the solid state relay to compensate for the lagging power factor. This system allows the electricity board to read monthly energy meter readings without a human resource that can be introduced with the aid of the Arduino unit which continuously tracks and records the energy meter reading in its permanent (non-volatile) memory spot. This prototype records the reading continuously and the reading of the live meter can be shown on the consumer's web page on request.
2.
BLOCK
DIAGRAM
AND
BASIC
CIRCUITRY
FOR
MEASURING
THE
PARAMETERS
2.1 Voltage Measurement
The step down potential transformer is used to convert the input supply of 230V to 6-0-6 Vrms AC signal with center tapped
secondary winding. The output of the transformer given to the adder circuit to ensure the voltage varies from 0 to 5V. This output signal is then fed to an analog input channel of Arduino end Device which will show measured voltage in the PC by sampling the input voltage and find the rms value of the voltage signal. Below Figure 2 shows the circuit designed for the voltage measurement.
Where Vrms is given by,
n
V
V
n
i i
rms
2 1
2
(1)Where n is the Number of Samples.
Figure 2 Voltage Measurement Circuit
2.2 Current Measurement
The wire that connected to the load is passing through the current transformer. The voltage is measured across burden the resistor of 50 ohm resistor of the current transformer. The measured voltage is in the range of milli volts. This output signal is given to the amplifier circuit which is made up of LM324. Again the signal fed to the adder circuit to ensure the voltage varies from 0 to 5V. The output signal is then fed to an analog input channel of Arduino Device which will show measured voltage in the PC by sampling the input voltage and find the rms value of the current signal. Figure 3 shows the current measurement circuit diagram.
Where Irms is given by
(2)
Where n is the Number of Samples.
Figure 3 Current Measurement circuit
2.3 Frequency Measurement
In order to measure the frequency, the zero-crossing detector (ZCD) has been used which is made up of LM324. The output of the ZCD is fed to one of the digital inputs of the Arduino and Ton (= Toff) is calculated. The below Figure 4 shows the Frequency measuring circuit.
n I I
n
i i rms
2 1
2
Figure 4 Frequency Measurement Circuit
Frequency
off
on
T
T
F
1
1
1
(3)2.4 Power Factor, Power and Energy Measurement
The PF is calculated based on the current and voltage instantaneous values determined from the load. Based on these quantities, the rms current, the rms voltage, P, S, and then the PF can be estimated. Where,
Active power
ni i i
I
V
n
P
1
1
(4)
Apparent Power
S
V
rmsI
rms (5)Power Factor
S
P
PF
(6)Energy
E
P
*
t
(7)Where Vrms is the rms voltage, Irms is the rms current and t is
the total time
3 PROPOSED
SMART
METER
INTEGRATED
WITH
IOT
Figure 1 shows the block diagram of the proposed work. A potential transformer used to reduce the voltage from single phase 230V ac to 6V ac and 50Hz waveform. Adder and Potential divider circuit used as the signal conditioning circuit in order to prevent the Arduino from over voltage and current. To measure the current, the main line is taken through the CT and connected to the Load. The project used ASM010 series CT to measure the current through line which converts the maximum of 10A current into 40mV waveform. Again, this low voltage cannot be read by Arduino. Hence, the signal is given to the LM324 amplifier circuit to amplify the magnitude of the signal. Again this signal is given to adder and Potential divider circuit for signal conditioning. After getting the conditioned signal of both voltage and current waveform, the signal given to Arduino which is having an in-built Analog to Digital converter (ADC) gives the digital signal. Then, the digital signal is processed by the microcontroller and Vrms, Irms, Power
factor, Power and Energy can be measured. The output of the voltage transformer is given to the Zero Crossing Detector
frequency of input voltage waveform frequency. From the rectangular waveform, the negative portion can be eliminated using a simple diode, and the peak voltage is reduced using the voltage divider circuit. The final pulse will be given to Arduino digital pin to measure the pulse width. The frequency of the signal is calculated by inversing the total time of one cycle. Those details will be displayed on the PC using the serial monitor.
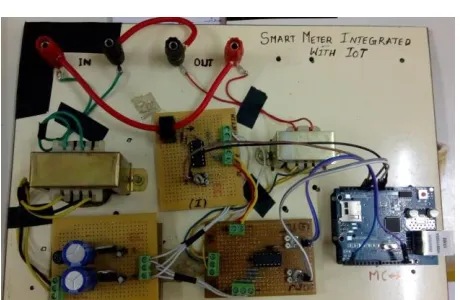
Figure 5 Overall Hardware Arrangement
Figure 6 Prototype of Hardware Arrangement
3367 Main page, Data logging page and details page. Languages
like HTML, PHP, MySQL, CSS, and Java Script are used to create the webpage. The page reads the data from the thingspeak server using the read API key and Calculate the minimum and maximum value of the data which is passed and shown on the Main page. The login page is used to make sure that the right user accessed the data. From the data logging page, the user can view their data as a graphical representation. Considering all these in mind the page is designed. In the power supply unit, we have used DB107 instead of individual diodes which consume more space and power when compared to DB107. However, the cost of DB107 is a little high compared to diodes.
4 DEMONSTRATION
OF
PROTOTYPE
RESULTS
RIGIOL DS1000E series Digital Oscilloscope used in this project for the Calibration of the signal to fetch the hardware results. Also, HAOYUE DT830D Digital Multimeter used for measurements. Each stage outputs are shown below.
4.1 Voltage Measurement
Figure 7 depicts the output of the Voltage transformer, input of 238V (RMS) output is 7.17V (RMS). This voltage waveform fed to the adder circuit to make sure that voltage swings only on the positive side since the negative signal cannot be given to Arduino or any other ADC circuit.
Figure 7 Output of Voltage Transformer
Figure 8 shows the output after the signal conditioning. There are two stages of signal conditioning. One is adder and another one is a voltage divider. The analog input to the Arduino should be a maximum of 5.5V. But the output of the adder will be 2 times more than the peak voltage if the input signal. Hence, it should be reduced to 5V in order to feed the signal to the Arduino analog pin. This signal is given to Arduino and will be processed (sampled) and VRMS calculated as per Equation 1
Figure 8 Output of Voltage waveform after signal conditioning
The output of the Arduino after calculation in terms of RMS voltage is 237.76V which is almost equal to the input RMS voltage of 238V (Measured by Digital Multimeter). The error percentage is 0.1.
4.2 Current Measurement
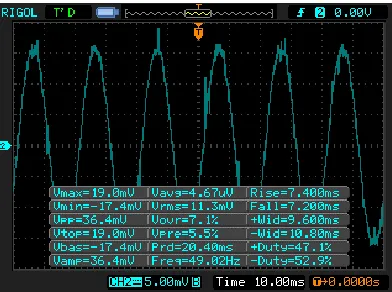
Figure 9 shows the Output of the Current Transformer. ASM-010 converts a maximum of 10A current into 40mV Peak Voltage across 50Ω connected parallel to the output leads of the Current Transformer. For the 1000W resistive load, the output voltage across the 50Ω resistor is 19mV peak voltage. This small variation in output cannot be read by the Arduino.
Figure 9 Output of Current Transformer
Hence, this waveform should be amplified with Non-Inverting amplifier with a gain of 151 according to Equation,
in F
out
V
R
R
V
1
*
2
when R2 = 1kΩ and RF = 150kΩFigure 10 Output Current waveform of Amplifier
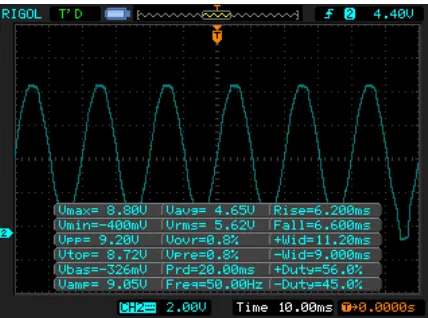
As mentioned under Voltage measurement section 4.1 Signal condition should be done in order to give the signal to an analog pin of Arduino. Figure 11 shows the output of the Adder Circuit. The voltage swing from -400mV to 8.80 V. This will be given to a voltage divider circuit to make sure that the voltage does not exceed more than 5V.
For maximum case, the output from the CT is 40mV. Hence, the output from the Amplifier is almost 5.45V. When this is given to the adder circuit the maximum voltage is 11V.
Figure 11 Output Current waveform after Adder
Hence, the divider circuit will have R1=2.2kΩ and R2=3kΩ
according to Equation .
This signal will be given to Arduino and RMS value of current Calculated as 4.17A.
4.3 Frequency Measurement
Figure 12 represents the output of the voltage transformer. The maximum voltage of 10.2V. This waveform is given to Zero Crossing Detector to convert the sine wave to a rectangular waveform. After that, a 1N4001 diode is used to
remove the negative portion of the rectangular waveform. After that Voltage divider used to reduce the maximum voltage of 13.2V to 5V two resistors with the ratio of 1.6 are used (i.e. R1
= 1kΩ and R2 = 2kΩ).
Figure 12 Input Voltage waveform to the Zero Crossing Detector
Figure 13 shows the final Arduino input of the pulse signal to find the frequency. The Arduino will calculate the Ton and which
is equal to Toff both will be added and the frequency can be
calculated using Equation 3. The final Calculated value of the Frequency is 50.05Hz for the input of the 50Hz waveform.
Figure 13 Output of Zero Crossing Detector after signal conditioning
4.4 Power Factor, Power and Energy Measurement
As discussed in section 2.4, Active power P can be calculated using the formula 4 and apparent power S can be calculated by multiplying the RMS Voltage and RMS Current as Equation 5. The difference between Apparent power and Active power will give Reactive power. The power factor can be calculated using Equation 6. For the above results the Active power calculated as (through Arduino) 980.55W and apparent power as 991.46VA. From this Power factor calculated as 0.989 and Reactive power as 10.91VAr. The below Table 4.1 shows the Parameters measured for the R Load and Table 4.2 shows for R-L Load
Table 4.1 Parameters Measured for R Load
VRMS IRMS F P S Q PF 237.76
V
4.17 A
50.05H z
980.55 W
991.46V A
10.91VA r
0.98 9
Table 4.2 Parameters Measured for R-L Load in
out
V
R
R
R
V
*
2 1
2
3369
236.21 V
2.78 A
49.98H z
489.86 W
656.65V A
166.79VA r
0.74 5
4.5 Results in PC
Below Figure 14 shows the output displayed in the PC through the Arduino IDE Serial monitor.
Figure 14 Output displayed in PC Serial Monitor
4.6 Webpage Results
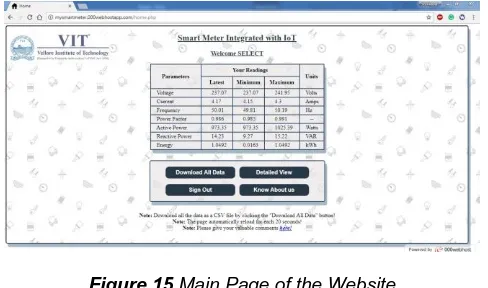
Users can go to https://mysmartmeter.000webhostapp.com/ to view the smart meter readings on the website. The user can login with his details. For this proto-type Username is ―SELECT‖ and Password is ―VIT‖. After login user will get the main page as shown in Figure 15. There he/she can see the current readings, minimum and maximum readings.
4.7 Data Logging Page
By clicking the Detailed view from the main page user can go
Figure 15 Main Page of the Website
Figure 16 Data Logging Page
to the data logging page and he/she can give the required details and submit, he/she will receive the details of the reading in terms of graphical representation as shown in the below Figure 4.9.
5 CONCLUSION
The proposed model is used to track the household's energy consumption. Such smart meters can be used to solve problems such as over-use of energy, large amounts of resources control of use and expense and resource wastage, bribery, etc. It therefore decreases energy consumption and raises awareness among everyone. The value of the working model is to reduce the requirements of resources in the assessment of energy readings and also to minimize the errors caused by them.
6
ACKNOWLEDGMENT
The authors wish to thank Seenivasan R, Hemalatha K, Anitha S for their support in coding for HTML, PHP for a webpage and their assistance in preparing a prototype.
7
REFERENCES
[1] P. Rajendhar, B.E. Jeyaraj, Application of DR and co-simulation approach for renewable integrated hems: A review, IET Gener. Transm. Distrib. 13 (2019) 3501–3512. doi:10.1049/iet-gtd.2018.5791.
[2] P. Rajendhar, P.P. Kumar, R. Venkatesh, Zigbee based wireless system for remote supervision and control of a substation, in: 2017 Int. Conf. Innov. Res. Electr. Sci. IICIRES 2017, Institute of Electrical and Electronics Engineers Inc., 2017. doi:10.1109/IICIRES.2017.8078315. [3] N.. Suryadevara, S.C. Mukhopadhyay, S.D. T. Kelly, S.. S.
Gill, WSN-based smart sensors and actuator for power management in intelligent buildings, IEEE/ASME Trans. Mechatronics. 20 (2014) 564 – 571.
[4] M. Kam, N.K. Suryadevara, S.C. Mukhopadhyay, S.P.S. Gill, WSN based utility System for effective monitoring and control of household power consumption, in: Conf. Rec. - IEEE Instrum. Meas. Technol. Conf., 2014: pp. 1382–1387. doi:10.1109/I2MTC.2014.6860973.
[5] N. Tamkittikhun, T. Tantidham, P. Intakot, AC power meter design for home electrical appliances, in: 12th IEEE Int. Conf. Electr. Eng. Comput. Telecommun. Inf. Technol., 2015. doi:10.1109/ECTICon.2015.7207005.
[6] A.L. Vergara, H.M. Villaruz, Development of an Arduino-based automated household utility power monitoring system, in: 7th IEEE Int. Conf. Humanoid, Nanotechnology, Inf. Technol. Commun. Control. Environ. Manag. 2014 Jt. with 6th Int. Symp. Comput. Intell., IEEE, n.d. doi:10.1109/HNICEM.2014.7016233.
[7] A.. Al-Ali, I.A. Zualkernan, M. Rashid, R. Gupta, M. Alikarar, A Smart Home Energy Management System Using IoT and Big Data Analytics Approach, IEEE Trans. Consum. Electron. 63 (2017) 426–434.