2827
An Efficient Fine Grained Analysis With Special
Queue Based Trust Scheme For Packet Loss In
Mobile Adhoc Networks
M.A. Maria Parimala, Dr. S. SaravananAbstract: Mobile adhoc network (MANET) comprises numerous mobile nodes which are autonomous to one another. This paper presents a Fine -Grained Analysis (FGA) with special queue (FGA-S) model which analyzes the reason for packet loss and notify the important cause of the loss. The presented model aimed to correctly identify malicious nodes, using network parameters to determine whether packet losses are due to queue overflows or node mobility in MANET. The proposed model makes use of three parameters for the malicious node identification namely medi um access control (MAC) layer information, node mobility and queue overflow. The presented FGA-S model involves a special queue strategy to assign queues based on priority which further helps to achieve better security while forwarding the data. The performance of the presented FGA -S algorithm is simulated in NS2. To implement this method, the results are analyzed under varying number of nodes as well as speed. Under the presence of more attacker nodes, the presented FGA-S model offered maximum detection of attackers than the other compared trust models. The experimental outcome exhibited the superior characteristics of the presented FGA-S model under several evaluation parameters.
Index Terms: MANET, Trust, Malicious node, Security.
—————————— ——————————
1
INTRODUCTION
Mobile adhoc networks (MANET) comprises a collection of mobile nodes which are interconnected to one another through wireless connections in an infrastructure less network. Though cooperative operation is required by every node for ensuring effective functioning of the MANET, several implicit limitations like rapidly modifying topology and non-centralized architecture, they are susceptible to diverse attacks through misbehaving nodes. For instance, a node will drop the data packet because of malicious actions, node offers wrong routing details to other nodes for disrupting the network, and a node does not contribute in routing functions to achieve energy efficiency [1]. For identifying and isolating non-cooperative nodes in MANET, a several trust-based security models have been devised. Here, trust can be represented as the level of fulfilling the expectation of other nodes. Under trust based models, every node in the network will manage an independent trust table for computing and storing the trust values. Utilizing the computed trust value, Routing decisions were made. In some cases, the existing trust based models failed to gather the real reasons of malicious event. It results to various false positives where the genuine nodes are considered as malicious. It is due to the limitation that the trust-based security models considered that packet loss arises due to the malicious events carried out by misbehaving nodes. On the other hand, packets will be lost in MANET because of several actions like wireless link transmission error, mobility, and congestion [2]. With no utilization of fine-grained analysis (FGA) for packet loss in the trust construction task, the classical models lead to false trust estimation particularly under highly mobile and high data rate scenarios. This paper presents an FGA with special queue (FGA-S) model which analyzes the reason for packet loss and notify the important cause of the loss.
The main variables which are determined to investigate the packet loss are identified. It makes use of diverse variables like MAC layer details, queue information, and rate of link modifications for link profiling among the adjacent nodes. The local details are utilized for achieving precise details about the network. Though global details might offer adequate details, it is probable that the wrong details offered by the misbehaving node can avoid the security processes. Every node investigates the trust level of the node to forward the packets by the use of FGA-S variables. It can be applied to any primary trust-based model which enables the node to determine the trust level of other nodes. This scheme is extended by the inclusion of the special queue strategy to assign queues based on priority. The presented FGA-S model is simulated using Network Simulator 2 (NS-2) and a detailed comparison is made with other secure trust models under several measures.
2
R
ELATEDW
ORKSMarti et al. [3] presented a primary model where the watchdog and path-rater method designed on the DSR technique for minimizing the influence of malicious nodes on the throughput. It has a limitation that it treats every packet drop as misbehaviour by a node despite of its causes. Furthermore, they could not identify the misbehaving nodes under indefinite packet collision, restricted communication power, partial dropping, and collaborative attacks. For resolving these issues, numerous acknowledgement based identification models namely TWOACK [4], AACK [5], and EEACK [6] are presented. Under the TWOACK model, each of the three successive nodes present in the route between two nodes needs to acknowledge the transmission of each packet. An enhanced TWOACK model known as AACK is presented. Generally, it integrates the two processes of TWOACK and dedicated acknowledgement schemes. Though overhead is slightly minimized in AACK model over the TWOACK model, it still faces the drawback in the detection of malicious nodes in the existence of wrong misbehaviour reports and forged acknowledgment packets. Shebaro et al. [7] introduced a FGA model for analyzing the reasons of packet losses in wireless sensor network (WSN) where a set of three parameters are employed for link profiling. It is found to be efficient in WSN which has a stable topology; however, the same parameters could not be employed in
————————————————
• Research Scholar, Department of Computer and Information Science, Annamalai University, Chidambaram, India. [email protected]
2828
MANET due to highly dynamic environments. Next, Shabut et al. [8] introduced a defense trust model that filters out the second hand details with respect to three parameters namely confidence, deviation and distance. Parker et al. [9] recommended an intrusion detection model which needs the observer nodes to eavesdrop traffic in the communication range. It is argued that those traffic eavesdropping could results to effective identification of message dropping and modification attacks. But, some of the attacks like mis-routing attacks could not be identified. The process of identifying and responding to packet loss is an essential component from any detailed security solution. For avoiding the false positives, prior to isolating malicious nodes from the route in the trust based security models, a detailed examination is needed for finding the exact reason of the packet losses. With no detailed examination, the results of the fundamental security solution might be degraded, leads to the sacrifice of genuine nodes and interruption of the regions in the network where the real malicious nodes are not identified [10]. So, the present MANET trust-based models required to be extended with the models which have the capability to carry out a proper identification of the causes of packet loss, treating the run-time network status for detecting the actual misbehaving nodes. R.H. Jhaveri et al [11] proposed Trusted Routing Scheme with Pattern Discovery (TRS-PD) to calculate neighbors distrust value using control and data packets dropping ratios. It also designs a model to find the attack pattern to work over the trust based scheme. But it does not analysed the cause of packet loss. Enhanced TRS-PD [12]is the enhancement of TRS-PD with ditch ratio to estimate the distrust of its neighbors. Energy consumption is considered and improves the packet delivery ratio over ERS-TD by enhancing routing decisions. The Proposed MethodAs demonstrated in this document, the numbering for sections upper case Arabic numerals, then upper case Arabic numerals, separated by periods. Initial paragraphs after the section title are not indented. Only the initial, introductory paragraph has a drop cap.
3
CITATIONS
3.1 Basic Concepts
In this segment, we establish the essential parameters to use in summarizing the links between nodes dependent on the examination of packet loss. For differentiation among a packet drop either because of network status or attacks by malicious nodes, a set of parameters are analyzed to look for the actual reason of packet loss. Every parameter lies in the value ranges of 0 to 1. Besides, it is noted that the FGA-S model is placed at every node present in the network. This scheme is extended by the inclusion of the special queue strategy to assign queues based on priority.
3.1.1 MAC layer information
A packet might be lost at the MAC layer of a forwarding node for several causes namely out-of-range next hop or obsolete routing accesses. Thus, the MAC layer data is considered as one of the mainly essential parameters to evaluate the probable reasons of packet failure between 2 nodes. As declared in the IEEE 802.11 MAC layer requirements, a dispatcher node sends an information packet and obtains link layer recognition from the receiver. To analyze a link for probable communication of information packet, [13] presented a process of sending a search packet previous to sending the real information packet. Each node broadcasts probes at an average period t. Every
node remembers the probes it receives during the last w seconds. When nodes are getting probable number of HELLO communications from neighbor nodes, it means that there are no interfering links above the link. Thus, when a node drops an information packet, it could be recognized as a mischievous node, eliminating the opportunity of a link issue. Still, when a node doesn’t get the predictable number of HELLO communications from various neighbour nodes, it is considered that several link interfering issues exists among these two nodes. A node 𝐴 can calculate the possibility that the information packet would be effectively transmitted to a node 𝐵
with monitoring the value of the link layer among the two nodes by the use of HELLO packets. The subsequent formula is utilized for computing the packet forwarding possibility at the MAC layer among 2 nodes:
𝑃 =𝜉 ( )
𝜉 ( )
(1)
where 𝜉 indicates the total number of HELLO packets obtained and 𝜉 are the predictable number of HELLO packets through a exacting interval (𝑓 𝑓) .
3.1.2 Queue overflow
In MANETs, queue can be overflowed because of many concurrent roles namely being together routers and terminals with multi hop forwarding nodes, and to the frequent communication of topology messages. If the amount of routing traffic is extremely high, information traffic may not be transmitting in any way or being transmitted at a very small rate that may leads to stagnation. Because of queue overflow in a node, packet could be lost with a forwarding node, and this node might be distinct as malicious with the source node although it is not. Furthermore, congestion resultant from an amount of information packets which exceeds the queue length might also results in packet loss by queue overflow. Traffic load intensity (TLI) [14] is the metric use to decide the queue position at the nearest nodes. Here, a source node remains track of the most recent traffic load data at every forwarding node in a table. Every forwarding node sometimes models its boundary queue length in the MAC layer, and corresponds to the source node as a division of its HELLO communications. Let 𝐵 exist a forwarding node, let 𝑞 exist the 𝑦 sample value denoting the
queue length at the present moment, and 𝑄 be the queue length sample count gathered over the duration of interest, and the average load traffic at node 𝐵 could be defined by
𝑇𝐿 =1
𝑄∑ 𝑞
(2)
Let 𝑞 be highest length of the boundary queue of node 𝐵 at
the MAC layer and the TLI at node 𝐵 are described as follows:
𝑇𝐿𝐼 =𝑇𝐿
𝑞
(3)
And the packet forwarding accomplishment possibility based on probable queue excesses (indicated with𝑃 ) at node 𝐵 could be represented using the subsequent expression:
𝑃 = 1 − 𝑇𝐿𝐼 (4)
2829
schemes if a malicious node doesn't openly go behind the protocol and remains in its queue position. For example, a malicious node might define that the queues are continually full. Such a node will be eliminated from the routing pathway, an unwanted result to attackers. Consequently, malicious node has small cause to distribute incorrect status information concerned the queue, as nodes through potential queue overflow would not be chosen as forwarding nodes.
3.1.3 Mobility
Mainly the trust dependent systems leverage eavesdropping methods to evaluate the trust values of the node. In such methods, a node which forwards a packet to its subsequent hop also listen in the re-communication of the packet to the subsequent hop in the promiscuous mode. It is very important in make certain, ultimately, an accurate rescue of the packet to its ending target. When source nodes listen in the packet forwarding from the forwarding node, it is measured as a successful communication; or else, it is measured as mischief. Under some cases, when a source node could not correctly overhear the re-communication of its packet although it happened, or a target node are inaccessible because of stale routing data, a kindly forwarding node might be noticeable as misbehaving. For this cause, node mobility has an essential role in perceiving the responsibility of a forwarding node. A node could establish the mobility of the nodes in its nearby area by evaluating the nearby rate of link modifications. Such rate could be leveraged to examine the probable reasons of packet failure actions. The rate of link modifications at node 𝑧 can be defined with the subsequent equation:
𝜂 = 𝜆 + 𝜇 (5)
where 𝜆 indicates link coming rate and 𝜇 defines link breakage rate occurrence with the node 𝑧. Dependent on the outcomes with [15] which illustrate how the highest link coming rate 𝜆 𝑚𝑥
becomes equivalent to the breakage rate, the highest link alter rate (𝜂𝑚𝑥) are created as 𝜆 𝑚𝑥 + 𝜂 𝑚𝑥 = 2 ∙ 𝜎. The rate of link modifications could be created as follows:
𝜂 =𝜆 + 𝜇
2 ∙ 𝜎 (6)
Using Eq. (6), the possibility of successful packet forwarding through rate of link modifications could be created as:
𝑃 = 1 − 𝜂 (7)
It is observable from the maximum rates of link modifications denote extra dynamic neighborhood which leads to a lesser possibility of successful packet forwarding. Using the integration of packet loss possibilities, a final packet forwarding probability index (FPI) [10] can be defined. It indicates the possibility in which a packet can be properly forwarded.
𝐹𝑃𝐼 =𝛼𝑃 + 𝛽𝑃 + 𝛾𝑃
𝛼 + 𝛽 + 𝛾 (8)
where 𝛼 + 𝛽 + 𝛾 = 1. Here, α, β, and γ indicates the weights allocated to every parameter. They are application- and network dependent, as the network administrator can give privilege for few parameters over others.
3.2 FGA-S model with Special Queue Strategy
The FPI of every neighbor node can be determined by a source node .It is compared to the present action of every node, in order to evaluate the rightness of the calculated trust level by applying the trust based model.
Procedure FGA-S
For all neighbour node v do FPI is Calculated
If FPI > thresholdFPI then
FPI is Calculated
If FPI > thresholdFPI then
t--; t is the trust computed by trust scheme End if
If t>thpr then thpr is threshold of packet loss rate
v is malicious node Else
Store FPI in routing table End if
End For End FGA-S
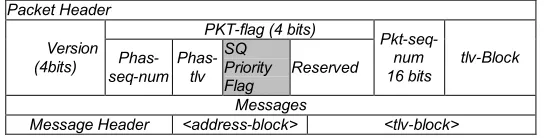
To achieve security, a new mechanism of special queue allocation based on priority is introduced. Here, every data packet has an own field called special queue priority flag as in Fig 1.
Fig 1.Data Packet with SQ Priority Flag
Upon the reception of a packet, the node will check the status of the special queue field. If it is enabled, the node frees its queue length and a high priority will be given for data transfer. This scheme will make it hard for the attacker to know the channel of data transmission whether the data is communicating in a standard queue or special queue.
Procedure SpecialDynamicQueue (SDQ) DPi: Data packet i
CRP: Current Running Process Max: queue maximum size Pi: Header of packet i
VIP :Very Important Packet (Packet with Priority Flag=1)
Step 1: Packet header Pi of DPi is tracked to check if Priority Flag set to 1
Step 2: If Priority Flag is set to 1 then
Special Queue of size 1:4 ratio is alloted to hold DPi
CRP put to Sleep State Datapacket Dpi processed
Release Special Queue Buffer Put CRP to Active state Else
Add the Datapacket Dpi to Normal Queue End SDQ
4
EXPERIMENTAL
VALIDATION
The experimental outcome of the presented FGA-S algorithm is simulated in NS2. To implement this method, the results are analyzed under varying node count of 0-50 nodes as well as varying speed of the nodes between 1 and 10 m/s In addition, to analyze the consistency in real time cases, two nodes are chosen in a random way. In NS-2, all packet losses are saved in
Packet Header
Version (4bits)
PKT-flag (4 bits) Pkt-seq-num 16 bits
tlv-Block
Phas-seq-num
Phas-tlv SQ Priority Flag
Reserved
Messages
2830
a trace file next to its dropping reason, so, the results of the experiments are analyzed by parsing the trace files. A set of measures used to analyze the results are detection ratio, throughput, delay, energy consumption and overhead.
4.1 Results analysis interms of detection ratio
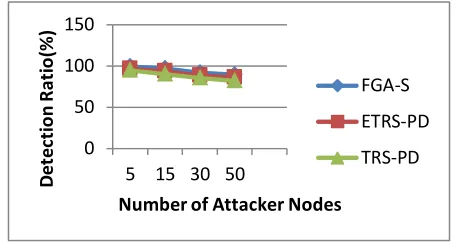
Fig. 2 shows the detection rate analysis of the proposed method under varying number of attacker nodes. From the figure, it can be seen that the presented model attains maximum detection rat over the compared methods. With increasing attacker node density, the number of data connections in the network also increases; hence more packets are dropped in the network due to collisions. The existing schemes consider normal packet drops as misbehaving activity from legitimate nodes. Therefore, as shown in the figure, the detection rate is again higher in the presented FGA-S scheme than other methods. For instance, under the presence of 5 attacker nodes, the TRS-PD technique offers poor detection results by attaining a least detection rate of 94.6% whereas the ETRS-PD model tries to perform well by achieving a high detection rate of 96.3%. However, the presented FGA-S model offered maximum detection with the highest detection rate of 99.3%. Similarly, under the presence of 15 attacker nodes, the TRS-PD technique offers poor detection results by attaining a least detection rate of 90.1% whereas the ETRS-PD model tries to perform well by achieving a high detection rate of 93.5%. However, the presented FGA-S model offered maximum detection with the highest detection rate of 96.7%. At the same time, under the presence of 30 attacker nodes, the TRS-PD technique offers poor detection results by attaining a least detection rate of 85.1% whereas the ETRS-PD model tries to perform well by achieving a high detection rate of 88.4%. However, the presented FGA-S model offered maximum detection with the highest detection rate of 91.8%.
Fig.2. Detection rate analysis under varying number of attacker nodes.
4.2 Results analysis under varying node count
Fig. 3 shows the results attained by different techniques interms of throughput. By looking into the figure, it is evident that the ETRS-PD exhibits less performance by attaining least throughput value. Next to that the TRS-PD offered moderate performance by achieving slightly higher throughput value. On all of the above, the presented FGA-S technique showed maximum performance with highest value of throughput. For instance, under the presence of minimum 5 nodes, the TRS-PD fails to show case effective results and achieved a minimum throughput of 48.3kbps. Subsequently, the ETRS-PD model manages well and offered high throughput of 51.3kbps. However, the projected FGA-S model outperforms these two methods by attaining maximum throughput of 54.8kbps.
Likewise, under the presence of minimum 15 nodes, the TRS-PD offered ineffective performance and attained a lowest throughput of 37.3kbps. Afterwards, the ETRS-PD model tries to perform effectively and offered high throughput of 40.1kbps. Nevertheless, the projected FGA-S model outperforms these two methods by achieving highest throughput of 43kbps. Along these lines, under the presence of maximum of 30 nodes, the TRS-PD fails to show case effective results and achieved a minimum throughput of 20.1kbps. Next, the ETRS-PD model showed slightly better results and offered high throughput of 23.9kbps. However, the projected FGA-S model outperforms these two methods by attaining maximum throughput of 26.7kbps. From these values, it is also noticed that the throughput gets decreased with increasing node count.
Fig.3. Throughput analysis under varying node count
For instance, under the presence of minimum 5 nodes, the TRS-PD fails to show case effective results and achieved a minimum throughput of 48.3kbps. Subsequently, the ETRS-PD model manages well and offered high throughput of 51.3kbps. However, the projected FGA-S model outperforms these two methods by attaining maximum throughput of 54.8kbps. Likewise, under the presence of minimum 15 nodes, the TRS-PD offered ineffective performance and attained a lowest throughput of 37.3kbps. Afterwards, the ETRS-PD model tries to perform effectively and offered high throughput of 40.1kbps. Nevertheless, the projected FGA-S model outperforms these two methods by achieving highest throughput of 43kbps. Along these lines, under the presence of maximum of 30 nodes, the TRS-PD fails to show case effective results and achieved a minimum throughput of 20.1kbps. Next, the ETRS-PD model showed slightly better results and offered high throughput of 23.9kbps. However, the projected FGA-S model outperforms these two methods by attaining maximum throughput of 26.7kbps. From these values, it is also noticed that the throughput gets decreased with increasing node count. Next, an energy consumption analysis of different techniques is carried out under varying number of nodes and the results are displayed in Fig. 4. The figure clearly demonstrated that minimum amount of energy is utilized by the presented method over the other methods. At the same time, the ETRS-PD model shows slightly higher energy consumption over TRS-PD method but not than projected FGA-S method. It is also noted that maximum amount of energy consumption takes place by TRS-PD method.
0 50 100 150
5 15 30 50
D
e
te
ct
io
n
R
at
io
(%
)
Number of Attacker Nodes FGA-S
ETRS-PD
TRS-PD
0 20 40 60
5 15 30 50
Th
ro
u
gh
p
u
t(
Kb
p
s)
Number of Nodes
FGA-S
ETRS-PD
2831
0 10 20 30 40
5 15 30 50
R
o
u
ti
n
g
Over
h
e
ad
(%
)
Number of Nodes
FGA-S
ETRS-PD
TRS-PD
Fig. 4. Energy consumption analysis under varying node count
For instance, under the presence of minimum 5 nodes, the TRS-PD fails to showcase effective results and achieved a maximum energy utilization of 7.1J. Subsequently, the ETRS-PD model manages well and offered slightly lower utilization of 3.2J. However, the projected FGA-S model outperforms these two methods by attaining minimum energy consumption of 1.5J. Likewise, under the presence of 15 nodes, the TRS-PD offered ineffective performance and attained a highest energy consumption of 12.3J. Afterwards, the ETRS-PD model tries to perform effectively and offered high energy utilization of 9.9J. Nevertheless, the projected FGA-S model outperforms these two methods by achieving highest energy utilization of 6.5J. Along these lines, under the presence of maximum of 30 nodes, the TRS-PD fails to showcase effective results and achieved a maximum energy consumption of 25.1J. Next, the ETRS-PD model showed slightly better results and offered high energy consumption of 21.3J. However, the projected FGA-S model outperforms these two methods by attaining least energy consumption of 16.2J. From these values, it is also noticed that the energy utilization gets drastically increased with increasing node count.
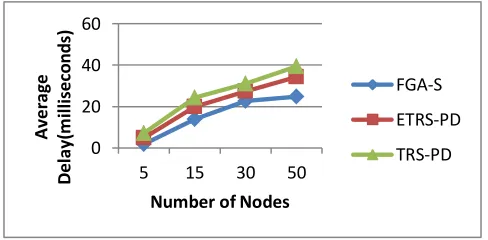
Fig. 5. Average delay analysis under varying node count
Fig. 5 shows the investigation of the results obtained by the projected and compared methods in terms of delay. The technique which incurs less delay indicates better performance. In this figure, the projected FGA-S model shows effective outcome with minimum delay whereas the compared TRS-PD and ETRS-PD leads to high delay. For instance, under the presence of minimum 5 nodes, the TRS-PD fails to showcase effective results and achieved a maximum average delay of 7.2ms. Subsequently, the ETRS-PD model manages well and offered slightly lower average delay of 4.9ms. However, the projected FGA-S model outperforms these two methods by attaining minimum average delay of 1.8ms. Likewise, under the presence of 15 nodes, the TRS-PD offered ineffective performance and attained a highest average delay of 24.3ms.
Afterwards, the ETRS-PD model tries to perform effectively and offered high delay of 19.9ms. Nevertheless, the projected FGA-S model outperforms these two methods by minimum delay of 13.8ms. Along these lines, under the presence of maximum of 30 nodes, the TRS-PD fails to showcase effective results and achieved a maximum average delay of 39.4ms. Next, the ETRS-PD model showed slightly better results and offered high average delay of 34.4ms. However, the projected FGA-S model outperforms these two methods by attaining least average delay of 24.8ms. From these values, it is also noticed that the average delay gets drastically increased with increasing node count. Fig. 6 shows the investigation of the results obtained by the projected and compared methods in terms of overhead. The technique which incurs less overhead indicates better performance. In this figure, the projected FGA-S model shows effective outcome with minimum overhead whereas the compared TRS-PD and ETRS-PD leads to high overhead.
Fig. 6. Overhead analysis under varying node count
For instance, under the presence of minimum 5 nodes, the TRS-PD fails to showcase effective results and achieved a maximum overhead of 6.9%. Subsequently, the ETRS-PD model manages well and offered slightly lower overhead of 4.7%. However, the projected FGA-S model outperforms these two methods by attaining minimum overhead of 1.5%. Likewise, under the presence of 15 nodes, the TRS-PD offered ineffective performance and attained a highest overhead of 14.3%. Afterwards, the ETRS-PD model tries to perform effectively and offered high overhead of 11.8%. Nevertheless, the projected FGA-S model outperforms these two methods by achieving least overhead of 6.6%. Along these lines, under the presence of maximum of 30 nodes, the TRS-PD fails to showcase effective results and achieved a maximum overhead of 23.1%. Next, the ETRS-PD model showed slightly better results and offered high overhead of 19.9%. However, the projected FGA-S model outperforms these two methods by attaining least overhead of 16.2%. From these values, it is also noticed that the overhead gets drastically increased with increasing node count.
4.3 Results analysis under varying speed rate
Fig. 7 shows the results attained by different techniques interms of throughput under different speed rates. By looking into the figure, it is evident that the FF-AODV exhibits poor performance by attaining least throughput value. Next to that the TRS-PD offered moderate performance by achieving slightly higher throughput value. On all of the above, the presented FGA-S technique showed maximum performance with highest value of throughput.
0 20 40 60
5 15 30 50
A
ver
age
D
el
ay(
m
ill
isec
o
n
d
s)
Number of Nodes
FGA-S
ETRS-PD
TRS-PD
0 10 20 30 40
5 15 30 50
En
erg
y
C
o
n
su
m
p
ti
o
n
(Jo
u
le
s)
Number of Nodes
FGA-S
ETRS-PD
2832 Fig. 7. Throughput analysis under varying speed rate
For instance, under the presence of minimum 2 speed rate, the TRS-PD fails to showcase effective results and achieved a minimum throughput of 42.5kbps. Subsequently, the ETRS-PD model manages well and offered high throughput of 49.1kbps. However, the projected FGA-S model outperforms these two methods by attaining maximum throughput of 54.6kbps. Likewise, under the presence of 5 speed rate, the TRS-PD offered ineffective performance and attained a lowest throughput of 37.8kbps. Afterwards, the ETRS-PD model tries to perform effectively and offered high throughput of 41.6kbps. Nevertheless, the projected FGA-S model outperforms these two methods by achieving highest throughput of 45.2kbps. Along these lines, under the presence of maximum of 10 speed rate, the TRS-PD fails to showcase effective results and achieved a minimum throughput of 22.1kbps. Next, the ETRS-PD model showed slightly better results and offered high throughput of 26.3kbps. However, the projected FGA-S model outperforms these two methods by attaining maximum throughput of 30.2kbps. From these values, it is also noticed that the throughput gets decreased with increasing speed rate. Next, an energy consumption analysis of different techniques is carried out under varying number of nodes and the results are displayed in Fig. 8. The figure clearly demonstrated that minimum amount of energy is utilized by the presented method over the other methods. At the same time, the ETRS-PD model shows slightly higher energy consumption over TRS-PD method but not than projected FGA-S method. It is also noted that maximum amount of energy consumption takes place by TRS-PD method.
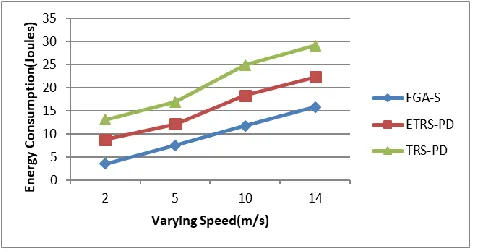
Fig. 8. Energy consumption analysis under varying speed rate
For instance, under the presence of minimum 2 speed rate, the TRS-PD fails to showcase effective results and achieved a maximum energy utilization of 13.1J. Subsequently, the ETRS-PD model manages well and offered slightly lower utilization of
8.8J. However, the projected FGA-S model outperforms these two methods by attaining minimum energy consumption of 3.5J. Likewise, under the presence of 5 speed rate, the TRS-PD offered ineffective performance and attained a highest energy consumption of 16.9J. Afterwards, the ETRS-PD model tries to perform effectively and offered high energy utilization of 12.1J. Nevertheless, the projected FGA-S model outperforms these two methods by achieving highest energy utilization of 7.49J. Along these lines, under the presence of maximum of 10 speed rate, the TRS-PD fails to showcase effective results and achieved a maximum energy consumption of 24.9J. Next, the ETRS-PD model showed slightly better results and offered high energy consumption of 18.3%. However, the projected FGA-S model outperforms these two methods by attaining least energy consumption of 11.7J. From these values, it is also noticed that the energy utilization gets drastically increased with increasing speed rate. Fig. 9 shows the investigation of the results obtained by the projected and compared methods in terms of delay. The technique which incurs less delay indicates better performance. In this figure, the projected FGA-S model shows effective outcome with minimum delay whereas the compared TRS-PD and ETRS-PD leads to high delay.
Fig. 9. Average delay analysis under varying speedrate
For instance, under the presence of minimum 2 speed rate, the TRS-PD fails to showcase effective results and achieved a maximum average delay of 9.7ms. Subsequently, the ETRS-PD model manages well and offered slightly lower average delay of 4.6ms. However, the projected FGA-S model outperforms these two methods by attaining minimum average delay of 1.5ms. Likewise, under the presence of 5 speed rate, the TRS-PD offered ineffective performance and attained a highest average delay of 21.3ms. Afterwards, the ETRS-PD model tries to perform effectively and offered high delay of 16.1ms. Nevertheless, the projected FGA-S model outperforms these two methods by minimum delay of 10.6ms. Along these lines, under the presence of maximum 10 speed rate, the TRS-PD fails to showcase effective results and achieved a maximum average delay of 30.1ms. Next, the ETRS-PD model showed slightly better results and offered high average delay of 25.1ms. However, the projected FGA-S model outperforms these two methods by attaining least average delay of 19.2ms. From these values, it is also noticed that the average delay gets drastically increased with increasing speed rate. Fig. 10 shows the investigation of the results obtained by the projected and compared methods in terms of overhead. The technique which incurs less overhead indicates better performance. In this figure, the projected FGA-S model shows effective outcome with minimum overhead whereas the compared TRS-PD and ETRS-PD leads to high overhead.
0 20 40 60
2 5 10 14
Th
ro
u
gh
p
u
t(
K
b
p
s)
Varying Speed(m/s)
FGA-S
ETRS-PD
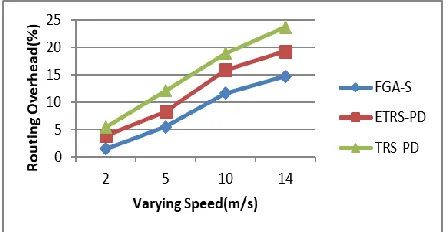
2833 Fig. 10. Overhead analysis under varying speed rate
For instance, under the presence of minimum 2 speed rate, the TRS-PD fails to showcase effective results and achieved a maximum overhead of 5.4%. Subsequently, the ETRS-PD model manages well and offered slightly lower overhead of 3.9%. However, the projected FGA-S model outperforms these two methods by attaining minimum overhead of 1.5%. Likewise, under the presence of 5 speed rate, the TRS-PD offered ineffective performance and attained a highest overhead of 12.1%. Afterwards, the ETRS-PD model tries to perform effectively and offered high overhead of 8.3%. Nevertheless, the projected FGA-S model outperforms these two methods by achieving least overhead of 5.5%. Along these lines, under the presence of maximum of 10 speed rate, the TRS-PD fails to showcase effective results and achieved a maximum overhead of 18.9%. Next, the ETRS-PD model showed slightly better results and offered high overhead of 15.9%. However, the projected FGA-S model outperforms these two methods by attaining least overhead of 11.65%. From these values, it is also noticed that the overhead gets drastically increased with increasing speed rate. The above-mentioned figures clearly verified the supremacy of the presented FGA-S technique over the compared methods.
5
CONCLUSION
This paper has presented a FGA-S model which analyzes the reason for packet loss and notifies the important cause of the loss. For differentiation among a packet drop,it is either because of network status of because of attacks by malicious nodes, a set of parameters namely MAC layer details, queue information, and rate of link modifications are analyzed to look for the actual reason of packet loss. This scheme is extended by the inclusion of the special queue strategy to assign queues based on priority. The experimental outcome of the presented FGA-S algorithm is simulated in NS2. To implement this method, the results are analyzed under varying speed of the nodes between 1 and 10 m/s as well as varying node count of 0-50 nodes. A set of measures used to analyze the results are detection ratio, throughput, delay, energy consumption and overhead. The simulation outcome verified the effectiveness of the presented model under several aspects.
6
REFERENCES
[1] A. Cardenas, N. Benammar, G. Papageorgiou,and J. S. Baras, ―Cross-layered security analysis of wireless ad hoc networks,‖ Technical report, DTIC Document, 2004.
[2] Y. Lu, Y. Zhong, and B. Bhargava, ―Packet loss in mobile ad-hoc networks,‖ Tech. Rep. CSD-TR 03– 009, 2003.
[3] S. Marti, T. J. Giuli, K. Lai, and M. Baker, ―Mitigating routing misbehavior in mobile ad hoc networks,‖ in proceedings of the 6th annual ACM Intl. conference on Mobile computing and networking, 2000.
[4] K. Liu, J. Deng, P. K. Varshney, and K. Balakrishnan, ―An acknowledgment-based approach for the detection of routing misbehavior in MANETs,‖ IEEE Transactions on Mobile Computing, 6(5):536-550, 2007.
[5] T. Sheltami, A. Basabaa, and E. Shakshuki, ―A3acks: adaptive three acknowledgments intrusion detection system for MANETs,‖ Journal of Ambient Intelligence and Humanized Computing, 5(4):611–620, 2014 [6] E. M. Shakshuki, N. Kang, and T. R. Sheltami,
―Eaack— a secure intrusion-detection system for MANETs,‖ IEEE Transactions on Industrial Electronics, 60(3):1089–1098, 2013.
[7] Shebaro, D. Midi, and E. Bertino, ―Fine-grained analysis of packet losses in wireless sensor networks,‖ in 11th IEEE Intl. Conference on Sensing, Communication,and Networking (SECON), 2014. [8] Shabut, K. Dahal, S. Bista, and I. Awan,
―Recommendation based trust model with an effective defence scheme for MANETs,‖ IEEE Transactions on Mobile Computing, 14(10):2101–2115, 2015.
[9] J. Parker, J. Undercoffer, J. Pinkston, and A. Joshi, ―On intrusion detection and response for mobile ad hoc networks,‖ in IEEE Intl. Conference on Performance, Computing, and Communications, 2004.
[10]Khan, M.S., Midi, D., Khan, M.I. and Bertino, E., 2017. Fine-grained analysis of packet loss in MANETs. IEEE Access, 5, pp.7798-7807.
[11]Jhaveri R.H. and Patel N.M, Attack-pattern discovery based enhanced trust model for secure routing in mobile ad-hoc networks. International Journal of
Communication Systems. 2016; DOI:
10.1002/dac.3148.
[12]Jhaveri, R.H. ,Patel N.M and Jinwala D.V,A Composite Trust Model for Secure Routing in Mobile Ad-Hoc Networks, Ad Hoc Networks ,pp 19-45, 2017. [13]S. De Couto, D. Aguayo, J. Bicket, and R. Morris, ―A
high-throughput path metric for multihop wireless routing,‖ Wireless Networks, 11(4):419-434, 2005. [14]JY. Kim, G. S. Tomar, L. Shrivastava, S. S. Bhadauria,
and WH. Lee, ―Load balanced congestion adaptive routing for mobile ad hoc networks,‖ Intl. Journal of Distributed Sensor Networks, (2014):1–10, 2014. [15]P. Samar and S. B. Wicker, ―On the behavior of