Study case Available online www.ijsrr.org ISSN: 2279–0543
International Journal of Scientific Research and Reviews
A Comparative Study of The Effect of Abrasive Wear Rate of the
Material Al-6082 Alloy on Various Loads
VermaDheeraj* and JaiswalRahul
1*
M. Tech, B. Tech, Course Coordinator M. Tech, Maharishi University of Information Technology, Lucknow, India Email: [email protected]
1
M.Tech, B. Tech, Student/Scholar Maharishi University of Information Technology, Lucknow, India Email: [email protected]
ABSTRACT
Wear is a very important factor for various types of application in automobile industries and also in aeronautical industries. Many researches are going on to renovate the wear by either alloying the material or by using composite material. Wear is a surface damage. It may be due to removal of material from the solid surface in sliding, rolling or by impact motion of surface relative to one another. Wear occurs when a mechanical contact take place between surfaces and more specially the removal and disfigurement of material on a surface as a result of mechanical action of opposite surface. The investigation summarized in this thesis present a comparative study on the effect of abrasive wear rate of the material Al-6082 alloy on various load. This investigation was carried out in the laboratory using an experimental set up for inquiring the wear rate of selected material. The experiment for analyzing the wear rate conducted on various load as well as various orientation against grinding disc. Here we perusal a comparative analysis of wear at different orientation against various load for investigating the useful or working life of a component before the expire. A component is unusable when dimensional losses exceed the specified tolerance limits. The abrasive wear behavior of selected material is analyzing at different loads and three different orientations. In the above paper I have analyzed the abrasive wear of selected material, which shows the estimated life of said material
KEYWORDS:
Al-6082, Abrasive Wear, Load, Weight Loss, Orientation*
Corresponding Author:
DheerajVerma
M. Tech, B. Tech, Course Coordinator M. Tech, Maharishi University of Information Technology,
Lucknow, India
INTRODUCTION
Wear is related to interactions between surfaces and more specifically the removal and
deformation of material on a surface as a result of mechanical action of the opposite surface.
Wear may include loss at the inner surfaces between two sliding surfaces. But when a plastic
deformation such as yield stress is omitted from the wear definition if it does not incorporates a
relative sliding motion and contact against another surface despite the possibility for material
removal, because it then lacks the relative sliding action of another surface. Impact wear is a short
sliding motion where two solid surfaces come in contact at an exceptional short time period. When a
fast execution, the contact found in impact wear was directed to as an impulse contact by the
nomenclature.
A friction is generated between moving surfaces relative to each other and friction converts kinetic
energy into heat. Friction is the component of science of tribology.
Some factors affecting wear rate such as Coefficient of friction, Specific energy of material, Material
removal rate. This includes the width of the grinding wheel, Depth of cut, Feed rate of the specimen,
power unit- torque & speed.
OBJECTIVE OF THE STUDY
To analyzing the Maximum and minimum wear rate position by comparing the material loss in
abrasive wear at different load and different orientation for a selected material. This shows the
material life against the selected load.
Aluminum (Al-6082):
By the appropriate treatment, mechanical properties of Al composites can be improved. Gradual
wear occurs in machine element, in result of friction. Therefore, we have to search for the
possibilities to prevent it thus extending the technical and tool life of component.
In present time aluminum alloy based metal matrix has an important role in several engineering
application.
AL-6082 alloy has good formability, excellent mechanical properties and manufacturing
Chemical compositions of the Al-6082 alloy:
Element % Present
Silicon (Si) 0.70-1.30
Magnesium (Mg) 0.60 - 1.20
Manganese (Mn) 0.40 - 1.00
Iron (Fe) 0.0 - 0.50
Chromium (Cr) 0.0 - 0.25
Zinc (Zn) 0.0 - 0.20
Titanium (Ti) 0.0 - 0.10
Copper (Cu) 0.0 - 0.10
Others (Total) 0.0 - 0.15
Aluminum (Al) Balance
Physical Properties of the Al-6082 alloy:
Property Value
Density 2.70 g/cm3
Thermal Expansion 24x10-6
Modulus of Elasticity 70 Gpa
Thermal conductivity 180 W/mK
Electrical Resistivity 0.038x10⁻⁶Ώm
LITERATURE REVIEW
D.Z. Wang, H.X. Peng, J. Liu, C.K. Yaoet. al 1985. In their investigation of wear behavior of al composite that with that increase of normal load and/or speed during dry sliding, the wear
behavior of the SiCw-Al composites transforms from mild wear to severe wear and then to
expropriation. The mild wear is characterized by mild oxidation while the severe wear is
dominated by abrasion or adhesion and delamination.
C.C. Garcia, J. Narciso, E. Louiset. al 1996 – The tribological properties of these materials were determined for different ceramic particle sizes and volume fraction, and the result compared with
those of conventional grey cast iron, a material commonly used in the fabrication of automotive
brake discs.
C. B. Lin, R.J. Chang, W. P. Wenget. al 1998 results showed that tensile properties of these
composites have been reduced. However, the hardness is remaining practically unchanged. In the
wear microstructure of the unreinforced alloy, we can observe the ploughing generated by the
T6 heat-treated condition is better than in the annealed condition or than that of the unreinforced
alloy. The wear weight loss is reduced with increasing content of graphite particulates and sliding
speed.
Y.B. Liu, S.C. Lim, S. Ray, P.K. rohatgiet. al 1997-The wear resistance can be improved by the
addition of graphite, which causes a corresponding reduction in the coefficient of friction,
reaching about half that of the base alloy when the volume fraction of graphite particles reaches
50 vol.%. The reduction in friction and wear of this group of aluminum-graphite composites is a
result of the smearing of the embedded graphite particles during sliding, forming a lubricating
film on both the tribosurface of the composite sample and the steel counter face.
Chandramohan G., et. al Reported that the sliding distance has the highest effect on the dry sliding wear behavior of MMCs than that of the load and sliding speed.
Y. Reda et.al Vol.9, No.1 Studies on Al6061-SiC and Al7075 - Al2O3 Metal Matrix Composites 45 and R. Clark et. al. In their studies on Al7075 reported that, pre-aging at various
retrogression temperatures improves the hardness, tensile properties and electrical resistivity.
Surappaet al 1982. Noted that aluminum reinforced with 5 % alumina possessed an adhesive wear rate comparable to that of Al-11.8Si or AI--S1 hypereutectic alloys. Other work published
by the same workerss4 involving Al, Al-11.8Si, Al-16Si alloys and Al reinforced with A1203p
(5%) indicated that increased silicon content reduced the wear rate.
Hoskingset al.1982 reported a decrease in adhesive wear rate with increasing particle content (at constant particle size) and dimension (at constant volume fraction) for Al 2014 and 2024 alloys
reinforced with Al,O,p and SiCp (1-142 pm) of various weight fractions (2-30 %). SIC was
shown to be more effective than alumina in resisting wear, when tested in a ball-on-disc rig.
These findings were in disagreement with those reported by Surappa.54 However, it should be
noted that the former work involved only a small reinforcement content (5 %).
Abrasive wear:
It occurs when a hard surface moves or slide across a softer surface. Abrasive wear is a
phenomenon of losing of material due to hard particles that forced against and move along a solid
surface.
It is commonly classified on the basis of type of contact and the contact environment. The type of
contact of moving or sliding surface determines the mode of abrasive wear. Two-body wear and
When the grits or hard particles remove material from the opposite surface then it is known as
two-body abrasive wear. In this the common analogy is that the material being removed or
displaced by cutting or plowing operation.
In three-body wear the particles are not constrained. They are free to roll and slide down a
surface.
The contact environment determines, the wear is open or closed. If surfaces are sufficiently
displaced to be independent of one another, then it is an open contact environment.
There are three commonly identified mechanisms of abrasive wear.
1. Plowing
2. Cutting
3. Fragmentation
Plowing-In the grooves formation when the material do not involve direct material removal and
the material is displaced to the side, away from the wear particle. This mechanism is known as
plowing. The displaced material forms ridges adjacent to grooves, which may be removed by
subsequent passage of abrasive particles.
Fragmentation occurs when material is separated from a surface by a cutting process and the
indenting abrasive causes localized fracture of the wear material. These cracks then freely
propagate locally around the wear groove, resulting in additional material removal by spalling.
Abrasive wear can be measured as loss of mass by the Taber Abrasion Test according to ISO
9352 or ASTM D 1044.
EXPERIMENTATION:
In this paper we are going to discuss about the details of material used in the present
investigation and its preparation has been described and the details of the experimental work. This
investigation is consist formation of the L-18 orthogonal array which based on Taguchi design.
Orthogonal array is reduces the total number of experiment. In this experiment total 18 run.
Experimental set up and selection of work piece:
In order to carry out the experimental work the procedure is as follows.
(i) Material Selection
(ii)Wear Behavior
All the investigations for analyzing the abrasive wear rate at different load and orientation, done at
an experimental setup.
Experimental setup consist of – D.C. Motor, Regulator, Flange coupling, Bearing, Frame, Acrylic
Sheet, Grinding Wheel, Shaft, Tachometer, Weighing Machine, Load cell.
Test procedure:
Before the test the weight of the test specimen was taken accurately using an Electronic balance
with an accuracy of 0.001g. The maximum weighing capacity of the electronic balance was 320g.
After a traveling two different times 04, 06 minutes against the grinding disc, the sample was taken
out carefully so that the debris’s were removed from the valleys of the specimen and exact wear
materials can be measured. Once again weight was taken carefully using the above balance and the
difference in weight was noted.This was continued for five times with same specimen and same
position at fix rpm (2000).After that next specimen was taken for next test condition i.e. 0o angle and
5 N applied load and wear test was conducted using same procedure as discussed above and again
the next specimen is taken for next test condition and so on . The cumulative effect of weight loss
was taken for calculating the wear mass and wear rate. A pin on disc wear test technique was
adopted to test the wear behavior of specimens. Wear rate and wear mass were evaluated at 0o
orientation of the specimen. The tests were conducted for three different orientations namely 0o, 30o,
45o. Wear mass of above said specimen was evaluated at three different applied loads i.e. 5 N to 15N
with a variation of 5 N. After the measurement of were mass, a comparative study is done among
different weight loss at different angle against the different load.
Selection of applied load and the position of the specimen:
In this investigation of wear of a selected material against specified load, three loads are selected
5N,10N,15N
For each load the orientation of the specimen was kept at 0o, 30o, 45o respectively.
For each load and orientation the machining time are 4, 6 min.
Taguchi design:
Dr. Genichi Taguchi is regarded as the foremost proponent of robust parameter design.
Dr. Genichitaguchi design an engineering method for product or process design that focuses on
minimizing variation and/or sensitivity to noise. Taguchi designs provide an efficient method for
designing products that operate consistently and optimally over a variety of conditions. Taguchi
These methods used for two, three, four, five, or mixed-level fractional factorial designs. Taguchi
refers to experimental design as "off-line quality control" because it is a method of ensuring good
performance in the design stage of products or processes.
A Taguchi design or an orthogonal array is the method of designing the experimental procedure
using different types of design such as- two, three, four, five, and mixed level. In this study, a three
factor mixed level setup is chosen.In this total eighteen numbers of experiments to be conducted and
hence the L18 was chosen.
Levels of parameters:
Wear Parameter Unit Level
Level 1 Level 2 Level 3
Time Min 4 6
Load N 5 10 15
Orientation Degree 0o 30o 45o
Experiments were conducted according to Taguchi method by using the machining set up. The
control parameters like Load, Orientation, and Time duration of Wear were varied to conduct 18
different experiments and the weights of the work piece before machining is 14.040gm.
Design matrix and Observation table:
Time Load Angle Mean(Average
Weight loss)
4 5 0 0.749
4 5 30 0.697
4 5 45 0.657
4 10 0 0.862
4 10 30 0.801
4 10 45 0.769
4 15 0 0.880
4 15 30 0.833
4 15 45 0.799
6 5 0 1.069
6 5 30 0.987
6 5 45 0.967
6 10 0 1.250
6 10 30 1.151
6 10 45 1.099
6 15 0 1.257
6 15 45 1.129
Influences on weight loss:
The S/N ratios for Mean (Average value) are calculated as given in Equation. This method is used
to analysis the result of response of machining parameter for smaller is better criteria.
Where η - S/N ratios calculated from observed values,
Yi - experimentally observed value of the ith experiment
n =1 repeated number of each experiment.
RESULTS AND DISCUSSION:
Variation of mean of s/n ratio at different load, time, angle:
From observational result the S/N ratio is calculate with the help of Taguchi design method.
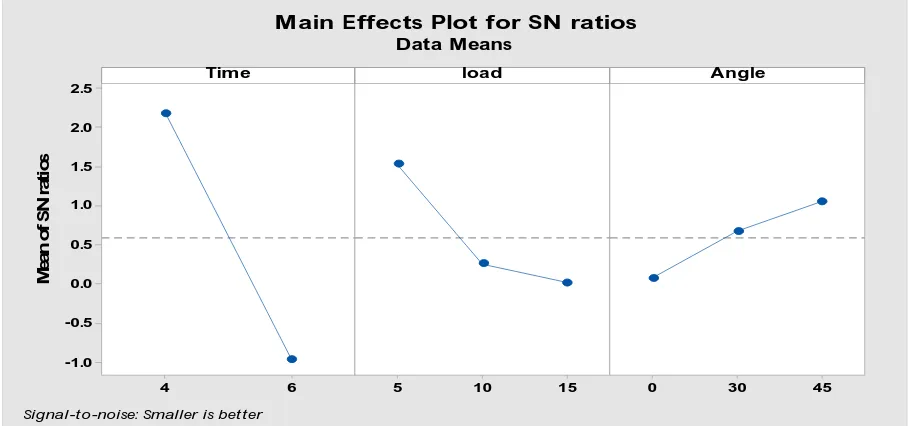
The graph of variation of mean of S/N ratio at different load, angle shows that the mean of S/N ratios
is increase with the increasing the angle.
Mean of S/N ratios is decrease with increasing the loadas shown in the graph of Main effects plot for
SN ratio.
Fig. Variation of mean of SN ratio at different load, time, angle
Variation of mean of weight loss at differentload, angle, time:
6 4
2.5
2.0
1.5
1.0
0.5
0.0
-0.5
-1.0
15 10
5 0 30 45
Time
M
e
a
n
o
f
S
N
r
a
ti
o
s
load Angle
Main Effects Plot for SN ratios
Data Means
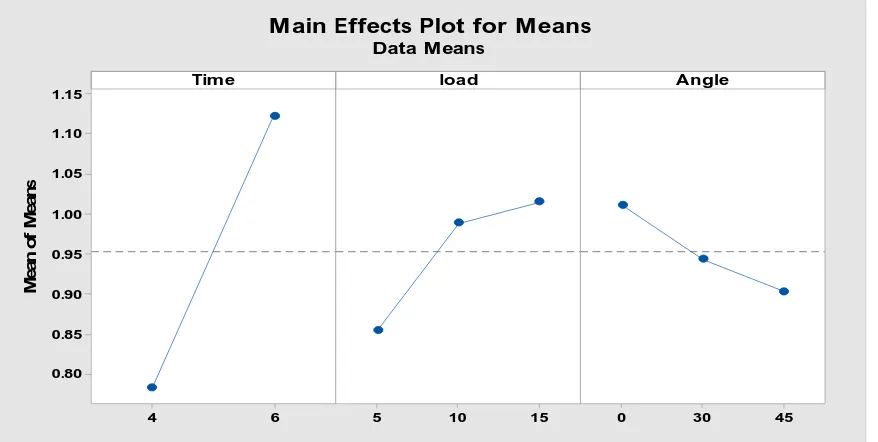
Variation of Mean of weight loss at different load, angle, time
Fig. represents that the wear rate is highly influence by the angle. Weight loss is higher at 0o angle
and decrease with increasing the angle.
Variation of weight loss at 0o angle is higher in both duration of time.
As the load increases the mean of weight loss is increases.
Comparison of abrasive wear rate at different orientation:
When the running time = 4 min:
From the analytical study it is observed that, the orientation of the specimen changes from 0o to 45o, the wear mass (Wt. Loss) decreases from 0.749 gm to 0.657 gm when applied load is
5N.
When the applied load is 10N and 15N, it is observed that wear decreases from 0.864gm to 0.767gm and 0.887gm to .803gm respectively when the orientation changes from 0o to 45o.
When the running time = 6 Min:
From the fig it is observed that, the orientation of the specimen changes from 0o to 45o, the wear mass (Wt. Loss) decreases from 0.1.069 gm to 0.967 gm when applied load is 5N.
From Fig it is observed that the wear mass follows the same pattern as in graph.The wear mass decreases from 1.25 gm to 1.099 gm as the orientation changes from 0o to 45o. From Fig
it is observed that when the wt. loss maximum then orientation is minimum at a given load.
6 4
1.15
1.10
1.05
1.00
0.95
0.90
0.85
0.80
15 10
5 0 30 45
Time
M
e
a
n
o
f
M
e
a
n
s
load Angle
Main Effects Plot for Means
The wear mass decreases from 1.257 gm to1.129 gm as the orientation changes from 0o to 45o.From the analytical study it is observed that when the wt. loss maximum then orientation
is minimum at a given load.
Comparison of abrasive wear rate at different load:
When running time = 4 min:
From the experimental study it is observed that, at a fixed orientation of specimen 0o the wear mass is increases from 0.749gm to 0.880gm as the applied load increases from 5N to 15N.
When the orientation of specimen is fix at 30o then the wear mass increases from 0.697gm to 0.833gm as the load increases from 5N to 15N.
When the orientation of specimen is again fix at 45o then wear mass increases from 0.657gm to 0.799gm as the load on specimen increases from 5N to 15N.
When the running time = 6 Min:
From Fig it is observed that the wear mass increases from 1.069 gm to1.257 gm as the applied load on the specimen increases from 5N to 15N when orientation of the specimen is
0o.
From Fig it is observed that when the load is maximum then wt. loss is maximum and when load is minimum then wt. loss is minimum at a 0 degree of orientation.
From Fig it is observed that the wear mass increases from 0.987 gm to 1.193 gm as the applied load on the specimen increases from 5N to 15N when orientation of the specimen is
30o.
From Fig it is observed that when the load is maximum then wt. loss is maximum and when load is minimum then wt. loss is minimum at a 0 degree of orientation.
From Fig it is observed that the wear mass increases from 0.967 gm to 1.129 gm as the applied load on the specimen increases from 5N to 15N when orientation of the specimen is
45o.
From Fig it is observed that when the load is maximum then wt. loss is maximum and when load is minimum then wt. loss is minimum at a 45 degree of orientation.
CONCLUSION
In the present comparative study of abrasive wear rate at different angle and load for the material
the Load(N), Time(min), angle or orientation. Minitab software is used for analysis the result and
their responses which are based on Taguchi design method.
Taguchi design is used to obtaining the S/N ratio of mean(average) of weight loss with the help of
mini tab. The value of S/N ratio for the mean is calculated under the condition of smaller is better.
Value of S/N ratio is larger when mean is smaller.
The comparison of abrasive wear rate at different angle and different load at running time of 4 Min
and at 6 Min are as follows:
Fig. shows that the wear rate is highly influence by the angle. Weight loss is higher at 0o angle and
decrease with increasing the angle. Weight loss at 0o angle is higher in both duration of time. As
the load increases the mean of weight loss is increases.
The graph of Variation of mean of SN ratio at different load shows that the mean of S/N ratio is
decrease with increasing the load.
The Mean of S/N ratio is increase with increasing the angle. The time verses mean graph shows
that the mean of S/N ratio is higher at the time of 4 min and linearly decreases when the time
increases from 4 to 6 Min.
Maximum wear occur when the test specimen is held at 0o angle for given applied load.
Minimum wear occur when the specimen is held at 45o angle for given applied load.
As the orientation of the specimen changes from 0o to 45o the wear mass decreases from 0.749 gm
to 0.657 gm when applied load is 5N and running time is 4 Min.
When the running time is 6 min, the orientation of the specimen changes from 0o to 45o the wear
mass decreases from 1.069 gm to 0.967 gm when applied load is 5N.
The wear mass decreases from 0.862 gm to 0.769 gm as the orientation changes from 0o to 45o
when applied load is 10N and the running time is 4 min.
When the running time is 6 min the wear mass decreases from 1.250 gm to 1.099 gm as the
orientation changes from 0o to 45o when applied load is 10N
Wear mass decreases from 0.880 gm to 0.799 gm as the orientation of the specimen changes from
0o to 45o when applied loads is15N and running time is 4 min.
When the running time is 6 min, the wear mass decreases from 1.257 gm to 1.129 gm as the
orientation of the specimen changes from 0o to 45o when applied loads is15N
The maximum and minimum wear occurs when the orientation of test specimen changes from 0o to
45o respectively.
REFRENCES:
2. Williams, J. A. "Wear ad wear particles Some fundamentals." Tribology International.2005;
38(10): 863-870.
3. D. Z. Wang, H. X. Peng, J. Liu, C.K. Yao.Wear behavior and micro structural changes of
SiC-Al composite under unlubricated sliding friction. 1985.
4. C.C. Garcia, J. Narciso, E. Louis et. al 1996. Abrasive wear resistance of aluminium
alloy/ceramic particulate composites
5. C. B. Lin, R.J. Chang, W. P. Weng. A study on process and tribological behavior of Al
alloy/Gr (p) composite. 1998.
6. Y.B. Liu, S.C. Lim, S. Ray, P. K. rohatgi. Wear resistance of laser processed Al-Si-graphite
composites. 1997.
7. Bisson, Edmond E. Various Modes of Wear and their Controlling Factors. NASA Technical
Memorendum TM X-52426.1968.
8.Chattopadhyay, R. Surface Wear - Analysis, Treatment, and Prevention. OH, USA:
ASM-International. 2001.
9.Chattopadhyay, R. Advanced Thermally Assisted Surface Engineering Processes. MA, USA:
Kluwer Academic Publishers. 2004.
10.Jones, M., H., and D. Scott, Eds. Industrial Tribology: the practical aspects of friction,
lubrication, and wear. New York, Elsevier Scientific Publishing Company. 1983.
11.Glaeser, W. A., Ed. 1993.
12.Stachowiak, G. W., and A. W. Batchelor. Engineering Tribology. Burlington, Elsevier
Butterworth-Heinemann. 2005.
13.Standard Terminology Relating to Wear and Erosion, Annual Book of Standards, Vol 03.02,
ASTM, 1987; 243-250
14.ASM Handbook Committee. ASM Handbook. Friction, Lubrication and Wear Technology.
U.S.A., ASM International.2002; 18
15.Sinmazcelik, T. and I. Taskiran. "Erosive wear behaviour of polyphenylenesulphide (PPS)
composites." Materials in engineering 2007; 28(9): 2471-2477
16.Sinmazcelik, T. and I. Taskiran. Friction and wear mechanism in nano material. 2005; 21(7):
2133-2137.
17.Bayer, Raymond George. Mechanical wear, press 2004; 112
18.Chang Chongyi Wang Chengguand Jin Ying. Numerical method to predict wheel/rail profile
evolution due to wear. Wear, 2010; 269(3-4); 167-173;
19.Dharma R. Maddala, Arif Mubarok and Rainer J. Hebert. Sliding wear behavior of
20.N R Prabhu Swamy, C S Ramesh and T Chandershekar. Bull. Mater. February 2010;
33(1):49–54. © Indian Academy of Sciences.49 Effect of heat treatment on strength and