45
―COVID-19‖ Forecast Using Time Series
Methods
Milind Talele, Dr. Rajashree Jain
Abstract: The coronavirus ―COVID-19‖ pandemic spreading over the world. This paper presents three time series models, exponential smoothing, Prophet additive forecast and Holts forecast method on understanding predictive patterns from published data on the number of ―COVID-19‖ infected with coronavirus in India. This paper objective to introduce a different effective time series method to predict ―COVID-19‖ forecast. The paper presented ―COVID-19‖ confirmed cases in India till 30 June 2020. The data set used was from the Ministry of Health & Family Welfare and COVID 19india published through kaggle. The simple exponential smoothing model was applied using the Tableau tool. Prophet additive forecast method applied using R language and Holt method used in SPSS tool.
Index Terms: Coronavirus, ―COVID-19‖, Day Level Forecasting, time series algorithms, Exponential Smoothing.
—————————— ——————————
1.
INTRODUCTION
Prediction or forecasting are the terms used to state about what will happen in the future. Different methods are employed in making this statement ―as True as Possible‖ to reality. These methods are derived out of the prior art, knowledge, experiences and methods. These methods are driven by knowledge and/or intuition. Researchers across the globe have developed a number of such models based on various mathematical and statistical theories. ―All models are wrong but few are useful‖ is a quite common statement saying about these models. Yet, there are instances when individuals, communities, nations and governments take solace in such predictions. Sometimes these predictions enable and empower the user with capacities to control the situation. This is very true considering the current ―COVID-19 situation‖. Coronavirus infection (―COVID-19‖) is caused by a newly identified coronavirus. Those who fall sick with ―COVID-19‖ will experience with mild to severe symptoms and can recover from special treatment. Other individuals who come in contact with an infected surface and then touches /her own face, especially nose, eyes and mouth have a very high probability of getting infected. A Public Health Emergency of International Concern was announced by the ―World Health Organization‖ (WHO) on 30 January 2020 and an outbreak by the virus was named as ―COVID-19‖ on 11 February 2020.[1] In response to this pandemic, there are various collaborative efforts taking place to limit the scope and spread of this disease outbreak. From limited economic activities to call for stay home, from making work from home a norm to providing shelter to homeless during these hard times, Governments are making all efforts to manage the pandemic. On the other hand there are a number of experts who are engaged in creating solutions in the form of vaccines, technology support and building models of prediction to help the local government. It is important for experts to respond with estimation of possible impact of the epidemic. The number of confirmed cases, recovered cases and the patter with which the disease spread and other related information will help the stakeholders to take informed decisions. [2]
Authors of the present paper attempted to use the secondary data of ―COVID-19‖, to predict the cases. The paper is outline as follows. Section 2 covers the literature review of the possible methods that are used for prediction. Section 3 talks about the methodology the paper has employed. Section 4 lists the findings and results and lastly Section 5 provided concluding remarks of the paper.
2
LITERATURE
REVIEW
Pandemic spread has recurred very regularly on this planet. Records of such information as old as from the 3000 Century BC [3] are available in the literature. During times of health emergencies, it becomes imperative to study the spread, the preventive measures, and the future actions. Every time during such pandemics, researchers and experts have come forward to provide various solutions to tackle such a situation, ―COVID-19‖ pandemic is no exception for the same. Expert studies during the pandemic varies and is multidisciplinary. From the cause to mitigate effects and prevent/protect the future, researchers across the globe have put in their efforts to guide the stakeholders. The current situation has added one more dimension to this and that is ‗the world is a connected place now‘ and hence the dimension is Data. The internet and its connectivity has enabled individuals with access to huge amounts of data. The data generated, till date records the number of people infected, recovered and died. This nature and sequence of such collected data helps in building robust models to predict the spread of the pandemic in future.[4] Statistical methods like time series analysis and mathematical models with least error and better fit have been reported in the literature. Benzekry et al used different mathematical methods to describe and predict tumor growth despite its internal complexities. Authors of this paper used a three stage strategy of measurement of error, goodness of fit and the model‘s ability to forecast future tumor growth. They used a number of models yet the prediction rate remained less than 70%. [5] A tripod strategy is used where groups created models for specific management of the situation working independently. In the second stage modeling of the models takes place through discussions and comparisons. The groups worked independently to refine from the insights of stage two. In the last stage an overall projection for each management strategy evolves to help and mitigate the risks. [6] Lixiang et al predicted important factors affecting the spread of ―COVID-19‖, such as the number of basic regenerations by Gaussian distribution with the standard deviation of 1.5. Model shows 11 ————————————————
●Milind Talele , Symbiosis Centre for Research and Innovation, Symbiosis International Deemed University, India
E-mail: [email protected]
46 days from the initial incubation of infection but not all 11 days
of incubation for infected symptoms but simulation indicate average numbers of infection to 8 days. [7] Roda et al have used AIC (Akaike Information Criterion) for model selection to show comparison between SEIR(Susceptible Exposed Infectious Recovered) and SIR(Susceptible Infected Recovered) models. Their results of SIR modeling were better than SEIR. [8] Pourhomayoun et al have used Artificial Intelligence (AI) based Machine Learning (ML) for forecasting and results demonstrating 93% overall accuracy in predicting the mortality rate due to ―COVID-19‖. They used machine learning algorithm to predict the mortality rate in infected people with ―COVID-19‖. [9] Perc et al have predicted the ―COVID-19‖ spread for four countries, Iran, USA, Germany and Slovenia for a period of two weeks. Keeping the alarming numbers in mind authors have recommended maintaining an average growth rate less than 5 % should be an important target. [10] An interactive dashboard was released by Dong E, Du H, and Gardner L in February 2020 for ―COVID-19‖ predictions. The dashboard was aligned to the data set by Chinese and WHO reports and is available as a shared repository. [11], [12] . However, the current paper presents predictions of ―COVID-19‖ confirmed cases. An attempt of using different forecasting methods like simple exponential smoothing with additive trend was planned, Prophet additive forecast and Holts methods. The details of the methods used are provided in Section 3.
3 METHODOLOGY
Due to the development of technologies like internet and information communication technologies, accessing ―COVID-19‖ data has become simpler. The data is suitable for time series analysis. An exponential function assigned with decreasing weights over time can be applied to time series data. The present paper makes use of exponential smoothing from time series family [13], [14]. This time series method shown good forecast accuracy over various other forecasting methods [15], [16]. It is exclusively suitable for short period of dataset. Exponential smoothing method will capture a different trends and seasonal forecast patterns like additive, multiplicative or both pattern. In exponential smoothing, latest observations are given high weight than previous observations. This models consider the changing trend, seasonality of the data and calculate future forecast value. Exponential smoothing method create future value considering weighted averages of earlier values. This forecast method is considered as exponential because the value at each date is influenced by previous actual value which is exponentially decreasing and latest values assigned as greater weight. As the more data points in the time series will result into accurate forecast results. In Exponential smoothing, weight assigned to lag values is exponentially decline. Latest period assigned the higher weight than the previous time period. It uses a linear combination of past values. There are three types of smoothing methods based on the trend, seasonality and number of smoothing factors. Basic, Double, Triple exponential smoothing which has smoothing factor alpha, beta, gamma with variation in the equation with respect to smoothing factor. The present paper adapted the basic exponential smoothing and used the model as presented in Equ. 1.
( ) (1)
Wherein
Α → 0 < α ≤ 1
is smoothing constant. Its value in the rage of 0 to 1.
When → zero, smoothing happens very slowly. When = 0 then current smoothed point set to the previous smoothed value.
When = 1 then current smoothed point set to the current point.
t = Time period, t > 0
= Forecast of previous date = Actual cases of previous date
= Forecast for current date
Additive component is present and being added to the other components to create the complete forecast value. [17]. The forecast error ( ) is difference between current value and forecast of current period predicted at last period. (Eq.3). The forecast error calculation provides a quantitative measure of the forecast quality.
(2)
MAE
𝑛 ∑| |
(3)
𝑀𝐴 𝐸 𝑀𝐴𝐸 𝑀𝐴𝐸
(4)
Wherein [18]
= Forecast predicted at previous day = Actual confirmed cases
= Forecast error
𝑛 = Number of period
MAE = Mean Absolute error using exponential smoothing
𝑀𝐴𝐸 = Mean absolute error of Naive forecast
MASE (Mean Absolute Scaled Error) measure accuracy of forecasts with help of calculated MAE. It is the division of MAE of the forecast and MAE of the naive forecast value.
3.1 Dataset
Statistical data published by Ministry of Health & Family Welfare and covid19india, is taken from kaggle [15]. Data is published in csv file format and it has columns for confirmed cases, recovered cases and death cases for each state and date started from 30-Jan-20, it was the first day of the publication in India. This dataset has 106 days statistics for confirmed, recovered and death cases and data is published daily hence by the time paper publishes the days in the dataset will be increased.
3.2 Tableau
47 The results obtained under two sections i.e., ―COVID-19‖
prediction Model for India and the model accuracy. These are presented in the section 4.
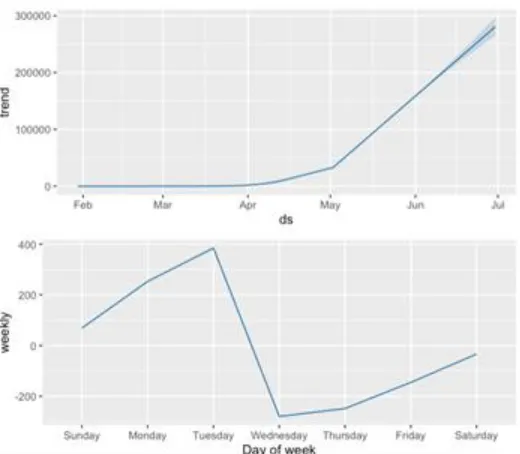
3.3 Prophet R-Language Library Prophet
Prophet analytics R language library used to predict the forecast. Underlying implementation of model is in the library. [23] Prophet is mostly used to shift the trend and handle outliner in time series. Prophet is used in many Facebook applications to predict future values. It is used to find yearly, monthly, weekly, daily seasonality and non-linear trend fits with additive method.[24] Accuracy of model represented by R-squared and p-Value value.
4
“COVID-19”
FORECAST
Using different tools and time series methods we generated the prediction as per the following objectives
1. Estimate the ―COVID-19‖ Confirmed cases for India and using different model
2. Describe the model accuracy
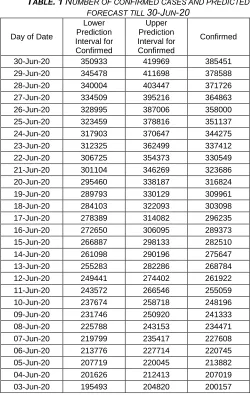
4.1 Estimate the “COVID-19” Confirmed Cases for India and using Simple Exponential Smoothing
Forecast is generated till 30-Jun-20 days using Tableau time series method. Tableau Desktop 2020.2 version is used to generate forecast and graphs.
TABLE.1NUMBER OF CONFIRMED CASES AND PREDICTED
FORECAST TILL 30-JUN-20
Day of Date
Lower Prediction Interval for Confirmed
Upper Prediction Interval for Confirmed
Confirmed
30-Jun-20 350933 419969 385451
29-Jun-20 345478 411698 378588
28-Jun-20 340004 403447 371726
27-Jun-20 334509 395216 364863
26-Jun-20 328995 387006 358000
25-Jun-20 323459 378816 351137
24-Jun-20 317903 370647 344275
23-Jun-20 312325 362499 337412
22-Jun-20 306725 354373 330549
21-Jun-20 301104 346269 323686
20-Jun-20 295460 338187 316824
19-Jun-20 289793 330129 309961
18-Jun-20 284103 322093 303098
17-Jun-20 278389 314082 296235
16-Jun-20 272650 306095 289373
15-Jun-20 266887 298133 282510
14-Jun-20 261098 290196 275647
13-Jun-20 255283 282286 268784
12-Jun-20 249441 274402 261922
11-Jun-20 243572 266546 255059
10-Jun-20 237674 258718 248196
09-Jun-20 231746 250920 241333
08-Jun-20 225788 243153 234471
07-Jun-20 219799 235417 227608
06-Jun-20 213776 227714 220745
05-Jun-20 207719 220045 213882
04-Jun-20 201626 212413 207019
03-Jun-20 195493 204820 200157
02-Jun-20 189319 197268 193294
01-Jun-20 183100 189762 186431
31-May-20 176831 182306 179568
30-May-20 170504 174908 172706
29-May-20 164107 167579 165843
28-May-20 157625 160335 158980
27-May-20 151033 153202 152117
Table 1 shows ―COVID-19‖ Forecast from 27-May-20 till 30-Jun-20 for India, it shows upper and lower range predicted by model. Considering the capacity to tackle such a level of pandemic the Government of India was into Lockdown of the country and measures like stay home, maintain social distancing etc. The results are imperative and hence India‘s "COVID-19‖ spread to reach 200000 might need more than 135 days. Table 2 tabulates the number of days required to reach milestones. [12]
TABLE.2“COVID-19” CONFIRMED CASES IN FIVE COUNTRIES
Name of
country | Number of Days to reach confirmed ―COVID-19‖ cases
Number → 10000 50000 100000 150000
USA 58 63 66 114
Spain 46 55 61 76
India 75 98 118 126
South Korea 72
Not Reached
yet
Not Reached yet
Not Reached
yet
Italy 40 51 60 77
Fig. 1 shows a forecast for 35 days on the number of ―COVID-19‖ confirmed cases. No data point is ignored for previous period data while forecast prediction. The nature of virus spread brings the estimates to the higher side. Fig. 2. Shows different country confirmed cases to support table 2.
48
Figure 2. “COVID-19” confirmed cases in five countries.
Model Accuracy
Quality metrics measure how good the model is to match with the future Data Generation process. Tableau select the best model out of eight to generate forecast with minimum error [20]. Forecast confidence interval used was 95%. Exponential smoothing method use weighted average of previous period to calculate forecast figure. Exponential Smoothing method calculate the smoothed value from a weighted average of the previous value. [21]. The method is exponential because the value of each level is compared with previous actual value with exponentially decreasing grade and most recent values allocate with greater weight. The model accuracy is evaluated based on various levels of errors the model has generated. For example, value of MASE. This has properties which are favorable to the time series data that was used to predict ―COVID-19‖ confirmed cases. Therefore, the present paper monitored the value of MASE for the following four predict done on Table 3 describes the value of this error captured at four different instances, on the Tableau model.
TABLE.3MASE MEASURED AT DIFFERENT INSTANCES OF MODEL
Model Milestone Dates Mean Absolute Scaled Error(MASE)
Model at 26-May-20 0.24
Model at 16-May-20 0.24
Model at 9-May-20 0.3
Model at 30-April-20 0.3
Model at 16-Apr-20 0.45
It was observed that model accuracy would be better when prediction was run with more than 101 data points. Alpha value is 0.50 which is in between 0.0 to 1.0 range. Model drawn on 16-May-20 and 26-May-20 has same MASE value indicate stable model.
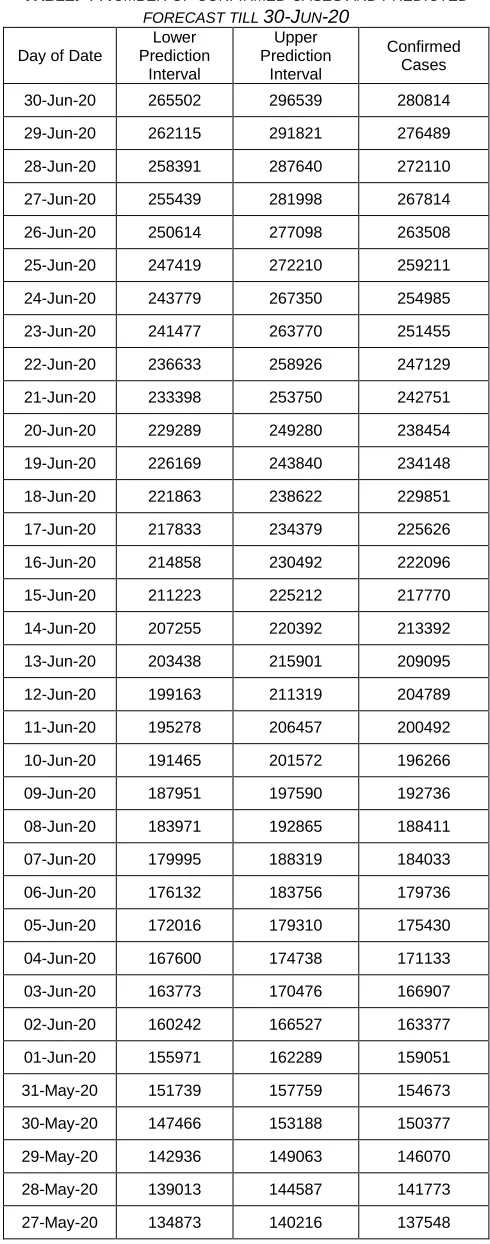
4.2 Estimate the “COVID-19” Confirmed Cases for India and using Prophet R-Language library
Forecast is generated till 30-Jun-20 days using Prophet library for time series additive method. R Studio is used to generate forecast and graphs.
TABLE.4NUMBER OF CONFIRMED CASES AND PREDICTED
FORECAST TILL 30-JUN-20
Day of Date
Lower Prediction
Interval
Upper Prediction
Interval
Confirmed Cases
30-Jun-20 265502 296539 280814 29-Jun-20 262115 291821 276489
28-Jun-20 258391 287640 272110
27-Jun-20 255439 281998 267814
26-Jun-20 250614 277098 263508 25-Jun-20 247419 272210 259211
24-Jun-20 243779 267350 254985
23-Jun-20 241477 263770 251455
22-Jun-20 236633 258926 247129 21-Jun-20 233398 253750 242751
20-Jun-20 229289 249280 238454
19-Jun-20 226169 243840 234148
18-Jun-20 221863 238622 229851 17-Jun-20 217833 234379 225626
16-Jun-20 214858 230492 222096
15-Jun-20 211223 225212 217770
14-Jun-20 207255 220392 213392 13-Jun-20 203438 215901 209095
12-Jun-20 199163 211319 204789
11-Jun-20 195278 206457 200492
10-Jun-20 191465 201572 196266 09-Jun-20 187951 197590 192736
08-Jun-20 183971 192865 188411
07-Jun-20 179995 188319 184033
06-Jun-20 176132 183756 179736 05-Jun-20 172016 179310 175430
04-Jun-20 167600 174738 171133
03-Jun-20 163773 170476 166907
02-Jun-20 160242 166527 163377 01-Jun-20 155971 162289 159051
31-May-20 151739 157759 154673
30-May-20 147466 153188 150377
29-May-20 142936 149063 146070 28-May-20 139013 144587 141773
27-May-20 134873 140216 137548
Fig. 3 shows 35 days of forecast created till 30-Jun-20.
49
Figure 3. Predicted forecast using R Prophet library from 26-May-20 till 30-Jun-20
Model Accuracy
Forecast accuracy of model represented by R-squared value and p-Value of model. R-squared: 0.9962, p-value: < 0.00000000000000022, degrees of freedom :116.
Fig. 4 shows actuals vs forecast values and represent that predicted value are slightly over and under estimated than actuals but still close to linear line with high accuracy.
Figure 4. Actual cases vs Predicted for confirmed cases using Prophet library
4.2 Estimate the “COVID-19” Confirmed Cases for India and using Holt/ double exponential smoothing method in SPSS
We have used same dataset in SPSS to predict forecast with time series Holts method and Table 4 represent forecast value.
TABLE.4NUMBER OF CONFIRMED CASES AND PREDICTED
FORECAST TILL 30-JUN-20
Day of Date
Lower Prediction
Interval
Upper Prediction
Interval
Confirmed Cases 30-Jun-20 330028 432890 381459 29-Jun-20 325445 423990 374717 28-Jun-20 320830 415121 367976
27-Jun-20 316183 406284 361234 26-Jun-20 311505 397479 354492 25-Jun-20 306794 388707 347751 24-Jun-20 302050 379967 341009 23-Jun-20 297273 371262 334267 22-Jun-20 292461 362590 327525 21-Jun-20 287615 353953 320784 20-Jun-20 282733 345351 314042 19-Jun-20 277815 336786 307300 18-Jun-20 272860 328258 300559 17-Jun-20 267867 319767 293817 16-Jun-20 262836 311314 287075 15-Jun-20 257766 302901 280334 14-Jun-20 252655 294529 273592 13-Jun-20 247503 286197 266850 12-Jun-20 242309 277908 260109 11-Jun-20 237071 269663 253367 10-Jun-20 231788 261463 246625 09-Jun-20 226458 253309 239884 08-Jun-20 221081 245203 233142 07-Jun-20 215654 237147 226400 06-Jun-20 210175 229142 219658 05-Jun-20 204641 221192 212917 04-Jun-20 199052 213298 206175 03-Jun-20 193402 205464 199433 02-Jun-20 187690 197694 192692 01-Jun-20 181909 189991 185950 31-May-20 176055 182361 179208 30-May-20 170120 174813 172467 29-May-20 164092 167358 165725 28-May-20 157948 160018 158983 27-May-20 151640 152843 152242
Fig. 5 represent predicted and confirmed cases. X axis denote weeks and days. Red color line represents actual and blue color for forecast
Figure 5. Predicted forecast using time series Holt method from 26-May-20 till 30-Jun-20
Model Accuracy
R-squared value :1.0 with 95 % confidence internal. R square value represent the perfect fit model.
TABLE.5SUMMARY OF THREE MODEL FORECAST TILL 30-JUN-20
Day of Date Prophet library Model
Simple Exponential
Smoothing
50
30-Jun-20 280814 385451 381459
29-Jun-20 276489 378588 374717
28-Jun-20 272110 371726 367976
27-Jun-20 267814 364863 361234
26-Jun-20 263508 358000 354492
25-Jun-20 259211 351137 347751
24-Jun-20 254985 344275 341009
23-Jun-20 251455 337412 334267
22-Jun-20 247129 330549 327525
21-Jun-20 242751 323686 320784
20-Jun-20 238454 316824 314042
19-Jun-20 234148 309961 307300
18-Jun-20 229851 303098 300559
17-Jun-20 225626 296235 293817
16-Jun-20 222096 289373 287075
15-Jun-20 217770 282510 280334
14-Jun-20 213392 275647 273592
13-Jun-20 209095 268784 266850
12-Jun-20 204789 261922 260109
11-Jun-20 200492 255059 253367
10-Jun-20 196266 248196 246625
09-Jun-20 192736 241333 239884
08-Jun-20 188411 234471 233142
07-Jun-20 184033 227608 226400
06-Jun-20 179736 220745 219658
05-Jun-20 175430 213882 212917
04-Jun-20 171133 207019 206175
03-Jun-20 166907 200157 199433
02-Jun-20 163377 193294 192692
01-Jun-20 159051 186431 185950
31-May-20 154673 179568 179208
30-May-20 150377 172706 172467
29-May-20 146070 165843 165725
28-May-20 141773 158980 158983
27-May-20 137548 152117 152242
5
CONCLUSION
The paper presented ―COVID-19‖ confirmed cases in India till 31 June 2020. We believe that forecast is important factor while taking decision for the Government and private sectors. In this Analysis, we have used three time series model with assumption that the published data is accurate. The data set used from the Ministry of Health & Family Welfare and COVID 19india published through kaggle. The exponential smoothing
model was applied using the Tableau tool. Exponential smoothing model accuracy was about 70%.
REFERENCES
[1] World Health Organization, 2020;
https://www.who.int/emergencies/diseases/novel- coronavirus-2019w.who.int/emergencies/diseases/novel-coronavirus-2019Who.int. 2020. Coronavirus. [online]
Available at:
<https://www.who.int/emergencies/diseases/novel-coronavirus-2019> [Accessed 13 May 2020]
[2] Penn State. (2020, May 7). Which COVID-19 models should we use to make policy decisions?. ScienceDaily.
Retrieved May 11, 2020 from
www.sciencedaily.com/releases/2020/05/200507143011.h tm
[3] G. Wainer, C. R. Martin, and H. Khalil, ―Coronavirus: How new simulations can predict the spread of future pandemics,‖ The Conversation, 07-May-2020. [Online]. Available: https://theconversation.com/coronavirus-how-
new-simulations-can-predict-the-spread-of-future-pandemics-134217. [Accessed: 15-May-2020].
[4] ―Modelers Struggle to Predict the Future of the COVID-19 Pandemic,‖ the-scientist.com, 13-Mar-2020.
[5] Benzekry, S., Lamont, C., Beheshti, A., Tracz, A., Ebos, J. M., Hlatky, L., & Hahnfeldt, P. (2014). Classical mathematical models for description and prediction of experimental tumor growth. PLoS computational biology,
10(8), e1003800.
https://doi.org/10.1371/journal.pcbi.10038000
[6] ―Which COVID-19 models should we use to make policy decisions?,‖ ScienceDaily, 07-May-2020. [Online]. Available:
http://www.sciencedaily.com/releases/2020/05/200507143 011.htm. [Accessed: 15-May-2020].
[7] L. Li, Z. Yang, Z. Dang, C. Meng, J. Huang, H. Meng, D. Wang, G. Chen, J. Zhang, H. Peng, and Y. Shao, ―Propagation analysis and prediction of the COVID-19,‖ Infectious Disease Modelling, vol. 5, pp. 282–292, Mar. 2020
[8] W. C. Roda, M. B. Varughese, D. Han, and M. Y. Li, ―Why is it difficult to accurately predict the COVID-19 epidemic?,‖ Infectious Disease Modelling, vol. 5, pp. 271– 281, 2020.
[9] Pourhomayoun, Mohammad & Shakibi, Mahdi. (2020). Predicting Mortality Risk in Patients with COVID-19 Using Artificial Intelligence to Help Medical Decision-Making. 10.1101/2020.03.30.20047308.
[10] G. Miksić, Nina, Mitja, Andraž, and Perc, ―Forecasting COVID-19,‖ Frontiers, 01-Apr-2020. [Online]. Available: https://www.frontiersin.org/articles/10.3389/fphy.2020.001 27/full. [Accessed: 15-May-2020].
[11] Dong E, Du H, Gardner L. An interactive web-based dashboard to track COVID-19 in real time. Lancet Infect Dis. (2020). doi: 10.1016/S1473-3099(20)30120-1. [Epub ahead of print].
[12] FCSSEGISandData, ―CSSEGISandData/COVID-19,‖ GitHub, 16-May-2020. [Online]. Available: https://github.com/CSSEGISandData/COVID-19.
[Accessed: 17-May-2020].
51 using exponential smoothing methods,‖ International
Journal of Forecasting, vol. 18, no. 3, pp. 439–454, 2002. [14] J. W. Taylor, ―Exponential smoothing with a damped
multiplicative trend,‖ International Journal of Forecasting, vol. 19, no. 4, pp. 715–725, 2003.
[15] Srk, ―COVID-19 in India,‖ Kaggle, 14-May-2020. [Online]. Available:
https://www.kaggle.com/sudalairajkumar/covid19-in-india. [Accessed: 15-May-2020].
[16] Petropoulos F, Makridakis S (2020) Forecasting the novel coronavirus COVID-19. PLoS ONE 15(3): e0231236. https://doi.org/10.1371/journal.pone.0231236
[17] ―Exponential smoothing,‖ Wikipedia, 02-May-2020.
[Online]. Available:
https://en.wikipedia.org/wiki/Exponential_smoothing. [Accessed: 17-May-2020].
[18] ‖NCSS Statistical Software," NCSS Statistical Software, 08 05 2020. [Online]. Available: https://ncss-
wpengine.netdna-ssl.com/wp-content/themes/ncss/pdf/Procedures/NCSS/Exponential_ Smoothing-Horizontal.pdf. [Accessed 08-May-2020]. [19] ―Tableau: Business Intelligence and Analytics Software,‖
Tableau Software. [Online]. Available: https://www.tableau.com/. [Accessed: 15-May-2020]. [20] Tableau, "How forcasting work in tableau," tabeau, 08 05
2020. [Online]. Available:
https://help.tableau.com/current/pro/desktop/en-us/forecast_how_it_works.htm accessed. [Accessed 05 2020].
[21] ―Exponential smoothing,‖ Wikipedia, 02-May-2020.
[Online]. Available:
https://en.wikipedia.org/wiki/Exponential_smoothing. [Accessed: 17-May-2020].
[22] Circulars for Covid-19: Ministry of Home Affairs,‖ Ministry of Home Affairs | GoI. [Online]. Available: https://www.mha.gov.in/notifications/circulars-covid-19. [Accessed: 15-May-2020].
[23] S. J. Taylor and B. J. Letham, ―Forecasting at scale,‖ the Journal of Life and Environmental Sciences, pp. 1–25, Sep. 2017.