C om p u tation al techniques for th e
stu d y o f en zym e active sites
A ndrew C am pbell W allace
A thesis su b m itted to th e U niversity of London
in the Faculty of Science
for th e degree of D octor of Philosophy
November 1996
Biom olecular S tru c tu re & M odelling U nit,
D ep a rtm en t of B iochem istry & M olecular Biology,
U niversity College,
Gower S treet,
ProQ uest Number: 10017772
All rights reserved
INFORMATION TO ALL U SE R S
The quality of this reproduction is d ep en d en t upon the quality of the copy subm itted. In the unlikely even t that the author did not sen d a com plete manuscript
and there are m issing p a g e s, th e se will be noted. Also, if material had to be rem oved, a note will indicate the deletion.
uest.
ProQ uest 10017772
Published by ProQ uest LLC(2016). Copyright of the Dissertation is held by the Author. All rights reserved.
This work is protected against unauthorized copying under Title 17, United S ta tes C ode. Microform Edition © ProQ uest LLC.
ProQ uest LLC
789 East E isenhow er Parkway P.O. Box 1346
A b s tr a c t
T he aim of this thesis, which is based on the coordinate data from known X-ray crystal and nuclear m agnetic resonance (n m r) structures, is to further our understanding of the ways in which enzym es catalyse their reactions.
M any enzyme structures are solved w ith inhibitors or su b strate analogs bound
to th eir active sites. To enable evaluation of the protein-ligand interactions th a t
occur in these complexes, a com putational tool called LIGPLOT has been devel oped which allows swift pictorial evaluation of th e ligand and its interactions w ith
the enzyme. These LIGPLOT diagram s, along w ith other relevent inform ation has been compiled into an enzyme database th a t is available over the World W ide
Web.
The rest of the thesis is devoted to studying stru ctu ral organisation of the
amino acid residues th a t are directly involved in chemical catalysis. A detailed
analysis of the geom etry of the Ser-H is-A sp catalytic triad found in th e serine
proteinases and lipase X-ray and NMR structures showed th a t it is possible to
define a 3D consensus tem plate th a t identifies all catalytic Ser-H is-A sp triads
w ith th e exclusion of all other interactions. To create 3D consensus tem plates
describing other enzyme active sites we needed a generalised search m ethod. To
do this, a com puter program called ’t e s s’ has been developed which is based on
the geom etric hashing paradigm . Using this program , a database of enzym e active
site tem plates has been created which enables swift evaluation of the function of
a new protein stru ctu re as it is solved and aid protein design and engineering
A cknow ledgm ents
I would especially like th ank my supervisor Jan et M. Thornton for her help and
encouragem ent over th e last three years. Also to Rom an Laskowski for repeatedly
rescuing me from my confusion (especially over John M itchell’s jokes) and the
m yriad of m istakes I ’ve m anaged on the com puter front. Thanks also to my
industrial supervisor, Neera Borkakoti.
Also, all those people who have helped in various ways along the way: Alex
PRV Michie, Tezza Attw ood, Malcolm M cA rthur, Andrew M artin, David Jones, Frances Richardson, C hristine Orengo, M artin Jones, Tim Slidel and apologies to
th e ones I’ve forgotten. T he pub philosophers: M ark M cA lister, Lorraine Finney,
B ernard O ’Hara, Tony Guzzler Headley. Also David Moynagh for helping with
th e crossword puzzles.
C ontents
I n tr o d u c tio n 22
1 . 1 A brief history of enzyme re s e a rc h ... 23
1.2 The role of stru ctu ral biology in understanding enzym e action . . 24
1.2.1 X -ray diffraction m e t h o d s ... 24
1.2.2 Case study: the serine proteinases and acetylcholinesterase 27 1.2.3 Classification of e n z y m e s ... 30
1.2.4 Enzym e structures in the P D B... 30
1.3 O rganisation of this t h e s i s ... 37
1.4 R e fe re n c e s ... 38
LIGPLOT: a p ro g ra m to g e n e r a te sc h e m a tic d ia g ra m s o f p r o t e in -lig a n d in te r a c tio n s 43 2.1 In tr o d u c tio n ... 43
2.2 The algorithm - an o v e rv ie w ... 44
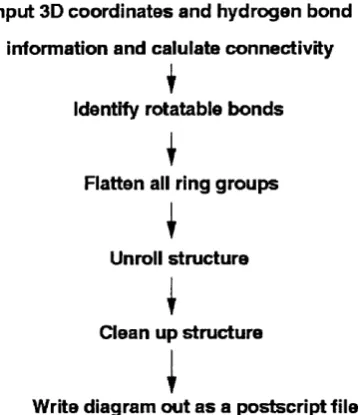
2.3 Details of the algorithm ... 46
2.3.1 Coordinates, hydrogen bonds and c o n n e c tiv ity ... 46
2.3.2 Identification of bonds for rotation ... 50
2.3.3 Flattening of ring g r o u p s ... 53
2.3.4 Unrolling the s t r u c t u r e ... 54
2.3.5 M inim isation of atom and bond o v e rla p ... 56
2.3.6 Plot p a r a m e te r s ... 59
2.3.7 Placem ent of atom and residue n a m e s ... 60
2.3.8 Schem atic peptide d i a g r a m s ... 61
2.3.9 Interactive modification of the diagram s ... 61
2.4 E x a m p l e s ... 62
2.5 R e fe re n c e s ... 6 8 A s tr u c tu r a l co m p a r iso n o f th e S e r -H is-A sp c a ta ly tic tr ia d s in th e serin e p r o te in a se s and lip a se s 70 3.1 In tr o d u c tio n ... 70
3.2 M e th o d s ... 79
3.2.1 The datasets ... 79
3.2.2 E xtraction of catalytic triads ... 8 6 3.3 R e s u lts ... 90
3.3.2 Position of the oxygens in the catalytic t r i a d ... 104
3.3.3 Tem plate search through the Enzym e D a t a s e t ...108
3.3.4 Tem plate search through P D B ... I l l 3.3.5 O ther catalytic t r i a d s ...119
3.4 C o n clu sio n ... 119
3.5 R e fe re n c e s ...120
4 TESS: a n a lg o r ith m fo r a u to m a ti c a lly d e r iv in g 3d t e m p l a t e s fo r e n z y m e a c tiv e s ite s 130 4.1 I n tr o d u c tio n ...130
4.2 M ethod ... 134
4.2.1 Stage 1 ... 136
4.2.2 Stage 2 ... 138
4.3 Perform ance of the TESS a l g o r i t h m ... 142
4.3.1 O ptim ising th e box size ... 144
4.3.2 The ru n -tim e of TESS ...145
4.3.3 Memory usage and the TESS t a b l e s ...150
4.3.4 C reating a mean 3d consensus t e m p l a t e ...151
4.4 D is c u s s io n ...153
4.5 R e fe re n c e s ...154
5 T h e c a t a l y t i c t r i a d 159 5.1 I n tr o d u c tio n ... 159
5.2 T he Nu:-His-ELEC catalytic t r i a d ... 160
5.3 class 2: The Ser-H is-G lu catalytic triad ...160
5.4 class 3: The A sp-H is-A sp catalytic t r i a d ...164
5.4.1 class 4: The C ys-H is-A sn catalytic t r i a d ...167
5.5 Com parison of th e 4 Nu;-His-ELEC catalytic triads ...171
5.5.1 class 1-2-3 tem p late search through th e P D B ...177
5.5.2 nitrogenase m olybdenum -iron protein E.C. 1.18.6.1 . . . . 177
5.5.3 pyruvate oxidase E.C. 1.2. 3 . 3 ... 182
5.5.4 m a c r o m o m y c in ... 184
5.5.5 protein R2 of ribonucleotide reductase E .C .1.17.4.1 . . . . 186
5.5.6 superoxide dism utase E .C .1 .1 5 .1 .1 ... 188
5.5.7 D -glyceralydehyde-3-phosphate dehydrogenase E .C .1.2.1.12 190 5.6 T he Ser-His p a i r ... 192
5.7 C o n c lu sio n ...194
5.8 R e fe re n c e s ...194
6 C a t a l y t i c re s id u e s a n d lig a n d b in d in g s ite s 199 6.1 I n tr o d u c tio n ... 199
6.1.1 Identification of ligands bound in active s i t e ... 201
6.1.2 M ethod to com pare ligand binding site conform ation . . . 201
6.1.5 C o n clu sio n ...209
6.2 R e fe re n c e s ...209
7 T h e role o f H is in m e ta l b in d in g s ite s 212 7.1 In tr o d u c tio n ... 212
7.2 M etal binding sites in the P D B ...216
7.3 T he stru ctu re of m etal-H is interactions in the P D B ...224
7.4 The stru ctu ral heterogeneity of th e metal-His-ELEC t r i a d ... 230
7.4.1 Zn-H is in te r a c tio n s ... 231
7.4.2 Fe-His in te r a c t i o n s ... 233
7.4.3 C u-H is in te ra c tio n s ... 238
7.5 Com parison of the Nu:-His-ELEC and m etal-His-ELEC triads . . . 240
7.6 C o n c lu sio n ...244
7.7 R e fe re n c e s ... 245
8 C r e a tin g a d a ta b a se o f 3D e n z y m e a c tiv e s ite te m p la te s 253 8.1 I n tr o d u c tio n ... 253
8.2 Defining 3D tem plates a u t o m a t i c a l l y ... 254
8.2 . 1 A utom atically identifying catalytic residues ... 254
8.2.2 Identifying the atom s of th e catalytic residues involved in c a t a ly s is ... 258
8.3 Ribonuclease ...258
8.3.1 Ribonuclease A ...259
8.3.2 Ribonuclease T%...269
8.3.3 Com parison of ribonuclease A and T% active sites ...276
8.3.4 Ribonuclease H ...276
8.3.5 B a r n a s e ... 278
8.4 L y s o z y m e ... 281
8.4.1 Eukaryotic: M am m alian and avian ly s o z y m e ... 282
8.4.2 Prokaryotic: B acteriophage t4 ly s o z y m e ...288
8.4.3 Comparison of prokaryotic and eukaryotic lysozymes . . . 289
8.4.4 Tem plate search through th e P D B ... 289
8.5 Is the conform ation of catalytic residues unique to enzym e active s i t e s ? ...291
8 . 6 C o n c lu sio n ... 295
8.7 R e fe re n c e s ... 296
List o f Figures
1 .1 A diagram m atic representation of th e active site of the serine proteinase chym otrypsin taken from the X -ray stru ctu re of chy- m otrypsin (Harel et al.^ 1 9 9 1 ) ... 29 1 . 2 A histogram of the num ber of structures for each of the 6 E.C.
num bers. T he bars in grey are the to tal num ber of structures {i.e
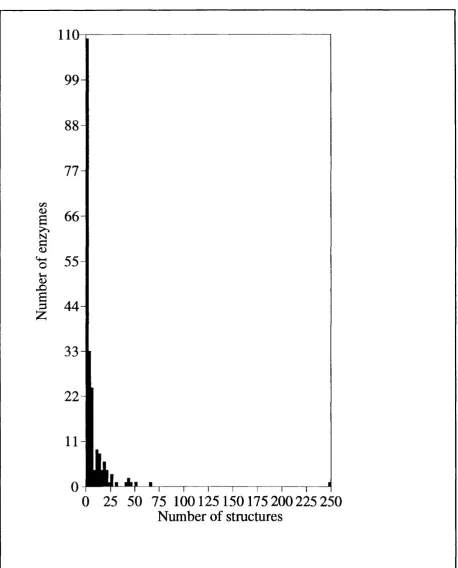
935 for the E .C .3) whereas th e black bars give the to tal num ber of unique enzym es... 35 1.3 A histogram giving the to ta l num ber of structures for each of the
214 unique enzymes in the Janu ary 1995 release of th e PDB. . . . 36 2.1 Flow diagram illustrating th e m ain stages in the LIGPLOT algorithm . 47 2.2 An exam ple of how a ligand is converted from its startin g 3D struc
tu re to a 2D LIGPLOT representation of its interactions. The ligand shown here is Gly-Ala-Trp, complexed w ith "/-chymotrypsin (PDB
code 8gch). This is the sam e stru ctu re as in Figure 2.3, but here only th e hydrogen-bonded groups from th e protein are included. The bold lines represent th e ligand’s bonds, the thin lines represent the bonds in th e sidechains of th e protein, while the dashed lines correspond to the hydrogen bonds. The four stages shown are: a.
sim ple orthographic projection of the startin g 3D structure; b. after the flattening of all rings and th e unrolling of the entire stru ctu re onto a 2D plane, but w ith a considerable am ount of atom-clashes and bond-overlaps to be got rid of; c. explosion of th e hydrogen- bonded groups away from th e ligand to ease m inim isation of atom - and bond-overlaps (in fact, for clarity, the groups shown here have been exploded out to only a q u arter of th eir usual distance); and
2.3 A LIGPLOT diagram of the active site of chym otrypsin (PDB code 8gch) complexed with the trip ep tid e G ly -A la-T rp (residues 250- 252, chain C). The bold bonds belong to the ligand, the thin bonds belong to th e hydrogen-bonded residues from th e protein, and the dashed lines represent th e hydrogen bonds between ligand and pro tein. Hydrophobic contacts m ade w ith th e protein are indicated by th e spoked arcs pointing towards the ligand. C orresponding spokes on the ligand atom s indicate which atom s are involved in these contacts. Similarly, the atom s in the hydrogen-bonded groups in volved in hydrophobic contacts are m arked by spokes pointing in th e direction of the contact atom s. For exam ple, th e C and CA atom s of th e hydrogen-bonded group Gly 216 are involved in hy drophobic interactions with Trp 252 on the ligand. T he letters in parentheses in th e residue nam es are th e corresponding chain iden tifiers. T he diagram illustrates the catalytic triad of His 57, Asp 102 and Ser 195, as well as showing the ligand’s Trp 252 residue nestling in the highly hydrophobic specificity pocket in the active site of the enzym e... 52 2.4 The different rotations applied when different num bers of atom s are
bonded to a given rotatable bond. The left-hand pictures show the ‘before’ states for th e three different situations depicted, while the right-hand pictures show how the atom s are transform ed into the
x-y plane in each case. The shaded atom s belong to the ro tatable bond, lying along th e z-axis, w ith the atom of interest at th e origin. T he three cases illustrated are; a. when one atom is attach ed to th e ro tatab le bond the rotation applied brings th e atom into the
x-y plane, either clockwise or anti-clockwise, keeping the angle
a fixed; b. with two atom s attached, the rotation m aintains the angle placing th e atom s in th e x-y plane such th a t the angle p
is bisected by the a:-axis; c. w ith three atom s attach ed no a tte m p t is m ade to retain any angles - the three atom s are placed at right- angles to one another in the x-y p lane... 55 2.5 A LIGPLOT diagram of phospholipase A2 (PDB code Ipoe) bound
to the transition state inhibitor (residue Gel 935). T he shading behind each of the ligand atom s gives a m easure of their accessi bility, w ith th e darker th e shade th e more buried and inaccessible th e atom . The key illustrates the m eaning of the various symbols in the diagram ; fu rth er description is given in the legend to Figure
10
2.6 A LIGPLOT diagram of a SH2 dom ain-peptide complex (PDB code Islia, ligand residues 201-205 of chain B). T he pep tid e is a phos- photyrosine, w ith the phosphorylated tyrosine shown at the top of th e picture w ith its network of hydrogen bonds to th e residues of th e SH2 dom ain of the v-src oncogene product (W aksman et a i,
1992). The accessibility shading shows th e phosphate and three of its oxygens as being buried while the rem ainder of th e peptide is largely exposed, making contact w ith the SH2 dom ain only at certain positions along its len g th... 65 2.7 An exam ple of a ‘schem atic p e p tid e ’ LIGPLOT diagram . The
molecule shown is the Fab’B 1312-m yohaem erythrin complex (PDB
code 2igf) which is an antibody-peptide complex (Stanfield et a/., 1990) - ligand residues 69-75, chain P. Each pep tid e residue is shown by a circle at the position, and only those sidechains which are involved in hydrogen bonds are depicted. The dia gram corresponds closely to Fig. 16 of Zvelebil and Thornton (1993) which was drawn by hand, whereas here it has been produced au tom atically by LIGPLOT, directly from the PDB coordinates. . . . 67 3.1 Schem atic diagram of the tri-p e p tid e G ly-A la-T rp (residues 250-
252 C) bound to the active site of chym otrypsin, Sgch (Harel et al,
1991), showing th e hydrogen bonds and hydrophobic interactions th e trip ep tid e makes with th e residues of th e active site. The diagram illustrates the catalytic triad of His 57, Asp 102 and Ser 195, as well as the ligand’s Trp 252 residue nestling in the enzym e’s hydrophobic specificity pocket... 74 3.2 Schem atic diagram representing the generalised catalytic m echa
nism of serine proteases and lipases. M is a nitrogen atom for proteases (am ide bond) or an oxygen atom for the lipases (ester bond). I m is th e imidazole si dechain of th e His residue, a. The reaction proceeds by the His deprotonating the catalytic Ser 0"^. This Ser 0 ^ acts as a nucleophile, attacking th e carbonyl group of th e scissile bond. 6. The first tetrah ed ral interm ediate is formed, c. This rapidly breaks down to form the activated energy acyl- enzym e interm ediate, releasing an am ine in th e serine proteases or an alcohol in the lipases, d. The interm ediate is then hydrolysed by a w ater molecule, e. The second tetrah ed ral interm ediate is formed. / . This then breaks down to form p ro d u c t... 75 3.3 MOLSCRIPT (Kraulis, 1991) diagram of Group 1 proteins: T he
^-sandwich stru ctu re of chym otrypsin, Icho (Fujinaga et a i, 1987). 82 3.4 MOLSCRIPT (Kraulis, 1991) diagram Group 2 proteins: the
doubly-w ound a / f d stru ctu re of subtilisin IsOl (Pantoliano et al,
1989)... 83 3.5 MOLSCRIPT (K raulis, 1991) diagram of Group 3: The a //? struc
11
3.6 MOLSCRIPT (Kraulis, 1991) diagram of G roup 4: The ajjS struc tu re of lipase Atgl (Derewenda et al, 1992)... 85 3.7 A flow diagram showing the m ain steps involved in the calculation
of th e 3D tem p late tria d ... 8 8 3.8 Conform ations of representative catalytic triads from each of the
4 fold groups: chym otrypsin Icho (Fujinaga et a i, 1987), subtilsin
2sic (Takenchi et al., 1991), serine-type carboxypeptidase 3sc2 (Liao et al, 1992) and lipase Itah (Noble et a i, 1993), showing the different conform ations adopted by th e Ser and Asp sidechains. The triads have all been superim posed on th eir histidine residue. D iagram s produced using R aster3d (Bacon and Anderson, 1988; M erritt and Murphy, 1 9 9 4 )... 91 3.9 T he cataly tic triad of elastase Aest (Takahashi et al., 1989) and its
inhibitor, a modified tri-p ep tid e. T he diagram shows the hydrogen bond interaction of Asp 0^^ with His and Ser O7 w ith In addition, th e Ser O7 is hydrogen bonded to th e m ainchain of the peptide inhibitor and this would be near the site of cleavage in th e actual substrate. Ser 214 is found in a stru cturally conserved position in fold Group 1 enzymes. The figure also shows the n o n - cataly tic Asp oxygen hydrogen bonding to th e backbone of His
5 7 ... 94
3.10 A superposition of three catalytic triads from enzymes in fold G roup 1, each from a different subgroup: Group la chym otrypsin
(\cho, Fujinaga et a i, 1987), Group 16 a -ly tic protease (1/pr Bone
et al., 1991a) and Group Ic lysyl endopeptidase, l a r6 (Tsunasaw a S. et a i, 1989). These 3 enzymes have less th an 30% sequence identity b u t their structures are highly sim ilar and this is reflected in the sim ilarity in the conform ation of th eir Ser-H is-A sp catalytic tria d s ... 95 3.11 A superposition of three catalytic triads from enzymes in fold
G roup 2, each corresponding to a different E.C. num ber: subtil isin 2sic (Takeuchi et a i, 1991), E .C .3.4.21.62, endopeptidase K
2pkc (B ajo rath et a i, 1989), E .C .3.4.21.64 and therm itase I th m
(Teplyakov et al., 1990) E .C .3.4.21. 6 6... 96 3.12 A modified d i-p ep tid e from l e s t (Li De La et al., 1990) th a t binds
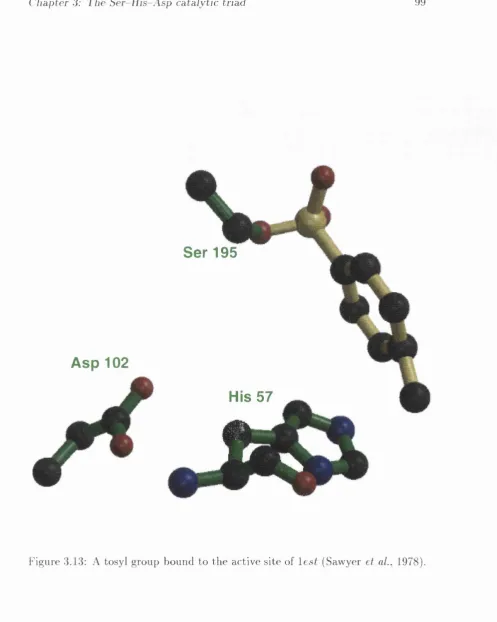
adjacent, and not parallel, to th e catalytic His ring {cf. Figure 3.9), p ertu rb in g the catalytic Ser out of its usual p o s itio n ... 98 3.13 A tosyl group bound to th e active site of le s t (Sawyer et al., 1978). 99 3.14 7 -su b stitu te d 3-alkoxy-4-chloroisocoum ucarin inhibitor bound to
12
3.15 The Ser 221-His 64-Asp 32 catalytic triad , plus inhibitor and the Ser 125 residue th a t is found in a stru ctu rally conserved position in the active site of subtilisin. The la tte r residue is analogous to the Ser 214 residue of th e Group 1 enzymes in th a t it plays a functional role in hydrogen bonding to and orientating the catalytic triad residues even though it hydrogen bonds to different atom s. . 1 0 2 3.16 Comparison of the catalytic triad of horse lipase Ihpl (Bourne et
al., 1993) and bacterial lipase 3tgl (B rady et a i, 1990; Noble et a i,
1991)showing the unusual position of the Asp in th e form er triad. One of the Asp carboxyl oxygen atom s from this triad is still in a position to hydrogen bond to the His rin g ...105 3.17 A box-plot showing the m ean positions of the Ser and th e Asp
carboxyl oxygen atom for each of th e 4 fold groups. These atom s all converge at favourable hydrogen bonding positions relative to the nitrogens of the His ring...107 3.18 A histogram of the rrns distance of th e Ser 0'^ and Asp carboxyl
oxygen atom from the overall mean consensus tem p late position for all Ser, His and Asp associations in the enzym e dataset. This histogram shows how the m ajority of catalytic triads, in black, are w ithin 2.0Â of the consensus tem p late and can be separated from th e u o n -cataly tic interactions. The catalytic triads th a t lie beyond this cut-off (in white) are those whose conform ation has been p ertu rb ed by the binding of an inhibitor. In addition, the triads at rrnsd 2-5.5Â in the histogram represent stru ctu rally con served n o n -cataly tic triads th a t play a role in hydrogen bonding to and orientating the catalytic tria d s... 109 3.19 Histogram showing the r m s deviation from the ’functional’ con
sensus tem plate of all Ser-H is-A sp interactions extracted from a dataset of non-homologous proteins. The serine proteinases in the protein dataset are shown in black and these are clearly separated from th e other, n o n -cataly tic associations. There are, however, two proteins th a t are not serine proteinases, cyclophilin and im m unoglobulin, shown in white, th a t appear to have a Ser-H is-A sp triad in the catalytic conform ation...113 3.20 A MOLSCRIPT diagram of cyclophilin A in which His 126, shown
in green bonds, is thought to be involved in th e peptidyl-prolyl
cis-trans isomerase activity. Also shown is the Ser 99-His 92-Asp 123 triad (red bonds) th a t m ay enable cylcophilin A to exhibit protease activity... 114 3.21 The Ser-H is-A sp triplet from cyclophilin A th a t adopts a catalytic
triad conform ation yet is not known to be catalytically active. The ’c a ta ly tic ’ Ser 0 ^ has the sidechain of Phe 113 lying directly below
it, m aking the binding of a su b strate sterically unfavourable. . . . 115 3.22 Ser-His-Asp triad found in th e immunoglobulin molecule G-1 {‘2ig2,
13
3.23 A MOLSCRIPT diagram of the intact im m unoglobulin fragm ent with th e position of the ’cataly tic’ triad also shown. T he triad lies a t the C -term inus of th e molecule whereas the hapten binding site is at the N -term inus... 118
4.1 A summ ary of the process involved when TESS searches through a dataset of PDB structures for a user defined 3D tem p la te...135 4.2 A flow diagram showing the steps required in producing a TESS ta
ble in th e Preprocessing stage. The exam ple given is for generation of tem plates involving His sidechains. This process is repeated for each of the proteins in th e PDB which results in a TESS table for th e His reference residue... 137 4.3 A diagram illustrating th e comparison process th a t occurs when a
3D query tem p late is parsed against th e TESS ta b le ...143 4.4 A plot of run tim e in CPU seconds against number of hits showing
the run tim e of TESS is near to Oh, where h is the number of hits 148 4.5 A plot of ru n -tim e in CPU seconds against num ber of tem p late
ato m s...149 4.6 A diagram illustrating th e sim ilarity in the 3D consensus tem plates
produced in the TESSPLATE (red) and m ethod of C hapter 3 (Wal lace et ai, 1996) (blue)... 152 5.1 A 3D representation of th e Ser-H is-G lu catalytic triads from
acetylcholinesterase lace (Sussman et al., 1991) in green and tria- cylglycerol lipase I tr h (Grochulski et al., 1993) in re d ...162 5.2 A 3D representation of the active site of haloalkane dehalogenase,
2dhc (Verschueren et a i, 1993). The His 289-Asp 260 residues hydrogen bond to each other and constitute the acid /b ase catalyst. Asp 124 is the nucleophilic group and attacks th e C l of the 1 , 2 dichloroethane substrate, forming th e acy 1-enzyme interm ediate. . 165 5.3 A LIGPLOT diagram representing the acyl-enzym e interm ediate of
haloalkane dehalogenase 2dhd (Verschueren et al., 1993) formed after th e nucleophilic Asp 124 attacks th e 1,2 dichloroethane sub stra te. A w ater molecule would attack this interm ediate, forming th e prim ary alcohol p ro d u c t... 166 5.4 A 3D representation of the C ys-H is-A sn catalytic triads from
14
5.5 A comparison of the catalytic triads from chym otrypsin Icho (Fu jinaga et al.^ 1987), haloalkane dehalogenase 2dhc (Verschueren et a i, 1993) and acetylcholinesterase la ce (Sussman et a i, 1991). All the triad s His residues have been superim posed allowing us to com pare th e relative conformations of the nucleophilic and electrostatic sidechains... 172 5.6 A histogram of num ber of hits against r m s distance from the
class 1-2-3 tem p late for all the 95% non-identical PDB structures present in classes 1, 2 and 3...174 5.7 A 3D representation of the m ean position of the functional atom s
w ith respect to th e His sidechain for classes 1 to 4... 176 5.8 Histogram of num ber of hits against r m s deviation when th e 95%
by sequence non-identical PDB dataset was searched using th e class 1-2-3 consensus tem plate. There are some triads th a t are not m em bers of th e enzym e datasets of classes 1, 2 or 3 b u t fit the criteria necessary to be a potential catalytic tria d ... 178 5.9 A view of th e positional relationship of th e P-cluster, th e A sp-H is-
Asp triad and the MoFe cofactor associated with th e nitrogenase enzym e (Jongsun et al., 1992)... 181 5.10 A 3D representation of a monom er of th e enzym e pyruvate oxidase,
Ipox (M uller et a i, 1994). The positions of th e A sp-H is-A sp triad and th e cofactor thiam ine pyrophosphate ( tp p ) are also shown. . 183 5.11 A 3D representation of the m acrom om ycin apoprotein which has a
seven-stranded /^-barrel and two antiparallel /?-sheet ribbons (Van Roey &: Beer m an, 1989). T he positions of the A sp-H is-A sp triad (red bonds) is also shown. The 2-m eth y l-2 ,4 -p en tan ed io l ligands in the crystal stru ctu re are the binding sites of chromophores in v iv o...185 5.12 A view of the Asp 84-His 118-Asp 237 triad (green bonds) lo
cated in ribonuclease reductase (N ordlund & Ekland, 1993). The iron center (red bonds) oxidises T yr 122 (yellow bonds) which is essential for catalytic activity of the enzym e... 187 5.13 A 3D representation of the Asp 124-His 71-Asp 83 triad found in
superoxide dism utase (Parge et a i, 1992). The triad residues are shaded in re d ...189 5.14 A 3D representation of the Asp 47-H is 50-Asp 312 triad
(red bonds) located in glyceraldehyde-3-phosphate dehydrogenase (B uehner et a i, 1974). Also shown are th e two catalytic residues of Cys 149 and His 176 (black bonds) and the NADH coenzyme. . 191 5.15 A 3D diagram showing the distribution of catalytic (blue) and
n o n -cataly tic (red) Ser 0 ^ atom s w ith respect to th e His sidechain found in th e 95% by sequence non-identical protein dataset. . . . 193
6.1 A 3D representation of the catalytic triads of the
15
6.2 A 3D representation showing the d istribution of ligands around the Ser-H is-A sp consensus tem plate for th e try p sin -lik e proteinases. The grid-like contours in blue represent th e ligands from those structures whose triads are more th an 1.4Â from th e consensus tem p late whereas the solid contours are ligands from triads whose
rm.s deviation is less than 1.4Â from th e consensus tem p late , . . 203 6.3 A 3D representation of the position of th e inhibitors relative to the
sidechain consensus tem plates for th e subtilisin-like proteinases.
The inhibitors were extracted from structures whose triads had an
rm s less than 1.4Â from the Nu:-His-ELEC consensus tem plate. . 205 6.4 A 3D representation of the position of th e inhibitors relative to the
sidechain consensus tem plates of serine-type carboxypeptidase and lipase...206 6.5 A 3D representation of the of the position of th e inhibitors relative
to the sidechain consensus tem plates for haloalkane dehalogenase and acetylcholinesterase (Sussman ei a/., 1991)... 208 6 . 6 A 3D representation of the distribution of the ligands from the
serine proteinases, lipases and cv//3-hydrolase fold enzymes with respect to the Asp and His sidechain and th e Nu: a to m ... 210 7.1 The two possible tautom eric forms of the m etal-His-ELEC triad.
The triad with green bonds is taken from the catalytic centre of therm olysin, I t m n (Monzingo & M atthew s, 1984); here th e His
interacts with the Zn m etal (tau to m er e). T he other triad in red bonds originates from Cu, Zn-superoxide dism utase 2sod
(Tainer et a/., 1982) and here the Zn m etal interacts w ith the
(tau to m er ^ )... 215
7.2 T h e m eth o d used to extract th e m etal-H is-E L E C triads from the PDB...217 7.3 A diagram showing the distribution of the m etal and ELEC atom s
around th e His sidechain for both tau to m er 5 and e... 227 7.4 A histogram of the num ber of hits against distance of th e m etal
from th e sidechain N atom for both tautom ers 5 and t... 228 7.5 A histogram of the num ber of hits against distance of the m etal
from th e sidechain N atom for both tautom ers 5 and e... 229 7.6 A schem atic view of the active site of carbonic anhydrase (Eriksson
et a/., 1986), showing the m ain catalytic residues and th e zinc coordinated to 3 His residues... 232 7.7 A representation of the active sites of the m etalloproteinase th er
molysin I t m n (Monzingo & M atthew s, 1 9 8 4 )... 234 7.8 A diagram of the active site of hem erythrin (Stenkam p et a/., 1985).
The Gin 59 (which is hydrogen bonded to His 77 in the
16
7.9 A diagram m atic representation of th e diferric centre of the oxygen binding protein ribonuclease reductase subunit R2 (Rosenzweig et a/., 1 9 9 3 )... 237 7.10 A representation of the active site Cu and Zn m etals from super
oxide dism utase, lco6 (Djinovic et a i, 1992) ... 239 7.11 A diagram m atic representation of the type III Cu centre taken
from the hem ocyanin structure Ih c l (Volbeda & Hoi, 1989) . . . . 241
7.12 A 3 d representation o f th e consensus tem p la tes o f th e c a ta ly tic tri ads o f ty p e m etal-H is-E L E C and Nu:-His-ELEC for th e tau tom ers 6 (b o tto m ) and e (to p ). M etal atom s are black; ELEC group for th e m etal-H is-E L E C triad are green; ELEC group for th e Nu:-His-ELEC triad are blue; red atom s are Nu: groups... 243
8 . 1 A 3D representation of the active site of ribonuclease A complexed w ith d ( c p a ) (Zegers et al., 1994). The catalytic residues are His
119, His 12 and Lys 4 1 ... 260 8.2 A 3D representation of the distribution of th e His 119 a ctiv e
site atom conform ations A and B for all the RNase A and RNase S
structures in th e PDB. A lso shown is the sid echain o f His 12 and
the distribution of the Lys 41 N"' ato m s...263 8.3 A histogram of the num ber of hits against r m s distance from the
B conformation of the RNase A consensus tem plate. It shows th a t the A and B conformations of the His 119 residues are in distinct positions...264
8.4 A histogram of th e num ber of hits against r m s distance when the A conformation of the RNase A consensus tem p late was searched through th e 95% by sequence non-identical protein dataset. . . . 266
8.5 A histogram of th e num ber of hits against I'ms distance when the B conformation of the RNase A consensus tem p late was searched through the 95% by sequence non-identical protein dataset. . . . 266
8.6 A 3d representation of the active site of RUBISCO (Lundqvist & Schneider, 1991) showing the 3 residues His 285, His 321 and Lys
191 (red bonds) th a t have the same conformation as the active site residues of ribonuclease A...268 8.7 A 3D representation of th e a ctiv e site residues o f RNase T% (K oepke
et ai, 1989) w ith th e inhibitor g u a n y ly l-2 ’5 ’-g u a n o s in e ...270
8 . 8 A 3D representation of the plant seed protein narbonin In a r (Hen ni g et ai, 1992; Hennig et al., 1995). Also shown are th e Glu 132, His 133 and His 234 residues which adopt a sim ilar conform ation
to th e ca ta ly tic residues found in ribonuclease T%...273
17
8.10 A diagram showing the relative conformations of the consensus tem plate atom s of RNase A, Ti. The residues and atom s of the tem plates have been superimposed according to their proposed chem ical role in the catalytic m echanism... 277 8.11 A diagram showing the distribution of all the barnase Glu 73
residues w ith respect to the His 102 residue for barnase. The I6se Glu 73 residues (green bonds) all originate from structures th a t have th e n atu ral barnase inhibitor b arstar bound to their active site. T he Iban Glu 73 structures have no inhibitors in th eir active sites... 280 8.12 A diagram of the NAG-NAM substrate of lysozym e; 6 sugars fit into
th e binding sites A-F. Cleavage is between subsites D and E . . . 282 8.13 A 3D diagram showing the relative orientation of the catalytic
residues Glu 1 1 and Asp 20 w ith respect to a su b strate analogue bound to th e active site of 148/ (Kuroki et a/., 1993). The bond cleaved would be at the N2 atom shown in the diagram ...283 8.14 T he relative conformations of th e eukaryotic lysozyme catalytic
residues Asp 52 and Glu 35. They are divided into two m ain groups, avian and m am m alian. In all cases the Glu residues have been superim posed so the relative conform ation of the Asp can be com pared... 284 8.15 T he two Asp 52 conformations with respect to the catalytic Glu
35 found for hen lysozyme. Tem plate A is th a t in Table 8.10 while tem p late B was derived from the structures of D iam ond et al. (1975).287 8.16 A 3D representation com paring the active site geom etry of the
catalytic residues from prokaryotic t4 lysozyme and eukaryotic lysozymes. T he Glu residues of the two consensus tem plates have been superim posed allowing comparison of th e catalytic Asp residues. 290 8.17 Histogram s of the num ber of hits versus r m s deviation from the
respective tem plates when 4 Ser-H is-A sp triads are used to search through the 95% by sequence non-hom ologous dataset. The 1/pr triad is the catalytic consensus tem p late for the serine proteinases and lipases. The other 3 are random ly chosen n o n -cataly tic triads. 292 8.18 H istogram s of the num ber of hits versus r m s deviation from the
List o f Tables
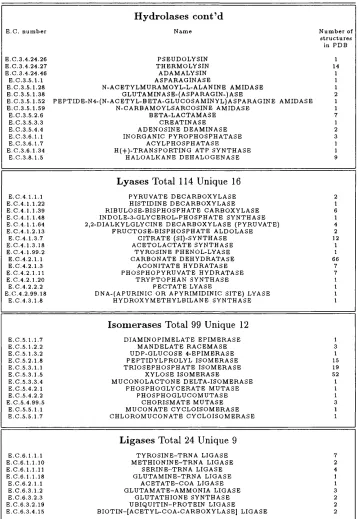
1 . 1 A list of all th e enzymes present in th e January 1995 release of the
PDB. At the top of each class are the to tal num ber of structures and th e num ber of unique enzymes within th a t class... 34
3.1 D ataset of enzymes containing th e Ser-H is-A sp catalytic triad . . . 81 3.2 N on-identical dataset of enzym e and non-enzym e proteins, where
no two proteins have a sequence identity greater th an 95%... 87 3.3 Comparison of the consensus triad tem p late derived for each fold
group individually and also combined to give the m ean triad. R m s
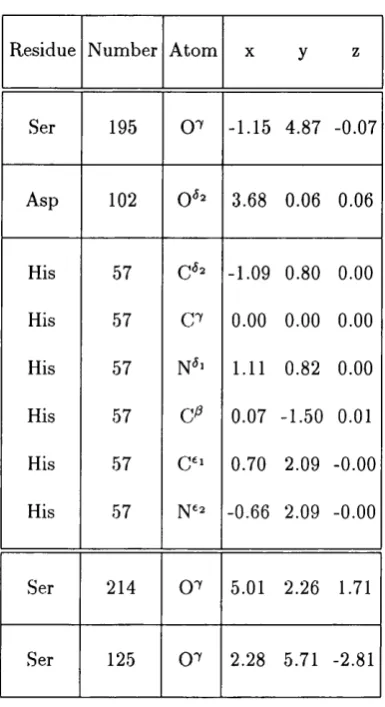
distances are given for each fold group triad against all others for all sidechain atom s of the catalytic Asp and Ser and ’functional’ atom s Asp 0 ^ ’ and Ser 0 ^ . ’N um ber chains’ are the total num ber of chains in the enzyme dataset. ’N um ber catalytic tria d s’ is the num ber of catalytic triads identified in the enzym e d ataset The discrepancy between num ber of chains and num ber of triads is ex plained in the tex t. ’Combined te m p la te ’ are the m ean coordinates of th e four stru ctu ral group triads. ’Mean r m s deviation of group’ is th e mean rm s deviation of each of the sub-group m em bers from th eir respective m ean catalytic tria d s... 92 3.4 C oordinates of the ’functional oxygens’ and histidine sidechain of
th e consensus tem p late triad. The m ean position of the Ser 214 0 ^ atom from stru ctu ral group 1 and Ser 125 0 ^ from stru ctu ral group 2 is also given... 97
4.1 Sidechain atom s used to define the reference fram es for each stan dard am ino-acid, as defined by Singh & T hornton (1992). The atom s in column 2 are transform ed to the origin w ith th e atom s in column 1 and 3 either side of the positive x direction... 137 4.2 Search param eter num bers placed in the atom num ber column of
th e query PDB form at file. One of these num bers is placed against each of the atom s in th e query tem plate. This defines which atom types are to be searched for at the corresponding atom position. To search for different residue types at a given atom point requires the one letter code of th a t am ino acid to be placed after th e coordinates in the query tem p late file... 139
19
4.3 An exam ple of a typical query tem plate which is taken from the active site of a -ly tic proteinase, 1/p r...140 4.4 T he four tem plates used for optim isation of th e TESS box size.
Each run had the same His tem p late residue b u t the Ser and Asp atom s had different search param eters, giving different num bers of h its ...146 4.5 R un tim es (cPU seconds) to find the optim um box size for TESS.
Those runs left blank take over 1000 CPU seconds; th e figures on bold are the quickest r u n s ...147 4.6 T he tem p late used to investigate how th e ru n -tim e of TESS de
pends on the num ber of atom s in the query te m p la te ... 150
5.1 The four different Nu:-His-ELEC catalytic triads found in the PDB, where ELEC acts to perturb the pK^ of the acid /b ase His and Nu:
is a nucleophilic group... 161 5.2 T he 7'ms deviations from the m ean functional and sidechain con
sensus tem plates for the S er-H is-G lu cataly tic triad present in acetylcholinesterase and lipase X-ray crystal structures. T he re sults show th a t the catalytic triad is stru ctu rally conserved in these two enzym e ty p es...163 5.3 T he m i s deviations from the functional and sidechain tem plates
for the dataset of haloalkane dehalogenase X-ray crystal structures. 167 5.4 The I'rns deviations from the functional and sidechain tem plates
for th e dataset of X-ray crystal structures for th e thiol proteinases papain, actinidin and caricain... 170 5.5 T he coordinates of the functional consensus tem p late th a t de
scribes the active sites of the serine proteinases, lipases, acetyl cholinesterase and haloalkane dehalogenase enzym es... 173 5.6 T he consensus tem plates for each of the 4 classes. Each tem plate
is superim posed onto the same His tem p late residue. T heir r m s
distances from the class 1-2-3 tem plate is also given...175 5.7 List of the potential catalytic triads found when the PDB was
searched with the class 1-2-3 catalytic triad te m p la te ... 179 5.8 R esults of a BLAST search on the D-chain of nitrogenase I analysing
th e conservation of Asp 160-His 90-Asp 116 triad from Im iii, . . 182 5.9 Results of a BLAST search on the O -chain of
glyceraldehyde-3-phosphate dehydrogenase to see if th e D-H-D catalytic triad from
Ig d l (Buehner et a/., 1974) is conserved... 192 6 . 1 A sum m ary of th e num ber of ligands found in th e d ataset of serine-
proteinases, lipases and a//5 -h y d ro lase fold enzymes. The ligands are divided according to those whose sidechain catalytic triads are greater or less than 1.4Â from th e Nu:-His-ELEC consensus te m p la te.202
20
7.3 List of all the enzymes in the January 1995 release of th e PDB
which have bound m etals. For each enzyme, th e num ber of PDB
structures are given. For each m etal type there are two num bers in each box, th e b o tto m num ber is the to tal num ber of m etals in the
PDB structures for th a t enzyme. The top num ber is th e num ber of these m etals liganded to a H is... 221 7.4 List of all the non-enzym e proteins in th e Janu ary 1995 release of
the PDB which have bound m etals. For each enzym e, the num ber of PDB structures are given. For each m etal type there are two num bers in each box, the b o tto m num ber is the to tal num ber of m etals in th e PDB structures for th a t unique protein. T he top num ber is the num ber of these m etals liganded to a His...222 7.5 A list of all the enzyme structures in the January 1995 release of
the PDB which have a m etal ligated by one or m ore His residues. 224 7.6 A non-homologous list of all the non-enzym e protein structures in
the January 1995 release of the PDB which have a m etal ligated by one or more His. In several instances there are more th an one
PDB code for each protein group. This occurs because th e proteins were classified according to nam e and som etim es this refers to more than one protein by function...225 7.7 C oordinates o f th e two m etal-H is-E L E C conform ations w ith re
spect to th e His sidechain resid u e...226 7.8 The type of ELEC group associated with each m etal as part of the
metal-His-ELEC triad...230 8.1 Enzymes in the PROSITE database (Bairoch Sz Bucher, 1994) which
have catalytic residues listed in the site records. Only those en zymes with more than 1 catalytic residue in the records are listed. 255 8.2 Potential catalytic residues extracted from th e site records of the
PDB files... 257 8.3 Coordinates of the consensus tem plates th a t describe the two con
form er s, A and B, for the active site of ribonuclease A ... 262 8.4 A sum m ary of th e ribonuclease PDB structures and their r m s devi
ations from their respective consensus tem plates, th a t adopt either the A or B conform ation of their active site His 119 residue. Those
PDB codes in bold have coordinates describing both conform ations. 265 8.5 A summary of the ribonuclease Ti PDB structures and their r m s
deviations from the ribonuclease T% consensus tem plate. Those PDB codes in bold are m issed by the RNase Ti tem plate using a
3.0Â distance cu t-off... 271
21
8.7 A list of narbonin sequences found in th e OWL database (Bleasby
et al., 1994) w ith the residues found at th e equivalent positions of the Glu 132, His 133 and His 234 residues in I n a r (Hennig et al.,
1992; Hennig et al., 1995)... 274 8 . 8 The coordinates of th e consensus tem plates created for barnase
using th e seed coordinates of Ihse (Buckle et a i, 1993) and Ibgs
(Q uillet et al., 1993)... 279 8.9 The PDB codes for th e barnase structu res th a t are represented by
th e Ibse and Iban te m p la tes... 279 8.10 C oordinates of the consensus tem p late describing th e active site of
m am m alian lysozymes present in th e PDB...285 8.11 Sum m ary of th e eukaryotic lysozyme stru ctu res found in th e PDB.
The PDB codes in bold are those lysozymes whose catalytic residues are not identified by th e tem p late using a distance cut-off of 2.0Â. 286 8.12 C oordinates of th e consensus tem p late describing th e active site of
the prokaryotic t4 lysozymes present in th e PDB...288 8.13 The prokaryotic bacteriophage t4 lysozyme stru ctu res in th e PDB.
T he two structu res underlined were not identified by the t4 con
C hapter 1
In trod u ction
Proteins have an integral role in all living organisms; they have diverse stru ctu re
and function such as division, m otility, im m une response and enzym atic activ
ity. Fibrous proteins generally have a stru ctu ral role, for exam ple hair, bones
and nails. G lobular proteins have a com pact folded stru ctu re and perform all
other roles and, w ith the exception of m em brane proteins, tend to be soluble in
w ater and are therefore easiest to isolate and study. By far the m ost stru ctural
inform ation is on globular proteins. Proteins are large molecules; advances in
X-ray and nuclear m agnetic resonance techniques (NMR) has enabled the high resolution stru ctu res of around 400 unique protein folds to be identified. These
stru ctu res are deposited in the Brookhaven Protein D atabank (PDB, B ernstein et
aA, 1977).
In this thesis we will concentrate on the role proteins have as enzymes; these
are biological catalysts th a t determ ine the ra te and type of chemical reactions
th a t occur in every living cell. Specifically, com putational techniques have been
developed th a t enable us to analyse enzyme active sites from a stru ctu ral per
spective.
Chapterl: Introduction 23
1.1
A b r ie f h isto r y o f e n z y m e research
In th e late 19^^^ century Em il Fischer used m altase and emulsin to establish the
stereochem istry of anom eric derivatives of sugars; this work enabled him to sug
gest th e lock and key hypothesis to described the enzy m e-su b strate complex. In
1913 Leonor Michaelis and M aud M enton proposed th a t an enzym e and su b strate
first combine to form an enzy m e-su b strate complex which then breaks down to
form product and free enzyme. These investigators assum ed th a t su b strate and
enzym e are in continuous equilibrium ; Briggs and H aldane reform ulated the re
action process as steady state in 1925. In the same year Lowry suggested th a t
acid /b ase catalysis could strongly accelerate th e reaction by studying m utorota-
tion of glucose (Lowry & Faulkner, 1925).
In th e 1930’s J.H .N orthrop and M. K unitz crystallised pepsin, trypsin and
chym otrypsin. This provided the m aterial to finally prove th a t enzymes were
proteins and allowed the developm ent of the techniques of m odern protein chem
istry: the sequencing of the protein insulin by Fred Sanger (Sanger & Tuppy,
1951a,6); the determ ination of 3D stru ctu re of the protein hemoglobin and myo
globin by John Ken drew and Max P eru tz (P erutz et al., 1960 and Ken drew et a i, 1960 respectively); and the use of rapid -reactio n kinetics, which had been in itiated by F .J.W . Roughton in 1923.
Linus Pauling suggested in the late 1940’s th a t enzymes catalyse reactions by
strongly binding the transition state of th e substrate. K oshland’s work on hexok-
inase led to the ’induced fit’ hypothesis to explain enzym e specificity (Koshland,
1954). By this tim e the role of coenzymes was also understood, for exam ple, pyri-
doxal phosphate (B raunstein, 1960), nicotinam ide-adenine dinucleotides (n a d+
and NADP+, W estheim er et a i, 1951) and thiam in pyrophosphate (Breslow, 1958). In the m id 1960’s the X -ray stru ctu re of the enzym e lysozyme from hen egg
Chapterl: Introduction 24
over the following years {e.g Im oto et a i, 1972). T he developm ent of more pow erful com puters and software has enabled protein stru ctu re determ ination and
refinem ent to become both faster and easier.
Finally, the discovery th a t RNA molecules have catalytic power (Zaug & Cecil, 1986) showed th a t proteins are not the only biological molecules w ith catalytic
activity.
1.2
T h e role o f str u c tu r a l b io lo g y in u n d er
sta n d in g e n z y m e a c tio n
Solving the X-ray or NMR stru ctu re of enzymes has proved to be th e single most im p o rtan t factor in our understanding of enzym e m echanism . G enerally speaking,
stru ctu ral inform ation is used in concert w ith kinetic d a ta to hypothesise as to the
enzym e’s mechanism and m ode of action. If the residues involved in catalysis and
ligand binding can be elucidated, it gives th e protein engineer a good starting
point for mutagenesis experim ents and enables inhibitors to be designed th a t
provide a startin g point for stru ctu re-based rational drug design.
1.2.1
X—ray diffraction m ethod s
S tru ctu re determ ination by X-ray diffraction {e.g. Blundell & Johnson, 1976) requires the protein to be purified in sufficient quantities so th a t it can be crys
tallised. The process is far from straightforw ard; the m ain problem s can be
expressing and isolating enough quan tity of protein to be crystallised. Crystallis
ing the protein itself is not easy and it is not unusual for a p ro te in ’s stru ctu re
determ ination to take several years.
However, if the target protein is sufficiently sim ilar to the stru ctu re of a protein
C h a pterl: Introduction 25
stru ctu re in only a few days.
S tr u c tu r e d e te r m in a tio n
W hen th e beam of X-rays strikes th e regular lattice of a protein crystal th e
stru ctu re may be calculated from the resultant diffraction p a tte rn by Fourier
transform ation. This requires knowledge of the intensity, direction and phases
of th e diffracted rays. D eterm ination of th e phases is the m ost difficult problem
and this held up protein crystallography until, in 1954, Perutz and his coworkers
applied the m ethod of m ultiple isomorphous replacem ent (MIR). Here, heavy m etals are bound at specific sites in th e protein w ithout disturbing its structure.
T he m etal scatters X-rays more th an the protein and inform ation about phases
can be deduced from changes in intensity of the diffraction m ap.
Once the phases and am plitude of every diffraction ray has been calculated,
th e electron density of the protein m ay be calculated. Nowadays com puter graph
ics and software have m ade this procedure much easier.
A c c u r a c y and r e so lu tio n
The accuracy of th e protein model depends on several factors {e.g. B ran den & Jones, 1990). Firstly, determ ination of the phases involves calculating small differ
ences between large num bers and this depends on the accuracy of the diffraction
m easurem ents and usefulness of the heavy-atom derivatives.
Resolution of th e diffraction d a ta depends on how well ordered th e crystals
are and this directly influences the image th a t can be produced. N ative crystals
are usually b e tte r quality th an the derivatives. At 4 -6 À resolution, th e electron
density m ap shows little m ore th an the overall topology of the molecule. At 3.5Â
it is possible to follow the course of the polypeptide backbone and at 3.0Â the
Chapterl: Introduction 26
an accuracy of ±0.4Â . At 1.9Â resolution, the atom s can be located to ±0.2Â
resolution. In a typical MIR m ap the phases are determ ined to as low as 2Â resolution.
From th e MIR electron density m ap, a model of th e protein is built. The crys- tallographer has to decide how the polypeptide chain weaves its way through the
m ap. This is yet to be autom ated bu t com puter graphics facilitate this process;
skeletonised representations of the protein and contour nets of th e electron density
are th e m ost common. In addition, the crystallographer uses other inform ation
to fit the stru ctu re such as position of the heavy m etal, active site residues, and
the distinct density formed by a-helices and /^-sheets.
The final model from the MIR will contain m any errors which can usually be removed by the refinement process. The model is changed so th a t th e stru ctu re
am plitudes calculated from the model fit the observed am plitudes. The goodness
of this fit is expressed in term s of the R -factor which is a m easure of the difference
between the observed and calculated data. Obviously, th e b e tte r th e MIR map, the b e tte r th e initial model and the more reliable is th e structure; unfortunately,
not all crystals diffract well. There are various com puter program s available for
refinement such as XPLOR (Brunger et a i, 1987). XPLOR stands for exploration of conform ational space of macromolecules confined to regions by experim ental
d a ta and error estim ates. The program is based on an energy function approach:
arb itrary com binations of em pirical and effective energy term s describing exper
im ental d a ta m ay be used. The combined energy function can be minimized
by a variety of gradient descent, sim ulated annealing, and conform ational search
procedures. XPLOR evolved from the CHARMM program (Brooks et a/., 1983) and was the first program to combine X-ray crystallographic diffraction d a ta and
molecular dynam ics for refinement (Brunger et al, 1987).
Chapterl: Introduction 27
with caution for several reasons. Firstly, it is affected by the removal of weak
reflections and is insensitive to errors in m ainchain connectivity. The num ber of
w ater molecules added during the refinement should also be realistic as this can
artificially reduce the R-factor. Brunger (1992) advocated th e use of th e free R-
factor which is an unbiased indicator of the accuracy of th e protein models. This
calculates the difference between the observed and com puted diffraction d ata for
a ’te s t’ set of d a ta th a t is om itted from th e m odelling and refinem ent procedure.
1.2.2
Case study:
th e serine proteinases and acetyl
cholinesterase
In this section the serine proteinases and acetylcholinesterase are used as examples
to illustrate the relevance of stru ctu ral biology to our understanding of enzymes.
Research into serine proteinases’ m echanism of action began over 60 years ago,
when, in 1932 two G erm an investigators, Lange & Krueger, synthesised diethyl
fluorophosphate or nerve gas. During World W ar II, research on this compound
was carrried out for m ilitary purposes and A drian and his coworkers first noted
the sim ilarity between physiological action of the flourophosphonates and th a t
of reversible inhibitors of acetylcholine esterases (A drian et al.^ 1947). This led to a num ber of investigations of the action of nerve gases on esterases. In 1946
M azur & Bodansky found th a t diisopropyl fluorophosphate ( d f p ) irreversibly inhibits acetylcholinesterase and in 1949 Jansen and coworkers dem onstrated the
1:1 stoichiom etric reaction of DFP with chym otrypsin Ser 195. The reactivity of Ser 195 is highlighted by the fact th a t th e other 27 Ser residues in chym otrypsin
are untouched by DFP.
The significance of th e catalytic serine in the serine esterases’ m echanism
was identified when hydrolysis of the diisopropylphosphoryl derivative of acetyl
C hapterl: Introduction 28
In 1950, W ilson, Bergm an & Nachm ansohn published a two step mechanism
for the action of acetylcholinesterase (Wilson et a/., 1950); stop-flow kinetics (G utfreund & S turtevant, 1956) supported th e hypothesis. In B rian H artley ’s
laboratory (H artley &: Kilby, 1954) it was found th a t chym otrypsin catalyses the
hydrolysis of p -n it ropheny lacet at e ; during the reaction th ere was initially a rapid
liberation of p-nitrophenol followed by a slow hydrolysis. This indicated th a t
there were two phases to the catalytic reaction; the ’bu rst phase’ in which the
p -n itrophenylacetate reacts to form p -n itro p h en ylate and a covalent acyl-enzym e
interm ediate and, secondly, the ’steady s ta te ’ phase wherby th e in term ediate is
slowly hydrolysed releasing acetate.
The identification of a His residue as an essential basic group was
m ade by W hitaker & .Jandorf (1956); they treated chym otrypsin with 2,4-
dinitrophenylbenzene and found th a t the enzym e was inactivated w ith destruc
tion of the His residue. This was preceded by Schoellman & Shaw (1953) who
dem onstrated th a t N -tosylphenylalanyl chlorom ethyl ketone ( t p c k ) reacts irre versibly with the enzyme. The molecule is a strong electrophile and occupies
the active site of the enzyme, ireversibly inhibiting it; this led to the concept of
’affinity labelling’ (Schoellman & Shaw, 1963) and m any other examples of such
compounds have subsequently been identified.
David Blow solved the high resolution X-ray stru ctu re of chym otrypsin in
the late 1960’s (M atthew s et a/., 1967; Blow et a/., 1969; Blow, 1976). This work enabled, along with many spectroscopic and kinetic experim ents, three stru ctu ral
features to be identified th a t facilitate th e proteolysis by serine-proteinases; these
are sum m arised in Figure 1.1.
Firstly, the enzyme has a catalytic triad consisting of Ser, His and Asp
residues. The His and Asp act in concert to form an acid/base catalyst which
C h a p t e r l : I nt r odi i ct i on 29
Asp 102
S e r195
oxyanion
hole
Asp 194
H s 57
Gly 226
Gly 216
nonspecific
binding
Thr219
S e r217
Specificity
G ly-Ala-Trp
inhibitor
Figure 1.1: A diagram m atic representation of the active site of the serine pro teinase chymotrypsin taken from the X-ray structure of chymotrypsin (Harel et
C hapterl: Introduction 30
of th e peptide bond of the su b strate forming a acyl-enzym e in term ediate which
is subsequently hydrolysed by w ater to form product.
Secondly, there is tight binding by residues of th e tetrah ed ral transition state
interm ediate in th e so called ’oxyanion hole’. The tetrah ed ral interm ediate is
negatively charged and this is stabilised by hydrogen bonding from residues in
the oxyanion hole. For exam ple, Figure 1 . 1 shows Gly 193 to be hydrogen bonded
to the inhibitor in a sim ilar m anner to the transition state.
Thirdly, serine proteinases have a specificity pocket which binds th e amino
acid next to the scissile bond. In Figure 1 . 1 Gly 226 from th e enzym e occupies
this hole and so a large residue fits into the pocket; in this case it is a Trp from
the inhibitor.
1.2.3
C lassification o f enzym es
The E.G. num ber (Bielka et a/., 1992) classifies enzymes according to their func tion - both in term s of th e reaction they catalyse and the su b strate on which they
operate. The E.G. num ber consists of four com ponent num bers. T he first defines
the six m ain classes of enzymes: th e oxidoreductases, transferases, hydrolases,
lyases, isomerases and ligases. The other three components vary among the six
groups b u t in general describe the type of su b strate and any cofactors or pros
th etic groups th a t are involved in the enzyme reaction. Each unique enzyme has
a unique E.G. num ber. For exam ple, th e serine proteinases are identified by E.G.
num bers 3.4.21.n, where n in this case groups th e enzymes according to specificity for substrate; for exam ple, in chym otrypsin n = 1 and in throm bin n = 5.
1.2.4
E nzym e structures in th e
PDBC lm pterl: Introduction 31
deposited in the PDB, although inconsistences in bond lengths and angles were also identified. Due to these general errors in the PDB files, one cannot rely on a given enzym e stru cture in this database having its E.C. num ber quoted. T here
fore another system has been developed. This relies on aligning th e amino acid
sequence of each protein stru ctu re in the PDB w ith the SWISS-PROT (Bairoch A. & Boeckmann B., 1994; M arch 1995 release) sequence database using the auto
m atic sequence alignm ent program BLAST (Altschul et a/., 1990). This database has an accurate record of E.C. num bers so th e enzymes structures in th e PDB can be identified on this basis. In addition, as an ex tra checking system , th e nam e of
the enzyme can be located in th e enzym e databank (Bairoch, 1996).
A sum m ary of the enzym e structures in the January 1995 release of the PDB is listed in Table 1.1 There are 1581 enzym e structures, m any of which are different
complexes of the same proteins, giving us 214 unique enzymes by E.C. num ber.
Figure 1.2 is a histogram of the num ber of structures against E.C. num ber for
all the enzymes in our datasets and shows both the total and num ber of unique
enzyme structures. The hydrolase (E .C .3) enzymes dom inate this d ataset with
9 3 5 structures or 96 unique enzymes by E.C. num ber and this group is itself
dom inated by proteinase structures; these are one of the best understood group
of enzymes. There are 24 unique serine proteinases (E .C .3.4.21.x), 9 unique
aspartic proteinases (E .C .3.4.23.x), 3 unique cysteine proteinases (E .C .3.4.22.x)
and 5 unique m etallo-proteinases (E .C .3.4.24.x).
Figure 1.3 shows the num ber of structures for each of th e 214 unique enzymes