1661
Predicting Indoor Position Using Bluetooth Low
Energy And Machine Learning
Ivan Alexander, Gede Putra Kusuma
Abstract: Many people spend most of their time indoors.Providing localization services indoor will have many potential applications, such as navigation, requesting help and asset tracking.There are manyexistingpositioning techniques for indoor positioning system such as multilateration, trilateration and least square estimation.But theweakness of this existing positioning technique is that the results of predictionerrors are still very large. With the development of machine learning technique, many researchers had used machine learning techniquesfor indoor positioning system.However, the existing research still uses location classification, even though machine learning can be used as regression to predict location. In this study, we propose a positioning algorithm forindoor positioning system using Bluetooth Low Energy (BLE), fingerprinting approach and four machine learning regression: Artificial Neural Network Regression (ANN), Multiple Linear Regression (MLR), Random Forest Regression (RF) and Support Vector Regression (SVR). We compare theperformance in term of Mean of Error, Min of Error, Max of Error, Median of Error and 90th Percentile of Error between four machine learning regression and the weighted sum method as a benchmark. The results obtained that allmachine learning regression has lowerMean of errorcompared to the weighted sum method. The SVR model has the best performance amongthemachine learning regression,whichyields134.92 cmofMean of error, 18.39cm ofMin of Error, 336.29 cmofMax of Error, 125.54cm ofMedian of Error and 216.65 cm of 90th Percentile of Error.
Index Terms:Localization, Bluetooth Low Energy, Machine Learning, Fingerprinting, Indoor Position System, Wireless technology, Sensor networks
————————————————————
1.
INTRODUCTION
Localization is a process to obtain information on the location of a person or an object in connection with a set of reference positions in a predetermined location. Localization is divided into two groups: indoor and outdoor [1]. The most popular technology for outdoors is the Global Positioning System (GPS). Unfortunately, GPS has proven ineffective for indoor positioning due to the lack of signal coverage. Because many people spend most of their time indoors, providing localization services indoor will have many potential applications such as advertising/marketing, road search/navigation, search/requesting help and asset tracking/people [2]. There are already several solutions and alternative for indoor localization by using wireless technology, such as Radio-frequency identification (RFID), Wi-Fi Wireless Local Area Networks (WLAN) and Bluetooth [3]. However, each of them has disadvantages.For example, Wi-Fi hasa limitation due to limited numbers of access points and difficult installation. RFID has the best accuracy among all technology, but RFID has a short-range (below 1m)and the installation of RFIDisvery expensive. Most of the research and applications refer to systems using Bluetooth since it performed better in terms of quality and cost[4].Bluetooth is a standard wireless technology that is used to exchange data at close range.The new generation of Bluetooth, namely Bluetooth 4.0, is made to increase efficiency.The name of this new Bluetooth technology is Bluetooth Low Energy (BLE). BLE has excellent specifications for low power wireless communications [5]. BLE acts as a continuous signal for Bluetooth broadcasting; each signal contains a Universal Unique Identifier (UUID) information. With the UUID, each BLE can be seen where it is placed [6]. Therefore, Bluetooth Low Energy (BLE) devices have recently been considered as a potential wireless technology for indoor positioning devices. Low-cost and easy to develop causes the use of BLE technology becomes popular. Therefore, in this study, we used BLE (Cubeacon
Card) as the main signal transmitter [7].Positioning techniquessuch as Multilateration,Trilateration and Least Square Estimation [8]areexisting techniquesthat are often used in indoor positioning system.Thesetechniqueshave aweakness, that is the error results of prediction are very large, due to this weakness, many researchers had used machine learning technique for indoor positioning systemusing K-Nearest Neighbors algorithm (kNN) algorithm, Discriminant analysis classifier (Dac) and Support vector machine (SVM)[9]. But the existing research for indoor positioning system still uses location classification.What interesting here is machine learning can be used as regression to predictuser location as in the existing positioning technique.Moreover with the use of machine learning regressionit is expected to increase the performanceof prediction. In this study, BLE, fingerprinting approach and machine learning regression model will be usedto create positioning algorithm. Four machine learning regression: Artificial Neural Network Regression (ANN), Multiple Linear Regression (MLR), Random Forest Regression (RF) and Support Vector Regression (SVR) will be used and theperformancefor each machine learning regression model will be compared to the weighted summethod as a benchmark.
2
RELATED
WORKS
Research conducted by Qais Ahmed Habash[10] has succeeded in conducting an indoor positioning system using nRF51822 BLE module as the main signal transmitter and Beacon which is the slave. The purpose of this study is to help hospital staff find their patients quickly both through the main server and the staff's smartphone. To detect the presence of someone, BLE is placed in a predetermined room and connected to microcontroller module. What is interesting in this study is that there is an alarm feature that gives alerts to the server, if the patient enters a forbidden place in the hospital. In this study BLE and beacons were only used to determine the localization of patients.Research conducted by Ankush A. Kalbandhe and Shailaja.C.Patil[11]measured Received signal strength indication (RSSI) from BLE tags to smartphone applications using a positioning algorithm based on measurements of RSSI values and transmission power to determine the distance in meter. On the smartphone will appear the distance from the smartphone to the BLE tag that ————————————————
Ivan Alexander is currently pursuing a master’s degree program in
computer science in Bina Nusantara University, Indonesia. E-mail: [email protected]
Gede Putra Kusuma is a lecturer in Bina Nusantara University,
is connected, an experiment is carried out to measure the distance from the BLE tag to the smartphone. This study only measures the distance from the BLE tag to the smartphone.The research conducted by Sugandh Memon[12]does as Ankush did, but the difference is there are advertising intervals on beacons that are tested. The interval value used are 100ms, 500ms and 1000ms. 100% accuracy were obtained for 100ms and 500ms intervals, while 94% accuracy obtained for 1000ms interval.The research conducted by Quang Huy Nguyen [8]took an approach of indoor positioning system thatoptimized by using BLE to detect the location of smart devices in a room (Static device). The first stage of the experiment is the calibration stage to measure RSSI. The second step is cleaning the RSSI value by using three different filter types, namely the Gaussian filter, Feedback filter and Kalman filter, the best result is Kalman filter, therefore the result of cleaning Kalman filter is used for the next stage, which is estimating the position results with using three different methods, namely Trilateration-weighted Centroid, Least Square Estimation (LSE) and Improved LSE. The results with the highest accuracy are using Improved LSE with a difference of 0.2 - 0.35m with the real position. The difference obtained in this study is still very large.The research conducted by GokhanŞengül(Karakaya & Sengul, 2017)using machine learning technique and classification of locations with a size of 1x1 meters. The algorithm used in this study is supervised learning, namely K-Nearest Neighbors algorithm (kNN) and Discriminant analysis classifier (Dac). The first experiment was carried out only by using 1 BLE to find out whether by increasing the number of BLE the results would be better. The next experiment used 2 BLE and the results of each algorithm, namely kNN and Dac are both good, which is above 90% and these two algorithms can be used for indoor positioning. The disadvantage of this research is that the location classification will be better if the results that appear are in the form of x and y coordinates.Research conducted by Jes´usLov´on-Melgarejo[13]uses kNN machine learning techniques and Support Vector Machine (SVM) in conducting indoor positioning systems, the level of Tx in BLE is set, 0x06, 0x07 and 0x08. The results obtained are pretty good is to use the kNN technique at Tx0x06. This research also uses location classification.Some studies had proposed indoor positioning system with the use of machine learning technique, but the machine learning technique used is only for location classification. In this study we use machine learning technique as a regression to predict user location.
3 PROPOSED
METHOD
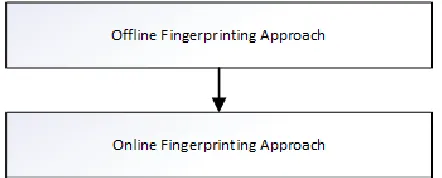
In this study used fingerprinting approach used to predictuser location.The predicted location will include X coordinateand Y coordinate of user location. There will be two phases, offline fingerprinting approach and online fingerprinting approach as shown in fig. 1.
Fig. 1. Fingerprinting Approach
The first phaseis Offline fingerprinting approach, whereradio maps data is collected. Radio maps is a collection of data of reference points.The collection of radio maps data
containsBLERSSI⃗⃗⃗⃗⃗⃗⃗⃗ ̃value, X coordinate and Y coordinateas a reference point (RP).After radio maps has been made, the next step is collecting training data which contains BLE RSSI
⃗⃗⃗⃗⃗⃗⃗⃗ ̃value, X coordinate and Y coordinate nearest the reference point as a training point (TP), both of these data will be used to find k-nearest reference based on RSSI distance (RSSId)for each X and Y coordinate.RSSIdcalculation based onL2-normEquation as shown in Equation(1) andwill be used to trainthe machine learning regression model.Fig. 2. is the block diagram for offline Fingerprinting approach.
Fig. 2. Offline Fingerprinting Approach
RSSI a ce √∑ RSSI RSSI
(1)
The next step is training the machine learning regression model. There are four machine learningregression used:
1. Artificial Neural Network Regression (ANN)
1663 1. Multiple Linear Regression (MLR)
MLRcalculates a linear regression model from the input.The MLR regression based on the linear correlation between dam effect quantities and environmental variables[15]. The goal of the MLR regression is to model the linear relationship between the independent variables and the dependent variable. Equation (2) is the MLR equation.
Y WX + WX + WX + ⋯ + W X + b (2)
2. Random Forest Regression (RF)
RFis a classification and regression algorithm based on the bagging [16] and random subspace methods [17]. Random forests are built by combining the predictions ofvarious trees. To construct a random tree, there are three considerations to look. First is the method for splitting trees, secondis the type of predictor to use in each of leaf and the last is the method to injecting randomness in thetrees[18].The prediction of the ensemble is constructed from the separate decisions by majority voting for the classification and averagefor the regression. Bagging will reduce the variance in the final model when compared to the first model and it also can avoid overfitting.
3. Support Vector Regression (SVR)
SVR takes input data and predicts, for each given input, which of the two possible classes comprises theinput.This makes SVR as a non-probabilistic binary linear classifier[19].The main idea of SVR is to minimize error, individualizing the hyperplane which maximizes the margin.The advantages of SVR is that the computational complexity does not depend on the input space dimensionality.RSSId dataused to train the machine learning regression model.In the training process, K-fold Cross Validation method will be used. The purpose of the training model is to determine the most optimummodelfor each machine learning regression model throughparameter tuning. Fig. 3. isthe block diagram forMachine Learning Regression Models Training for each X and Y coordinate.
Fig. 3. Machine Learning Regression Models Training
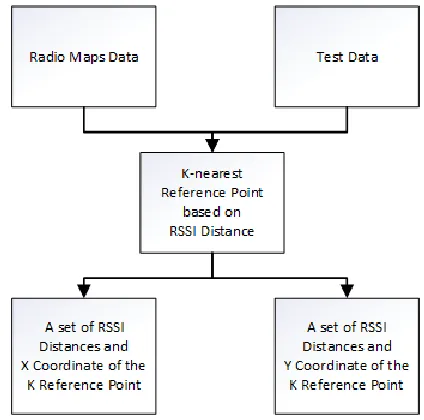
The next step isan online Fingerprinting approach.The online fingerprinting approach is used to find a set of RSSI distance and coordinate data which is used to testing the optimum machine learning regression model, the difference is in the data(Test Data).Fig. 4. Is the block diagram for online Fingerprinting approach.
Fig. 4. Online Fingerprinting Approach
The optimum machine learning regression model which is founded from offline Fingerprinting approach will be used to testing the performanceof the model by predicting user location using RSSIddata obtained through the online Fingerprinting approach. The performance of machine learning regression model for each predicted user location will be combined and evaluated. Fig. 5. Is the block diagram for predicting user location.
Fig. 5. Predicting User Location
4 EXPERIMENTS
4.1 Dataset Collection
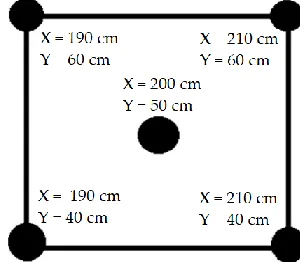
Fig. 6. Data Collection Room and The Radio Maps Data Collection Scheme
The data collected for radio maps are fourRSSI⃗⃗⃗⃗⃗⃗⃗⃗ value of each BLE, X coordinate and Y coordinate. The coordinate positionsampled every 50cm distance in 400 cm x 600 cm room. Data was collected at a height of 1.25 meters from the floor using a smartphone, the application used is BLE RSSI Application that created using Android Studio. For each position, 100 sample datawerecollected, one sample datawere collected every 200ms. There are 77sampled position points in the room, so total data for radio maps are 7700 data. Theradio maps data for each positionare averaged, so the total data
forradio maps are 77 datathat contains BLE RSSI⃗⃗⃗⃗⃗⃗⃗⃗ ̃, X coordinate and Y coordinate. The next collected data istraining and testing data. The datawere taken four points at each intersection of sampledcoordinate position points, for each position of intersection there were10 data collected. There are 308 positions in total, so total data are3080.The data for each positionare averaged, so the total data are 308 that contains
BLE RSSI⃗⃗⃗⃗⃗⃗⃗⃗ ̃, X coordinate and Y coordinate.Fig.7. is the scheme of data collection for training and testing data.
Fig. 7. Training and Testing Data Collection Scheme
The X and Y coordinate of radio maps used as a reference point (RP) while the X and Y coordinate of training and testing data used as a label to be predicted. After collected,radio maps, training, and testing data are used to find k-nearest based on RSSI distance (RSSId) with a total of 308 data for each X and Y coordinate.In this experiment we use the k value is 4, so the best four RSSId data are taken.There are 9 data component for eachRSSId data, for RSSIdX coordinate it
contains X label, four best di a ce⃗⃗⃗⃗⃗⃗⃗⃗⃗⃗⃗⃗⃗⃗⃗⃗⃗ data and four X coordi a e refere ce poi
⃗⃗⃗⃗⃗⃗⃗⃗⃗⃗⃗⃗⃗⃗⃗⃗⃗⃗⃗⃗⃗⃗⃗⃗⃗⃗⃗⃗⃗⃗⃗⃗⃗⃗⃗⃗⃗⃗⃗⃗⃗⃗⃗⃗⃗⃗⃗⃗⃗⃗⃗⃗⃗⃗⃗⃗⃗⃗⃗⃗⃗ as well forRSSIdY coordinate.The best distance and reference pointdata will beused as input fortraining the machine learning regression model.
4.2 Experimental Design
There area total of308RSSIddata for eachcoordinate, 308 RSSIddata for X coordinateand 308 RSSIddata for Y coordinate. The RSSIddata is randomly separated with a ratio of 80:20. Total of244 data usedto trainthe machine learning regression model and 64 data used for testing the optimummachine learning regression model.Four-fold cross-validation is used to train the machine learning regression model, therefore 244 data are divided into four folds, with a total of61 data for each fold.Before the process begins, the 244 data randomly separated with a total of 183 data for the training set anda total of 61 data forthe validation set. Based on the four foldsit means there are3 folds containing61training set dataand 1fold containing 61validation set data.Then, the process using data that already dividedby folds typeis repeated 4 times (K = 4). The position of the validation setfold is different in each iteration. Fig 8. Is the process of four-fold cross-validation.
Fig. 8. Four-Fold Cross Validation Process
1665
Fig. 9. Model Performance Evaluation
ucl dea a ce √(X X̂) + (Y Ŷ) (2)
The evaluation plan that will be carried out is evaluating the proposed Indoor Positioning System method compared to the fingerprinting approach that Yuan Zhuang did [20]. The difference is in the positioning algorithm method, Yuan Zhuang's method used Weighted Sum method. Weighted sum method calculationis simply to add the multiplication result of
an alternative value with weighted
criteria[21],whilethepositioning algorithm method proposed is using Fingerprinting approach and four machine learning regression, ANN, MLR, RF, and SVR.
4.3 Experimental Results
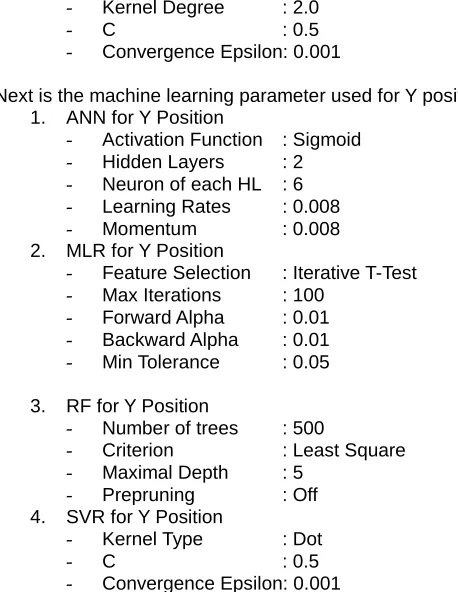
For the experimental results, the discussion will be started from the machine learning parameter being used. For the parameter tuning it has been done for each model and the parameter listed here already the best parameter for themachine learning regression model used.Machine learning regression parameter used for X position are:
1. ANN for X Position
- Activation Function : Sigmoid - Hidden Layers (HL) : 2 - Neuron of each HL : 6 - Learning Rates : 0.01
- Momentum : 0.01
2. MLR for X Position
- Feature Selection : M5 Prime
- Min Tolerance : 0.05
3. RF for X Position
- Number of trees : 500
- Criterion : Least Square
- Maximal Depth : 25
- Prepruning : On
o Min Gain : 0.01
o Min Leaf Size : 2
o Min Size Split : 4
o Prepruning : 5
4. SVR for X Position
- Kernel Type : Anova
- Kernel Gamma : 1.0
- Kernel Degree : 2.0
- C : 0.5
- Convergence Epsilon: 0.001
Next is the machine learning parameter used for Y position: 1. ANN for Y Position
- Activation Function : Sigmoid
- Hidden Layers : 2
- Neuron of each HL : 6 - Learning Rates : 0.008
- Momentum : 0.008
2. MLR for Y Position
- Feature Selection : Iterative T-Test - Max Iterations : 100
- Forward Alpha : 0.01
- Backward Alpha : 0.01
- Min Tolerance : 0.05
3. RF for Y Position
- Number of trees : 500
- Criterion : Least Square
- Maximal Depth : 5
- Prepruning : Off
4. SVR for Y Position
- Kernel Type : Dot
- C : 0.5
- Convergence Epsilon: 0.001
For the next discussion is the Validation RMSE results. Table 1. Is the Validation RMSE results for training model.This results already provided the best Validation RMSE for each model used.
TABLE 1
VALIDATION RMSERESULTS Model Position RMSE (cm)
ANN X 93.78 +/- 7.01 ANN Y 130.81 +/- 9.24 MLR X 94.70 +/- 8.83 MLR Y 133.94 +/- 8.23
RF X 93.11 +/- 7.31 RF Y 130.09 +/- 6.45 SVR X 92.30 +/- 7.64 SVR Y 133.29 +/- 5.68
TABLE 2
PERFORMANCE RESULTS FOR ALL MODELS
Model and Method Performance Mean of Error (cm) Min of Error (cm) Max of Error (cm) Median of Error (cm) 90th percentile of Error(cm) ANN 138.80 19.38 311.37 128.13 228.41 MLR 142.22 31.28 309.38 137.16 229.42 RF 137.87 19.52 340.50 133.48 215.48 SVR 134.92 18.38 336.29 125.54 216.65 Weighted
Sum 146.47 18.39 379.88 137.68 241.83 First let’s see the Mean of Error results column, the smallest Mean of Error result is the SVR model with result in134.92cm, while the weighted sum method has the biggestMean of Error resultin 146.47cm, aside from that, ANN, MLR, and RF model also has smaller results of Mean of Error than the weighted sum method.Next is the Min ofError results column, in herethe SVRmodel also has the smallest result in18.38cm.For the next column isMax of Error results, the MLR model has the smallest Maxof Error result in309.38cm. Next, let’s see the Median of Error results column, 125.5 cm is the smallest result for this column, produced with the SVR model, the biggest result is the weighted sum method in 137.68 cm. The last column is 90thPercentile of Error, the RF model has the smallest result in 215.48 cm, the SVR model is the second smallest result in 216.65cmof 90thPercentile of error result. The weighted sum method also has the biggest result in 241.83 cm of 90thPercentile of Error. The discussion and rank performance for the machine learning regression model and weighted sum method summarized in Table 3 below.
TABLE 3 RANK PERFORMANCE
Rank Mean of Error Min of Error Max of Error Median of Error 90th percentile of Error
1 SVR SVR MLR SVR RF
2 RF Weighted
Sum ANN ANN SVR
3 ANN ANN SVR RF ANN
4 MLR RF RF MLR MLR
5 Weighted Sum MLR Weighted Sum Weighted Sum Weighted Sum
From Table 3. we can see that the SVR model has the best performanceamong the machine learning regression model, SVR has the best performancein term ofMean of error, Min of error and Median of error. The test performancefor the SVR modelis consistent with the validation RMSE result. The weighted sum method did not perform very well interm of Mean of Error, Max of Error, Median of Error and 90th Percentile of Errorcompared to allmachine learning regression model.The evaluation plan carried has been successful to compare the performance of four machine learning regression with weighted sum method.
5 CONCLUSION
AND
FUTURE
WORKS
In this paper, proposed a positioning algorithm using fingerprinting approach and four machine learning regression: ANN, MLR, RF, and SVR.Our positioning algorithm has lower Mean of error result compared to the weighted sum method, it means allfourmachine learning regression model that has been trained has better performance than the weighted sum method. The SVR model has the best performance among the machine learning regression modelwith results in 134.92 cm ofMean of error. Besides that,the SVR model also has better performance in term ofMin of Error in 18.39 cm and Median of Error in 125.54 cm. For the next study,a bigger room will be used to do the experiment.With the bigger size room, the more difficult it will be,so the amount of BLE used will be increased and more machine learning regression model will be used.Besides than machine learning regression model, deep learning model also will be used to predict user location.
REFERENCES
[1] J M. Yasir, S.-W. Ho, and B. N. Vellambi, ―Indoor Positioning System Using Visible Light and Accelerometer,‖ J. Light. Technol., vol. 32, no. 19, pp. 3306–3316, 2014.
[2] Y. Gu, A. Lo, and I. Niemegeers, ―A survey of indoor positioning systems for wireless personal networks,‖ IEEE Commun. Surv. Tutorials, vol. 11, no. 1, pp. 13–32, 2009. [3] P. Meng, K. Fehre, A. Rappelsberger, and K. P. Adlassnig,
―Framework for near-field-communication-based geo-localization and personalization for android-based smartphones - Application in hospital environments,‖ Stud. Health Technol. Inform., vol. 198, pp. 9–16, 2014.
[4] K. Huang, K. He, and X. Du, ―A hybrid method to improve the BLE-based indoor positioning in a dense bluetooth environment,‖ Sensors (Switzerland), vol. 19, no. 2, 2019. [5] R. Faragher and R. Harle, ―Location fingerprinting with
bluetooth low energy beacons,‖ IEEE J. Sel. Areas Commun., vol. 33, no. 11, pp. 2418–2428, 2015.
[6] K. Nair et al., ―Optimizing power consumption in iot based wireless sensor networks using Bluetooth Low Energy,‖ 2015 Int. Conf. Green Comput. Internet Things, pp. 589– 593, 2015.
[7] A. Noertjahyana, I. A. Wijayanto, and J. Andjarwirawan, ―Development of Mobile Indoor Positioning System Application Using Android and Bluetooth Low Energy with Trilateration Method,‖ Int. Conf. Soft Comput. Intell. Syst. Inf. Technol., 2017.
[8] Q. H. Nguyen, P. Johnson, T. T. Nguyen, and M. Randles, ―Optimized Indoor Positioning for static mode smart devices using BLE,‖ IEEE 28th Annu. Int. Symp. Pers. Indoor, Mob. Radio Commun., pp. 0–5, 2017.
[9] M. Karakaya and G. Sengul, ―Using Bluetooth Low Energy Beacons for Indoor Localization,‖ Int. J. Intell. Syst. Appl. Eng., vol. 5, no. 2, pp. 39–43, 2017.
[10]Q. A. Habash, ―The Provisional of Bluetooth Low Energy Based Real Time Patient Tracking System,‖ Imp. J. Interdiscip. Res., vol. 3, no. 10, pp. 1–5, 2017.
[11]A. A. Kalbandhe and S. C. Patil, ―Indoor Positioning System using Bluetooth Low Energy,‖ 2016 Int. Conf. Comput. Anal. Secur. Trends, pp. 451–455, 2016.
[12]S. Memon, M. M. Memon, F. K. Shaikh, and S. Laghari, ―Smart Indoor Positioning Using Ble Technology,‖ Int. Conf. Eng. Technol. Appl. Sci., p. ss, 2017.
1667 and I. Garcia-Varea, ―Supervised learning algorithms for
indoor localization fingerprinting using BLE4.0 beacons,‖ 2017 IEEE Lat. Am. Conf. Comput. Intell., pp. 1–6, 2017. [14]E. Çalişkan and Y. Sevım, ―A comparative study of artificial
neural networks and multiple regression analysis for modeling skidding time,‖ Appl. Ecol. Environ. Res., vol. 17, no. 2, pp. 1741–1756, 2019.
[15]J. Wang, ―An Empirical Comparison of Multiple Linear Regression and Artificial Neural Network for,‖ vol. 2019, 2019.
[16]L. Breiman, ―Bagging Predictors, URL:
https://link.springer.com/article/10.1007%2FBF00058655,‖ Mach. Learn., vol. 24, no. 421, pp. 123–140, 1996. [17]Tin Kam Ho, ―The random subspace method for
constructing decision forests,‖ IEEE Trans. Pattern Anal. Mach. Intell., vol. 20, no. 8, pp. 832–844, 1998.
[18]M. Denil, D. Matheson, and N. De Freitas, ―Narrowing the Gap: Random Forests In TheDenil, M., Matheson, D., & De Freitas, N. (2014). Narrowing the Gap: Random Forests In Theory and In Practice. Proceedings of The 31st International Conference on Machine Learning, (1998), 665–673. Retrieved from ht,‖ Proc. 31st Int. Conf. Mach. Learn., no. 1998, pp. 665–673, 2014.
[19]W. J. Niu, Z. K. Feng, B. F. Feng, Y. W. Min, C. T. Cheng, and J. Z. Zhou, ―Comparison of multiple linear regression, artificial neural network, extreme learning machine, and support vector machine in deriving operation rule of hydropower reservoir,‖ Water (Switzerland), vol. 11, no. 1, 2019.
[20]Y. Zhuang, J. Yang, Y. Li, L. Qi, and N. El-Sheimy, ―Smartphone-based indoor localization with bluetooth low energy beacons,‖ Sensors (Switzerland), vol. 16, no. 5, pp. 1–20, 2016.