Attitudes Of Mathematics Teachers
Toward Using Smart Board In
Teaching Mathematics
Wafa Muhanna, Al al-Bayt University, JordanKhamis Mousa Nejem, Al al-Bayt University, Jordan
ABSTRACT
This study aimed at investigating the attitudes of mathematics teachers toward using a smart board in teaching mathematics and also to determine the effect of gender, experience, and qualification of teachers on their attitudes.
The sample of this study consisted of 74 mathematics teachers - 35 males and 39 females - from private schools in Amman city in Jordan. Means and standard deviations and T-test were used to analyze the results.
The results of the study revealed that the mathematics teachers have positive attitudes toward using a smart board in teaching mathematics. Results showed that there is no statistically significant difference due to gender variable; however, there were statistically significant differences due to experience variable and due to qualification variable.
Keywords: Teachers' Attitudes; Smart Board; Teaching Mathematics
INTRODUCTION
ew methods for teaching and learning in public schools were provided through technology. Using technology in the classroom is constantly increasing and evolving, and it is important as part of the students’ education to prepare them for the future. One of the new technological advancements that is widely used in the classroom nowadays is a smart board to increase a student’s knowledge (Rakes et al., 2006; Siemens and Matheos, 2010; Knezek et al., 2006).
Moreover, by providing students with opportunities to interpret and construct meaning and to present data in meaningful ways to their instructors and peers, instructional technology is associated with increased academic achievement and may increase student motivation for school work (Bell, 2002; National Council for Accreditation (NCATE), 2008). School administrators believe that technology is a critical component of the educational experience for students and this was shown by many studies (Brush & Bannon, 1998).
Technology can provide students with greater access to a vast array of information and resources, empowering them to become free agent learners able to create meaningful personalized learning experiences outside the traditional classroom.
The smart board works in conjunction with a projector to create the image on the board. When working with the board, it is very easy to step into the light produced by the projector, thus creating a shadow which makes it impossible to see what you are actually writing or doing. The audience is also not able to see the presentation, thus leading to frustration for the audience and presenter.
The smart board works by the touch of a finger or with the provided pens, and writing on the board can be very difficult. This difficulty stems from standing in the projector light, which casts a shadow and the inability to write clearly. The letters are wavy and not as crisp as words written on a blackboard or dry erase board (Carpenter, 2007).
Smart boards offer more benefits than computers. Computers are designed for individual use, whereas smart boards are designed for whole-class instruction. The entire premise of this technology is built upon active engagement. Touch-sensitive screens are mounted on the wall of the classroom and a projector shows information that can be manipulated and displayed with unlimited capabilities. The advantage of smart board technology is its design for use in a spacious work area with group interaction. The enlarged visuals are easily seen due to the size of the interactive whiteboard. Participants become both visually and physically engaged as they connect with electric content and multimedia in a collaborative learning environment (Smart Technologies, 2004). Using special pens, students and/or teachers write directly on the screen. They can manipulate text and images, view websites, cut and paste research information, view video clips, formulate graphs and charts, and design vivid and creative presentations. Students combine their cognitive and physical abilities to interact with smart board technology. The interactive nature of the technology and the state-of-the art software enable students to generate activities that are engaging, useful, and enlightening. Informational text, research, and real-time Internet sites can be easily incorporated and accessed during the lesson (Starkman, 2006). Additional interactive features include the conversion of handwritten text to typewritten text, drag and drop boxes, the opportunity to highlight specific words, and the option of diagramming/scaffolding information. Teachers can download lesson plans, adjust them to the specific needs of the students, and save them for future use.
According to Sani (2007), students who are shy tend to become engaged in learning when it comes to working with smart boards. A smart board is made up of a computer, smart board software, an interactive whiteboard, and a projector. The smart board interactive whiteboard system is made up of a computer with the smart board software, a projector and the smart board interactive whiteboard itself. “With a touch of a finger, students can control applications; navigate the Internet; and write, change, move around, and save content” (Sani, 2007). The whiteboard is a touch screen and when learning with a smart board, students are engaged and listening instead of taking notes. Taking notes is distracting and does not allow the students to learn to their full potential. While the lesson is going on, the students are engaged in learning and teachers are able to send the notes to the students at a later time so that they can review on their own. This is an example of technology being put to good use and reaching students at different levels of learning. Children are listing, hearing and are engaged during a lesson using a smart board. A smart board can be used to enhance all subject areas, especially math, science, and English. Students feel comfortable using a smart board and it is the teacher’s responsibility to keep up with the new trends in using technology.
LITERATURE REVIEW
Interactive smart boards have gained a reputation in the educational system from the first grade to the university stage (Bell, 2002; Oigara, 2010). Cognitive research has shown that learning is most effective when four fundamental characteristics are present - active engagement, participation in groups, frequent interaction and feedback, and connection to real-world contexts (Roschelle et al., 2000). Research in educational technology has shown that combining smart boards with computer use increases the interactive atmosphere in the classroom (Carbonara, 2005; Oigara & Keengwe, 2011). The interactive quality of a smart board lends itself to a degree of student participation not offered by other presentation methods.
Furthermore, research has included examination of the specific perceptions of students and teachers regarding the use of smart boards within the classroom. Research has consistently shown that students and teachers alike perceive that this technology offers considerable benefits to enhance students’ attention to the task at hand (Hall et al., 2005; Miller & Glover, 2002) and may even improve their ability to learn the material (Reimer & Moyer, 2005). In contrast, the use of this technology offers benefits for teachers with respect to professionalism of the presentations they develop, the efficiency with which they can deliver a lesson, and diversity in terms of the manner in which they present curriculum content (Rudd, 2007).
Broader discussions of the use of smart boards in the classroom have examined whether the presence of technology contributes to a more dynamic classroom environment or whether it creates conditions that place the teacher (using the board) as the focal point of the learning context rather than promoting interaction within the classroom between students and the teacher and students (Rudd, 2007). In fact, Shenton and Pagett (2007) reported that some teachers who used the interactive whiteboards were most concerned about creating interactivity between the students and the board itself rather than between members of the classroom. The question is whether, as teachers are integrating the technology into the classroom, they are using it in a way that enhances the dynamic nature of instruction or disrupting it. Is there evidence that teachers use smart boards, as Burden (2002) suggests, in a way that creates conditions for learners to be passive or in a way that adds value to the learning process? In his study, he examined the experiences of nine grade 6 teachers as they developed their skills in the use of an interactive whiteboard in their classrooms, particularly for teaching science. He was particularly interested how they perceived the potential use of the board and how they implemented it in their classroom instruction.
PURPOSE OF THE STUDY
The purpose of this study is to investigate the attitudes of mathematics teachers toward using a smart board in teaching mathematics and also to determine the effect of gender, experience and qualification of teachers on their attitudes.
Questions of the Study
1. What are the attitudes of the mathematics teachers toward using a smart board in teaching mathematics? 2. Are there statistically significant differences in the attitudes of mathematics teachers due to their gender
(male, female)?
3. Are there statistically significant differences in the attitudes of mathematics teachers due to their experience (five years or less, above five years)?
4. Are there statistically significant differences in the attitudes of mathematics teachers due to their qualification (bachelor degree, master degree)?
DESIGN AND METHODOLOGY
Sample of the Study
The sample of the study consisted of 74 mathematics teachers - 35 males and 39 females - from private schools in Amman city in Jordan during the first semester of the scholastic year 2012/2013.
Instrument of the Study
The instrument of the study was a questionnaire of the attitudes toward using a smart board in teaching mathematics. This questionnaire was designed by the researchers themselves, which consisted of 25 statements. Many variables were included, such as the gender of the teachers, experience, and qualification.
The teacher answers each statement of the questionnaire according to a Likert-type scale by selecting one of the following answers:
As positive: strongly agree (5), agree (4), neutral (3), disagree (2) and strongly disagree (1)
The researchers assumed that the teacher whose average is above (3) has positive attitudes towards using a smart board in teaching mathematics.
Validity of the Instrument
To ensure validity, the statements of the questionnaire were presented to several experts in mathematics curricula and educational technology from professors in the Jordanian universities. The necessary changes were done according to the suggestions and remarks of the judges, therefore finalizing the questionnaire.
Reliability of the Instrument
To ensure reliability of the questionnaire, the researchers applied it to a pilot sample of (28) mathematics teachers. The reliability coefficient was calculated by using Cronbach-α equation and it was found to be 0.89 which is suitable for conducting such a study.
Procedures of the Study
A questionnaire about teachers' attitudes toward using a smart board in teaching mathematics was given to 74 mathematics teachers (35 male and 39 female). The researchers then collected the questionnaires and collected data which was analyzed statistically.
FINDINGS OF THE STUDY
To answer the questions of the study, the questionnaire of the attitudes toward using a smart board in teaching mathematics was applied and the following results were reached:
1. Question #1: What are the attitudes of mathematics teachers toward using a smart board in teaching mathematics?
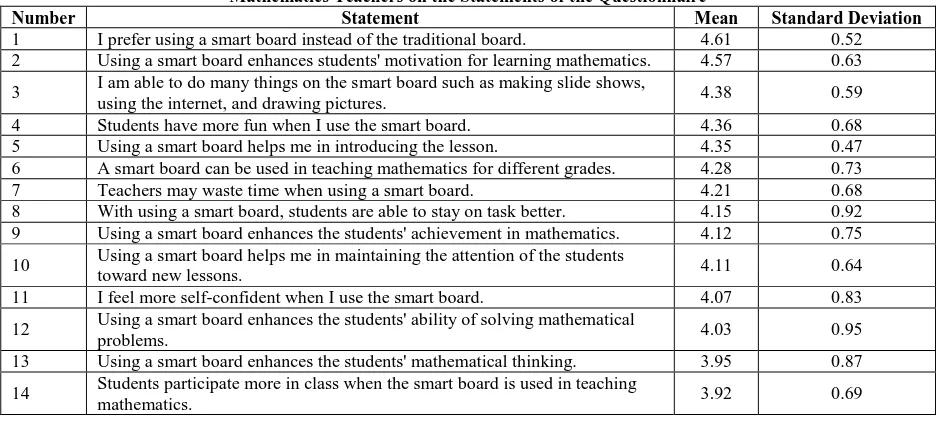
To answer this question, the means and standard deviations were calculated for the answers of mathematics teachers on the statements of the questionnaire. The results are illustrated in Table 1 and are arranged in descending order according to its mean.
Table 1: Means and Standard Deviations for the Answers of Mathematics Teachers on the Statements of the Questionnaire
Number Statement Mean Standard Deviation
1 I prefer using a smart board instead of the traditional board. 4.61 0.52 2 Using a smart board enhances students' motivation for learning mathematics. 4.57 0.63
3 I am able to do many things on the smart board such as making slide shows,
using the internet, and drawing pictures. 4.38 0.59
4 Students have more fun when I use the smart board. 4.36 0.68 5 Using a smart board helps me in introducing the lesson. 4.35 0.47 6 A smart board can be used in teaching mathematics for different grades. 4.28 0.73 7 Teachers may waste time when using a smart board. 4.21 0.68 8 With using a smart board, students are able to stay on task better. 4.15 0.92 9 Using a smart board enhances the students' achievement in mathematics. 4.12 0.75
10 Using a smart board helps me in maintaining the attention of the students
toward new lessons. 4.11 0.64
11 I feel more self-confident when I use the smart board. 4.07 0.83
12 Using a smart board enhances the students' ability of solving mathematical
problems. 4.03 0.95
13 Using a smart board enhances the students' mathematical thinking. 3.95 0.87
14 Students participate more in class when the smart board is used in teaching
Table 1 cont.
15 Visual representation on the smart board made it easier for the students to
understand and remember information. 3.86 0.91
16 Using a smart board helps me in taking care of the individual differences
between students. 3.81 1.05
17 Using a smart board allows students to be more creative. 3.78 0.71
18 Using a smart board helps me in implementing the planned teaching methods
to achieve goals. 3.74 0.93
19 I can't use a smart board; I am not well trained. 3.72 0.88
20 Using a smart board helps me in organizing and managing the planned time
for each teaching activity. 3.69 0.83
21 Using a smart board may not suit all mathematical topics. 3.61 0.65 22 I don't face trouble manipulating the smart board; it is easy to use. 3.55 0.84
23 Using a smart board helps me in assessing the students' learning in
mathematics. 3.53 0.81
24 The smart board is a useful tool during group work. 3.42 0.96 25 The smart board always needs to be fixed and this takes time. 3.36 0.78
The questionnaire as a whole 3.97 0.89
The results in Table 1 indicate that the mathematics teachers have positive attitudes toward using a smart board in teaching mathematics, where each statement of the questionnaire – and the questionnaire as a whole – obtained a mean greater than (3).
2. Question #2: Are there statistically significant differences in the attitudes of mathematics teachers due to their gender (male, female)?
To answer this question, the means and standard deviations were calculated due to gender variable; then a T-test for independent variables was used. The results are illustrated in Table 2.
Table 2: Means, Standard Deviations and T-Test According to Gender Variable
Gender Number Mean Std. Deviation Degree Of Freedom Value Of (T) Statistical Significance
Male 35 3.92 0.72
72 0.551 0.374
Female 39 4.01 0.68
Table 2 shows that there is no statistically significant difference due to gender variable, where calculated (T) has no statistical significance at the level of significance (α = 0.05).
3. Question #3: Are there statistically significant differences in the attitudes of mathematics teachers due to their experience (five years or less, above five years)?
To answer this question, the means and standard deviations were calculated due to experience variable; then a T-test for independent variables was used. The results are shown in Table 3.
Table 3: Means, Standard Deviations and T-Test According to Experience Variable
Experience Number Mean Std. Deviation Degree Of Freedom Value Of (T) Statistical Significance Five years or less 43 4.28 0.65
72 3.871 0.001*
Above five years 31 3.54 0.91 * Of statistically significant at α ˂ 0.05
4. Question #4: Are there statistically significant differences in the attitudes of mathematics teachers due to their qualification (bachelor degree, master degree)?
To answer this question, the means and standard deviations were calculated due to qualification variable; then a T-test for independent variables was used. The results are illustrated in Table 4.
Table 4: Means, Standard Deviations and T-Test According to Qualification Variable
Qualification Number Mean Std. Deviation Degree Of Freedom Value Of (T) Statistical Significance Bachelor degree 48 3.75 0.83
72 3.216 0.003*
Master degree 26 4.38 0.79 * Of statistically significant at α ˂ 0.05
Table 4 shows that there is a statistically significant difference due to qualification variable, where calculated (T) has statistical significance at the level of significance (α < 0.05). This difference is in favor of master’s degree teachers. Results show that master’s degree teachers had a higher mean than bachelor degree teachers (4.38 and 3.75, respectively). This indicates that qualification has an effect on teachers' attitudes.
CONCLUSION
Results showed that mathematics teachers have positive attitudes toward using a smart board in teaching mathematics and they prefer using it instead of a traditional board.
Since the smart board is a new technology, teachers face many challenges in the classroom because of lack of training on the right way to use it and due to lack of clear information of the benefits of using a smart board. Recently there has been a good movement toward encouraging teachers to make use of this vital and valuable technology.
AUTHOR INFORMATION
Dr. Wafa Muhanna is Assistant Professor of education technology working at Al al-Bayt University in Jordan and is interested in writing in many fields, such as using technology in the classroom, teaching strategies, and assessment strategies. Dr. uhanna participated in any international conferences in erica and urope. E-mail: [email protected] (Corresponding author)
Dr. Khamis Mousa Nejem is Associate Professor of Curricula and Teaching Methods of Mathematics, working at Al al-Bayt University in Jordan. He is interested in curriculum and instruction and has published many papers in international journals. E-mail: [email protected]
REFERENCES
1. Bell, . . (2002). Why use an interactive whiteboard? baker’s dozen reasons! Teachers Net Gazzette, 3(1). Retrieved from http://teachers.net/gazette/JAN02/mabell.html
2. Brush, T., & Bannon, S. (1998). Characteristics of technology leaders: A survey of school administration in the United States. International Studies in Educational Administration, 26(2), 47-56.
3. Burden, K. (2002). Learning from the bottom up – the contribution of school based practice and research in the effective use of interactive whiteboards for the FE/HE sector. Retrieved from
www.lsda.org.uk/files/lsda/regions/8_Bio_KBurden.pdf
4. Carbonara, D. (2005). Technology literacy applications in learning environments. London, UK Informa-tion Science Publishing.
5. Carpenter, E. (2007). Challenges Faced When Using Smart Boards in the Classroom. eHow Contributor. Retrieved from http://www.ehow.com/info_8482641_challenges-using-smart-boards-classroom.html 6. Hall, I. & Higgins, S. (2005). Pri ary school students’ perceptions of interactive whiteboards. Journal of
7. Hall, K., Higgins, S. & Smith, H. (2005). The visual helps me understand the complicated things: Pupil views of teaching and learning with interactive whiteboards. BritishJournal of Educational Technology, 36,851–867.
8. Knezek, G., Christensen, R., Bell, L., & Bell, G. (2006). National technology leadership summit re-port: Identifying key research issues. Learning and Leading with Technology, 33(8), 18-23.
9. Manitoba Education & Training. (1998). Technology as a foundation skill area: A journey toward
information technology literacy. Retrieved from http://www.edu.gov.mb.ca/k12/docs/support/tfs/index.html 10. Miller, D. & Glover, D. (2002). The interactive whiteboard as a force for pedagogic change: The
experience of five elementary schools in an English Education Authority. Information Technology in Childhood Education Annual, 14, 5–19.
11. National Council for the Accreditation of Teacher Education (NCATE). (2008). Professional standards for the accreditation of schools, colleges, and departments of education. Washington, DC: NCATE.
12. Oigara, J. N., & Keengwe, J. (2011). Pre-service teachers and technology integration with smart boards. Journal of Information Communication and Technology Education, 7(4), 84-92.
13. Oigara, J. N. (2010). Integrating tools of technology into teaching social studies methods courses: A class-room example, In D. Gibson & B. Dodge (Eds.).Proceedings of Society for Information Technology & Teacher Education International Conference (pp. 3682-3684). Chesapeake, VA: AACE.
14. Rakes, G. C., Flowers, B. F., Casey, H. C., & Santana, R. (2006). Analysis of instructional technology use and constructivist behaviors in K-12 teachers. International Journal of Educational Technology, 1(12). 15. Reimer, K. & Moyer, P.S. (2005). Third-graders learn about fractions using virtual manipulatives: A
classroom study. Journal of Computers in Mathematics and ScienceTeaching, 25,5–25.
16. Roschelle, J., Pea, R., Hoadley, C., Gordin, D., & Means, B. (2000). Changing how and what children learn in school with computer-based technologies. The Future of Children: Children and Computer Technology, 10(2), 76-101.
17. Rudd, T. (2007). Interactive whiteboards in the classroom. Retrieved from www.futurelab.org.uk/events/listings/whiteboards/report
18. Sani, R. (2007). Creative means to bridge old and new teaching.Arizona State University. Retrieved from http://tnt.asu.edu/files/Smartboards_Newsletter_Aug.pdf
19. Shenton, A. & Pagett, L. (2007). Fro ‘bored’ to screen: The use of the interactive whiteboard for literacy in six primary classrooms in England. Literacy, 41(3),129-136.
20. Siemens, G., & Matheos, K. (2010). Systemic changes in higher education. Education: Technology & Social Media (Special Issue, Part 2), 16(1). Retrieved from http://www.ineducation.ca
21. Smart Technologies Inc. (2004). Interactive whiteboards and learning: A review of classroom case studies and research literature. Retrieved from http://www.smarterkids.org/research