Themed Section: Science and Technology
Development of Integrated Geographic Database for Water
Quality Analysis
Dr. Anuj Kumar Purwar
Assistant Professor, School of Engineering and Technology IGNOU, New Delhi, India
ABSTRACT
Ground water is source for water supply in many parts of the world catering to the requirements of one third of global population. In fact, the declining status of global fresh water resources both in terms of quantity and quality may prove to be the dominant issue on the environment and development agenda of the coming century. To provide safe drinking water, it is required to plan and design a project with economy and safety. Planning is all about dealing with various kinds of data, to analyze them and to make a suitable decision. Present work is generation of GIS based database for water quality parameters of Allahabad city. At any time, if one wants to update this data, it could be done by directly overwriting the old data. The attribute data table of a particular feature is then linked to its corresponding location in the shapefiles. Thus, the water quality parameters are now linked to each location of hand pump as well as to the tube well sampling locations as attributes as well as for water treatment plant and clear water reservoir.
Keywords: Water quality, Spatial data, Non spatial data
I.
INTRODUCTION
It is common knowledge that fresh water, a finite and fragile resource is increasingly becoming scarce day-by-day. One third of the world’s population is already living in countries with moderate to high water stress, where water consumption is more than 10 percent of the renewable fresh water supply. Nearly 20 percent of the world’s population lack access to safe drinking water and around 50 percent adequate sanitation. The problems are most acute in Africa and West Asia; besides it is a major constraint in the overall socio-economic growth in many countries including China, India and Indonesia. Similarly, degradation of water quality to abnormal levels over a period of time is a challenging problem. Even in a developed country like United States, it is reported that in 1994, 40 million people consumed water with high nitrate content (Daniel, 2001). Ground water is source for water supply in many parts of the world catering to
the requirements of one third of global population. Over extraction of ground water has also affected its quality leading to saline ingress in coastal areas as in case of Oman, Bahrain, and India. It is reported that biological contamination in the form of the fecal coliform count in Asia’s rivers is 50 times higher than the WHO guidelines making the local population vulnerable to high risk level. In fact, the declining status of global fresh water resources both in terms of quantity and quality may prove to be the dominant issue on the environment and development agenda of the coming century.
1.1 Integrated Database and Water Quality
and bring out the hidden message in it. Efforts are having been made continuously to provide effective tools to sort out a proper and economical decision for any proposal or project. Since the invention of computers, considerable work has been done in this direction. Today there are many powerful computer related tools as different software packages and CAD/CAM technologies. Technological revolution has provided a new dimension to the information systems, which led to the emergence of new specialized branch of knowledge and computer networks. There has been a rapid development in the field of geographic information science. Geographic Information System (GIS) provides information on all geographical variables and has a vital role to play in the water related studies. A GIS is a computer based system which is designed to assist decision makers. Typically, such a system will include spatial data relevant to the decision, analytic tools to process the data in ways meaningful for decision makers, and output or display functions (Internet 1).
1.2 Objective of the Present Work
Now-a-days, GIS has become an indispensable tool for monitoring of water quality in an efficient way. In the present work the water quality parameters of three different seasons, namely, winter, summer and monsoon seasons have been used. In particular, the main objective of the present work is generation of GIS based database for water quality parameters of Allahabad city.
II.
STUDY AREA
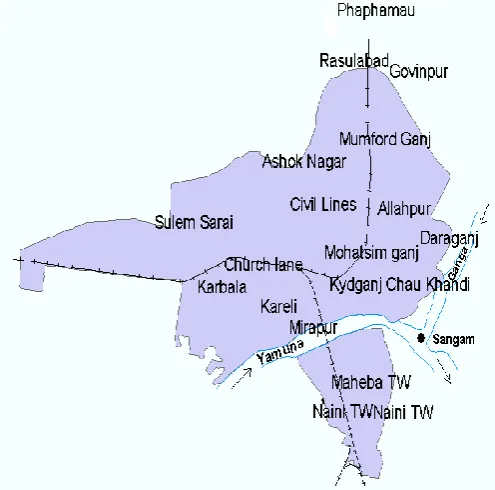
The present study has been carried for Allahabad city which is covered between 25o31’04”N to 25o22’44”N latitudes and 81o55’00”E to 81o54’04”E longitudes. The boundaries of the city are selected from the distribution map available from Jal Sansthan,
considered for present study. Total Area of city is 85.00 sq. km.; population of the city is approximately 10, 49,579 people (as per 2001 census) and altitude of city is 98 meters above sea level. The maximum temperature reaches the mark of 45.6oC and minimum temperature 1.1oC. The annual average rainfall is 1935.5 mm. The study area along with locations of water sampling is shown in Figure1.
Figure 1. Study Area
2.1 Collection of Data
2.2 Geo referencing of the Maps
The various maps collected were scanned at 300 dpi. The ArcGIS 8.3 software has been used for present study. Registering a map is first step towards generating a database. After registration of a map, it fits into its real world coordinate and gives us real distances and relative locations of various places. In this process, maximum numbers of control points which are well distributed in maps are identified from the paper map and have been used to the scanned map in the ArcMap to register it. Polyconic projection system with India Everest as datum has been used because the same system has been adopted by Survey of India.
2.3 Spatial Database Creation
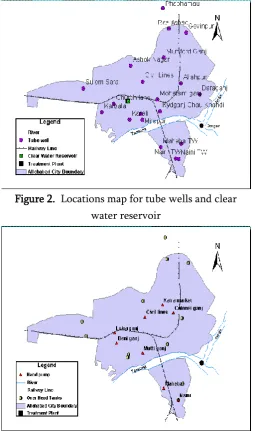
On-screen digitization process is used for the creation of spatial database. Firstly, shapefiles have been defined. After defining the various shapefiles, type of geometry is defined for a feature class. The geometry types are Point, Line, Polyline and Polygon. All these work are carried out in arc Catalog. In the process of vectorization, an ID number is assigned for joining or relating the attribute table with the corresponding spatial feature present on the map. The various features digitized include overhead tanks, tube wells, hand pumps, railway line, city boundary and rivers,
etc. Figure 2 and Figure 3 showing digitized features.
Figure 2. Locations map for tube wells and clear water reservoir
Figure 3. Hand pumps and overhead tanks locations
2.4 Non-spatial Database Creation
III.
RESULTS
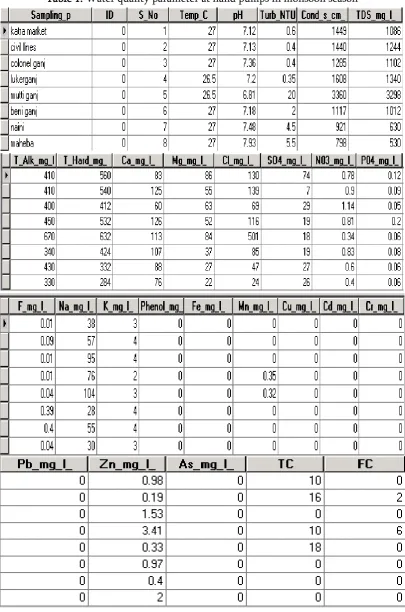
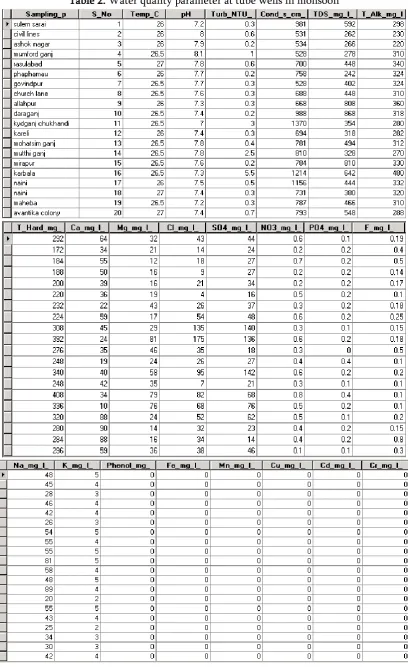
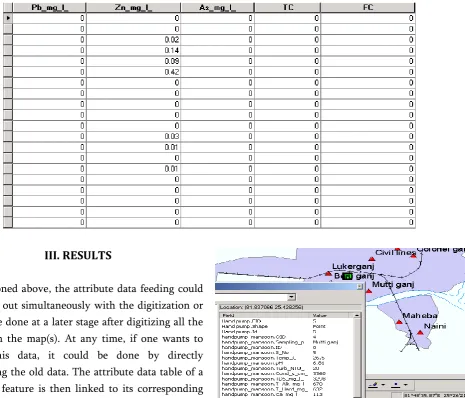
As mentioned above, the attribute data feeding could be carried out simultaneously with the digitization or it could be done at a later stage after digitizing all the features in the map(s). At any time, if one wants to update this data, it could be done by directly overwriting the old data. The attribute data table of a particular feature is then linked to its corresponding location in the shapefiles. Thus, the water quality parameters are now linked to each location of hand pump as well as to the tube well sampling locations as attributes as well as for water treatment plant and clear water reservoir. In this way, the integrated geographic database is prepared for Allahabad city for further analysis of water quality. In Figure 4 and Figure 5, the attributes for water quality parameters are shown for Mutthiganj and Ashoknagar area.
Figure 4. Quality parameter values of hand pumps of Mutthiganj
IV.
CONCLUSIONS
In the present work, an integrated geographic database has been created using GIS consisting of water quality parameters of Allahabad city. The GIS based evaluation have given the spatial, graphical and statistical representation of groundwater and surface water parameters for assessing the quality of water for drinking purpose in Allahabad city.
V.
REFERENCES
[1]. Anbazhgan, S. and Nair, Archana M. (2004),
"Geographic Information System and
Groundwater Quality Mapping in Panvel Basin, Maharashtra, India", J. of Environmental Geology, Vol.45, No.5, pp: 753-761.
[2]. Bhargava, Devendra Swaroop (1985),
"Expression for Drinking Water Supply Standards", J. of Environmental Engineering, ASCE, Vol.111, No.3, pp: 304-316.
[3]. Biswas, K. Dilip (2003), "Water Quality Management –A National Concern", A Report from Central Pollution Control Board Delhi. [4]. Daniel, A. Okun (2001), "Principle for Water
Quality Management", J. of Environmental Engineering, ASCE, Vol.103, No.6, pp: 1039-1055.
[5]. Dinius, S. H. (1972), "Social Accounting System for Evaluating Water Resources", J. of Water Resources Research, Vol.8, No.5, pp: 1159-1177. [6]. Garg Santosh Kumar (2002), "Water Supply
Engineering", Khanna Publishers, Delhi, pp: 425-429.
[7]. Internet 1: http://www.gisdevelopment.net [8]. Internet 2: http://www.gis.com
[9]. Internet 3:
http://kancrn.org/stream/cp4wqi.cfm.
[10]. Landwehr, J. Maciunas and Deinger, R. A. (1976), "A Comparison of Several Water Quality Indexes", J. of Water pollution Control Fed., Vol.48, No.5, pp:954-958.
[11]. Nawlakhe, W. G., Lutade, S. L., Patni, P. M. and Deshpande, L.S. (1995), "Groundwater Quality in Shivpuri District in Madhya Pradesh", Indian J. Environ. Health, Vol.37, No.4, pp: 278-284. [12]. Prabhakar, T. Clement (1998), "Remediation of
Contaminated Ground Water– Lessons from U.S.A.", J. of Indian Water Works Association, Vol. 8, No.2, pp: 241-247.
[13]. Ramaraju, H. K. (2003), "Water Quality Assessment and Mapping in Pilot Districts of ‘Jal Nirmal’ Project, Karnataka, India", J. of Indian Water Works Association, Vol. 9, No.3, pp: 223-227.
[14]. Rekha, V. G. (1993), "Water Quality Survey of Allahabad City (Eastern Part)", M.E. Thesis, M.N.R.E.C., Allahabad.
[15]. Roy, O. Ball and Richard, L. Church (1980), "Water Quality Indexing and Scoring", J. of Environmental Engineering, ASCE, Vol.106, No.4, pp: 757-771.
[16]. Samuels, William B. (1993), "Lakemap: A 2-D
and 3-D Mapping Systems for Visualizing Water Quality Data in Lakes", Water Resources
Bulletin, American Water Resources