Exploring a Service-Based Normal Behaviour
Profiling System for Botnet Detection
Weikeng (Robin) Chen Faculty of Computer Science
Dalhousie University Halifax, NS, Canada, B3H 1W5
Email: [email protected]
Xiao Luo
Purdue School of Engineering and Technology IUPUI
Indianapolis, IN, USA 46202 Email: [email protected]
A. Nur Zincir-Heywood Faculty of Computer Science
Dalhousie University Halifax, NS, Canada, B3H 1W5
Email: [email protected]
Abstract—Effective detection of botnet traffic becomes difficult as the attackers use encrypted payload and dynamically changing port numbers (protocols) to bypass signature based detection and deep packet inspection. In this paper, we build a normal profiling-based botnet detection system using three unsupervised learning algorithms on service-based flow-based data, including
self-organizing map, local outlier, and k-NN outlier factors.
Evaluations on publicly available botnet data sets show that the proposed system could reach up to 91% detection rate with a false alarm rate of 5%.
I. INTRODUCTION
The convenient and rapid Internet access not only facilitates many Internet services, but also accelerates the spreading of malicious software and making the detection efforts very difficult. One type of malicious software that takes the ad-vantage of the Internet is a botnet, which spreads itself to other machines (via e-mail, OS vulnerabilities, etc), conducts resource-exhaustion attacks like such as Distributed Denial of Service (DDoS) and steals user data. The detection on network traffic is critical in preventing botnet spreading, but has some challenges. One of those challenges is the exis-tence of encrypted normal traffic, including encrypted web services such as social media (Facebook, Twitter) and VoIP (Voice over IP). Consequently, botnets can hide their payload characteristic by encryption. Furthermore, dynamic ports and change of protocols enable botnets to bypass signature-based firewalls and intrusion detection systems (IDS). For robust detection systems, several [1] [2] [3] flow-based botnet detec-tion approaches have been proposed without packet payload information.
The analysis on known botnets shows that they have varying network access patterns, including single-packet information (e.g. layer-4 protocol) and flow-based statistical information (e.g. numbers of packets per flow). Moreover, some botnets have specific purposes that could be customized by the owners and are unconventional. Thus, anomaly based IDS on the normal traffic behaviors attract more attention from researchers [4] [5] to detect both known and unknown botnets.
In this paper, we employ three unsupervised learning algo-rithms namely self-organizing map (SOM), local outlier factor (LOF), and k-NN outlier (k-NN Outlier) factor to build a normal behaviour profiling system for detecting and analyzing
different botnet behaviours. SOM provides visualization of the clustering distribution in two-dimensional space. LOF and
k-NN Outlier algorithms are two instance based clustering algorithms that are shown to work well in the literature [6] [7] anomaly detection which also uses only normal behaviour for training as our proposed system. In our proposed approach, the normal traffic data are separated by services to build service-specific sub-detectors, and the botnet detection is conducted by these sub-detectors. Our evaluations on publicly available normal and botnet traffic data sets show that the proposed system achieves over 91% for detection rate.
The rest of paper is organized as follows. The related work is summarized in Section II. The system framework and unsupervised algorithms are introduced in Section III. Section IV presents the experiments and results. Finally, conclusions are drawn and the future work is discussed in Section V.
II. RELATEDWORK
Many researches have been conducted in botnet detection. Gu et al. in [1] demonstrated a botnet detection framework called BotMiner, which used A-Plane to monitor system logs to detect host-based attacks and the C-Plane to monitor the network traffic to detect network-based attacks. The system was tested on IRC, HTTP and P2P botnet traffic and had 75%-100% detection rate and less than 0.03% false positive rate. Feilyet al.[8] surveyed botnet behaviours and detection techniques, and classified them to four categories: signature-based, anomaly-signature-based, DNS-signature-based, and mining-based. Zhang
et al. [9] focused on two botnet mechanisms: Fast Flux and Domain Flux, while they are not flow-based. Mai and Park compared three unsupervised learning algorithms based on network flows [2]. The best detection rate of 97.11% was achieved by K-means learning algorithm. However, the false alarm rate was not given. Yin et al. [10] investigated neural network and genetic algorithms for botnet detection using their own captured flow-based data set. They reported a detection rate of 95.7% and false alarm rate of 4.3%. Al-Jarrah et al.
proposed a system based on data randomization and cluster-based partitioning [11]. They achieved the best detection rate of 99.42% on the ISOT benchmark data set. Haddadi
et al. proposed different aspects of their flow based botnet detection system using supervised learning algorithms [3].
___________________________________________________________________ This is the author's manuscript of the article published in final edited form as:
Chen, W., Luo, X., & Zincir-Heywood, A. N. (2017). Exploring a service-based normal behaviour profiling system for botnet detection. In 2017 IFIP/IEEE Symposium on Integrated Network and Service Management (IM) (pp. 947–952). https://doi.org/10.23919/INM.2017.7987417
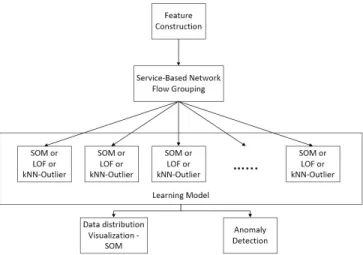
Fig. 1. Service-Based Normal Behaviour Profiling System framework
They achieved detection rates up to 100% with low false alarm rates. Liuet al.proposed an anomaly detection system named ‘Opprentice’ by making use of supervised learning algorithms and KPI features [12].
In summary, to the best of our knowledge, none of the above works have tested normal behaviour profiling using unsuper-vised learning algorithms and service based construction on network traffic flow data.
III. SYSTEM FRAMEWORK AND LEARNING ALGORITHMS Figure 1 shows the service-based normal behaviour profiling system for botnet detection, which has three components: (i) feature construction; (ii) model building and learning; (iii) data visualization and anomaly detection. In the feature construction component, all the traffic flows1 are grouped by
the destination port numbers. For example, normal traffic to destination port 53 is typically a DNS request. This type of traffic is different from the network flows with the destination port number 80, i.e. HTTP requests. Hence, all the flows are put into 13 groups (detailed in following). In the proposed sys-tem, each group has its specified sub-detector. Sub-detectors are constructed based on one of the unsupervised learning algorithms, which are detailed in the following subsections.
Note that the proposed system uses only normal traffic flows in the training phase, that is why it is a normal behaviour profiling system. In this work, we aim to explore how far we can push an unsupervised learning system towards botnet detection without using any attack traffic during the training phase.
In our approach, the boundaries (in the clustering/grouping of data) are used to differentiate botnet traffic from normal traffic. Boundaries are based on the distribution of normal traffic. They represent the threshold of the distance from nor-mal clustering/grouping in unsupervised learning algorithms. When testing the model on unforeseen traffic flows, if the 1Traffic flow is defined as a logical equivalent for a call or a connection in association with a user specified group of elements [13]. The most common way to identify a traffic flow is to classify the 5-tuple from the packet header.
new flow is within the boundary, it is classified as normal, otherwise as suspicious (attack).
A. Self-organizing map (SOM)
Self-organizing map is an unsupervised clustering algorithm proposed by Kohonen [14]. SOM has been widely used for intrusion detection [15], [16], [17]. One of the advantages of SOM is the reduction and visualization to two-dimensional plane of the multidimensional input data.
SOM has three training steps: sampling, similarity match-ing, updating. These three steps are repeated until the map converges (or reaches the defined epochs). Each neuroni has a d-dimensional weight vector Wi = {Wi1, Wi1, ..., Wid}. GivenX as ad-dimensional input sample vector, the algorithm is described as the following:
• Initialization: Choose random values to initialize all the weight vectors Wi(0), i = [1, M]∩Z where M is the total number of neurons in the self-organizing map. • Sampling: Choose a sample dataX from the input space
following an order (e.g., randomized before sampling). • Similarity Matching: For each sample X, find the best
matching unit (BMU), i.e. winner neuron ofX, denoted here byb. The BMU is the neuron to X with minimum Euclidean distance, at time stepn(nthtraining iteration), Eq. 1.
b= arg min
i ||X−Wi(n)||, i= [1, M]∩Z (1) • Updating: Adjust weight vectors of all neurons, Eq. 2.
Wi(n+ 1) =Wi(n) +η(n)hb,i(n)(X−Wi(n)) (2)
Whereη(n)denotes the learning rate of thenthtraining iteration andhb,i(n)is the selected neighbourhood kernel function centred on the winner neuron for SOM. • Continuation: Continue until the SOM map converges or
reached the defined maximum training epochs N. In this work, we used a 10x10 SOM for each sub-detector and linked distance as the neighbourhood kernel function. The outlier factor from SOM is a weighted sum denoted by the distance to the first, second, and third BMUs, Eq 3.
SOF(A) =||A−WBMU(n)||
+ 0.5× ||A−WBMU−2nd(n)||
+ 0.3× ||A−WBMU−3rd(n)|| (3)
B. Local outlier factor (LOF)
LOF is an unsupervised learning algorithm that detects outliers in a given data set. LOF is proposed by Breuniget al.
[18] and has been used for intrusion detection in the literature [6] [7]. LOF works by first calculating the local reachability density of an instanceAto itskth nearest neighboursNk(A) using Eq. 4. lrd(A) = 1/ P B∈Nk(A)reachableDistk(A, B) |Nk(A)| (4)
The reachable distance reachableDistk(A, B) is calculated using Eq. 5, where kDist(B)is the distance of B to its kth neighbour and d(A, B)is the distance betweenAandB.
reachableDistk(A, B) = max{kDist(B), d(A, B)} (5) The LOF is computed with the local reachability density of an instance Aand that of its neighbours using Eq. 6.
LOF(A) =
P
B∈Nk(A)lrd(B)
|Nk(A)|
/lrd(A) (6) The larger LOF means the higher probability of being an outlier. In this work, kis set to 3 (empirically) in the tests.
C. k-NN outlier
Thek-NN outlier is an instance-based unsupervised learning algorithm with the concept of k-nearest-neighbour (KNN). It was first introduced by Ramaswamy et al. [19] for mining outliers from large data sets. The outlier uses the the distance of an instance to the kth neighbour, calculated according to Eq. 7, wherekDist(A)is the distance of instanceAto thekth neighbour.
KOF(A) =kDist(A) (7) If an instance has large kNN value, it is likely to be an outlier.k-NN outlier has been evaluated for intrusion detection in the literature [7]. To be consistent with LOF, k is set to 3 in the following experiments.
IV. EXPERIMENTALSETUPS ANDRESULTS
We evaluated the proposed system based on the aforemen-tioned unsupervised learning algorithms using CTU-13 data sets. These were captured at CTU and made publicly available [20].
A. CTU-13 data set
CTU-13 has 13 different datasets, each one is specified for a botnet, and in total 7 botnet malwares are analysed [21]. The botnet activities include email spam, click fraud, and DDoS. CTU labelled the traffic as: Background, Botnet, C&C Channels and Normal. In our work, the most frequent 11 destination port numbers are used to group the TCP/UDP flows, and the rest of the TCP/UDP and ICMP flows are grouped into two additional groups, respectively. Table I summarizes of the traffic flows based on different services using destination port numbers.
B. Feature preprocessing
We select 8 out of 14 features from the CTU-13 data set that are listed in Table II. They are regarded as basic features. Additionally, we introduce eight new derived features.
Based on the numerical distribution of features, such as duration, we observed that most flows have shorter duration than 350 seconds. However, there are still some flows with extremely long duration more than 3000 seconds.
TABLE I
SUMMARY OF THEDATASETSBASED ONDIFFERENTNETWORK
SERVICES
Port IANA # of normal # of botnet number registered flows flows
TCP/UDP 53 X 222,516 145,920 80 X 100,495 26,546 443 X 21,331 34,268 27015 2,325 2 123 X 1,406 49 27016 358 0 27017 286 1 27031 266 1 5222 X 184 0 8950 178 0 27018 170 0 Others - 3,316 122,912 ICMP - - 3,292 114,997 TABLE II FEATURES OFCTU-13DATA
Features Description
Duration Duration of the connection in seconds Protocol Type of the protocol (TCP, UDP, ICMP)
DPort The port of the connection destination dTos Type of Service from destination to source SrcBytes Total bytes from source to destination TotBytes Total bytes of the flow
TotPkts Total packets of the flow
Dir Direction of the flow
Derived Features
BytesPerPkt Average bytes per packet SrcBytesRatioPerFlow Ratio of SrcBytes within TotBytes
Duration1 Minimal value of Duration and threshold
Duration2 Log value of Duration
TotBytes1 Minimal value of TotBytes and threshold
TotBytes2 Log value of TotBytes
SrcBytes1 Minimal value of SrcBytes the threshold
SrcBytes2 Log value of SrcBytes
TotPkts1 Minimal value of TotPkts the threshold
TotPkts2 Log value of TotPkts
In order to emphasize the differences in durations after the normalization, instead of the original duration (DurationO), we derived two features (Duration1 andDuration2). The derived features are calculated using Eq. 8 and 9. Eq. 8 aims to present the long durations using a threshold (DurationT). On the other hand, Eq. 9 aims to show the differences of those short durations.
Duration1= min(DurationO,DurationT) (8)
Duration2= log(DurationO) (9) We used a similar approach to derive new features to represent: total bytes, total packets, and source bytes.
C. Traffic distribution for different services
After training the SOM map using the normal traffic data, we used U-Matrixes and Hit Histograms of SOM models to visualize the data distributions of different services. Generally, port 80 and 443 are ports associated with web traffic. Port 443 is associated with HTTPS, which is the secure (encrypted) HTTP protocol over TLS/SSL, and Port 80 is associated with
Fig. 2. Value Distribution of Durations for the traffic on Port 443
Fig. 3. Value Distribution of Durations for the traffic on Port 80
unencrypted HTTP traffic. Fig. 2 and 3 show the U-Matrix on port 443 and 80. The lighter the colour of the hexagon becomes, the shorter the distance is.
Based on the U-Matrixes and the hit histograms, we can see that the distribution of the traffic on port 443 and port 80 are different. The fact that flows for Port 443 (HTTPS) is more centred It supports the assumption that different types of normal traffic flows behave differently. The different behaviors might be caused by the different amount of data and durations in the traffic flows.
D. Outlier decision boundary calculation
The assumption of this work is that botnet (malicious) traffic flows vary from different normal traffic flows. Moreover, we assume that botnet flows are outliers compared to the nor-mal traffic flows. The three unsupervised learning algorithms provided an outlier factor. Hence we need to identify an outlier decision boundary, which can be selected based on the distribution of the normal traffic.
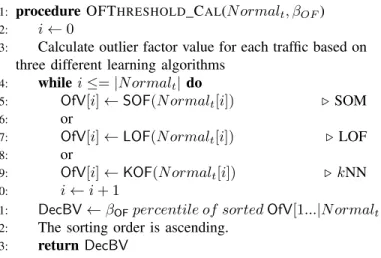
In particular, the instances in the boundary are regarded as normal (in our prediction), otherwise as suspicious traffic, i.e. potential attacks to report to the system administrators. We use a na¨ıve decision boundary calculation based on outlier factors in normal training data. With a training set of normal traffic for a specific service (Normalt), the outlier factor value (OfV) is calculated for each normal traffic instance (flow). Then, the decision boundary value is set to the value of the
βOFpercentile of the outlier factor values of all normal traffic flows during training. For example, ifβOFis set as 85%, then 15% of normal (training) traffic flows are regarded as false positives. The algorithm which is used to calculate the outlier decision boundary (DecBV), is given in Fig. 4.
In our work, the SOM outlier factor of instance i is the
1: procedure OFTHRESHOLD CAL(N ormalt, βOF)
2: i←0
3: Calculate outlier factor value for each traffic based on three different learning algorithms
4: whilei≤=|N ormalt|do
5: OfV[i]←SOF(N ormalt[i]) . SOM
6: or
7: OfV[i]←LOF(N ormalt[i]) .LOF
8: or
9: OfV[i]←KOF(N ormalt[i]) . kNN
10: i←i+ 1
11: DecBV←βOFpercentile of sortedOfV[1...|N ormalt|]
12: The sorting order is ascending. 13: returnDecBV
Fig. 4. Algorithm for the outlier factor threshold calculation
weighted sum of distances to its first, second, and third BMUs, as Eq. 3. The weights are 1, 0.5, and 0.3, respectively. For the LOF andk-NN, the outlier factors are from Eq. 6 and 7, respectively.
Note that our proposed approach is service-based, the value
DecBVvaries for each service group of flows.
E. Botnet detection results and discussion
In our evaluations, we used 70% of the normal flows for training and the remaining 30% of the normal flows and all botnet flows for testing. We did not use the flows labelled as “Background” traffic, given that the ground truth for those flows are unknown. We use the metrics of false positive rate (FPR) and detection rate (DR) to evaluate the performance of the proposed system according to Eq. 10 and 11.
F P R= N umber of N ormal Detected as Attack
T otal N umber of N ormal Connections (10) DR= N umber of Detected Attacks
T otal N umber of Attack Connections (11)
In this work, we experimented with the βOF value from 1% to 15%. Table III and IV shows the DR and FPR results of all three learning algorithms given different values of
βOF based on with and with out derived features. Based on these results, k-NN outlier performs better than others in both scenarios. Without derived features, the detection rate is much lower, although the false positive rates are similar. With derived features, the proposed system achieved around 91% of detection rate with 5% false alarm rate (given that it is a normal profiling system).
As our proposed system is service-based normal profiling, we also investigate the performance on each service-based group. Fig. 5-10 show the performances of three unsupervised algorithms on different services where there is botnet traffic in the testing sets. It shows that all algorithms perform well on ICMP traffic flows, with approximately 100% detection rate and about 1% false positive rate. The detection rate of the botnet flows on port 80 and 53 does not increase with higherβOFvalue. We assume that the reason behind is that the
0 5 10 15 0 20 40 60 80 100 D e t e c t io n R a t e ( % ) 1-OF (%) Port 53 Port 80 Port 443 Port 27015 Port 123 Port 27017 Port 27031 ICMP Other Ports
Fig. 5. Detection rates of SOM outlier
0 5 10 15 0 20 40 60 80 100 Port 80 Port 53 Port 443 Port 27015 Port 123 Port 27017 Port 27031 ICMP Other Ports D e t e ct i o n R a t e ( % ) 1-OF (%)
Fig. 6. Detection rates of LOF outlier
0 5 10 15 0 20 40 60 80 100 D e t e ct io n R a t e ( % ) 1-OF (%) Port 53 Port 80 Port 443 Port 27015 Port 123 Port 27017 Port 27031 ICMP Other Ports
Fig. 7. Detection rates ofkNN outlier
0 5 10 15 0 5 10 15 20 25 F a l se P o si t i ve R a t e ( % ) 1-OF (%) Port 53 Port 80 Port 443 Port 27015 Port 123 Port 27017 Port 27031 ICMP Other Ports
Fig. 8. False positive rates of SOM outlier
0 5 10 15 0 5 10 15 20 25 F a l se P o si t i ve R a t e ( % ) 1-OF (%) Port 53 Port 80 Port 443 Port 27015 Port 123 Port 27017 Port 27031 ICMP Other Ports
Fig. 9. False positive rates of LOF outlier
0 5 10 15 0 5 10 15 20 25 F a lse P o si t ive R a t e ( % ) 1-OF (%) Port 53 Port 80 Port 443 Port 27015 Port 123 Port 27017 Port 27031 ICMP Other Ports
Fig. 10. False positive rates ofkNN outlier
TABLE III
OVERALLEVALUATIONRESULTS WITHOUTDERIVEDFEATURES
βOF(%) DRSOMFPR DRLOFFPR kDR-NN OutlierFPR
15 78.9 15.2 61.6 16.8 75.5 15.0 14 77.6 14.2 60.8 15.7 75.0 14.0 13 76.5 13.2 60.0 14.6 73.3 13.0 12 75.8 12.2 57.2 13.4 64.5 12.0 11 73.9 11.2 55.6 12.1 64.0 11.0 10 72.6 10.2 54.0 11.0 63.7 10.1 9 46.6 9.1 52.8 9.7 63.1 9.0 8 44.7 8.1 51.0 8.6 62.5 8.1 7 42.9 7.0 24.0 7.3 61.6 7.1 6 41.4 6.0 22.5 6.2 60.4 6.0 5 40.0 5.1 20.8 5.1 59.3 5.0 4 37.8 4.1 18.7 4.1 57.3 4.0 3 36.5 3.1 15.8 3.1 51.7 3.0 2 36.1 2.2 12.3 2.0 47.7 2.0 1 33.3 1.1 6.9 0.3 40.9 1.0
traffic flows destines to these two port numbers (80 and 53) are sparser than the others. Moreover, k-NN outlier performs the best in this case, on destination port 80 (HTTP) and 53 (DNS) compared to the other two algorithms. On ports 27015, 27017, and 27031, although there are only one or two (see Table I) botnet traffic flows in the test data set, our proposed system is still able to detect this one to two flows under very unbalanced (normal to attack) conditions. In these cases, the detection rate raised to 100% when the false positive rate was around 7% to 8%. Based on the overall results on the CTU-13 dataset,
k-NN Outlier performs better than the other two algorithms in general. However, SOM performs better on the traffic of
TABLE IV
OVERALLEVALUATIONRESULTS WITHDERIVEDFEATURES
βOF(%) DRSOMFPR DRLOFFPR kDR-NN OutlierFPR
15 93.8 15.2 84.4 16.7 98.2 15.0 14 93.3 14.1 83.5 15.8 97.9 14.0 13 92.6 13.2 82.6 14.8 97.6 13.0 12 91.6 12.2 81.6 13.7 97.3 12.0 11 90.9 11.2 80.1 12.6 97.1 11.0 10 89.2 10.2 78.8 11.3 96.8 10.0 9 88.4 9.2 77.3 10.2 96.5 9.0 8 86.5 8.1 74.7 8.9 95.4 8.0 7 84.9 7.1 47.5 7.6 94.1 7.1 6 76.7 6.1 46.2 6.5 92.7 6.1 5 73.2 5.1 38.3 5.3 91.3 5.1 4 69.6 4.1 36.1 4.1 82.1 4.1 3 65.3 3.1 17.7 3.1 78.6 3.1 2 63.2 2.1 14.2 2.0 57.5 2.1 1 44.3 1.1 1.0 0.4 50.8 1.0
some specific port number, such as 27017. This implies that the combination of the algorithms might return better results. The investigation of other unsupervised algorithms and the combinations of the algorithms are left for future work.
V. CONCLUSION ANDFUTUREWORK
In this research, we explored three unsupervised learning algorithms: SOM, LOF and k-NN outlier for service-based botnet detection using normal behaviour profiling. Data sets from CTU-13 have been used to evaluate the proposed system. The overall results show that k-NN outlier performs better than the others. Moreover, SOM provided the advantage of
visualization of data distribution with the SOM U-matrix and hit-histogram.
The detection rates and false alarm rates on CTU-13 data sets showed that without anya prioriknowledge of the botnet attacks, k-NN achieves over 91% detection rate with around 5% false alarm rate. These results show that the derived features we propose seem to improve the performance.
In this work, a na¨ıve decision boundary calculation method is used. For the future work, we plan to employ more robust and adaptive functions to calculate the decision boundary based on the overall distribution of the normal behaviours. The proposed normal profiling system has shown promising performances on 13 different datasets (over 90% detection rate with very low false alarm rates) to detect new suspicious behaviors. Even better performances can be gained by com-bining this system with supervised learning algorithms when there are known anomalies in the traffic. In the future, we also aim to evaluate the system on other traffic datasets, such as SimpleWeb SSH datasets [22] [23] and extend the proposed system to other anomaly detection tasks, as normal profiling is a robust and practical approach for anomaly detection without positive samples.
ACKNOWLEDGMENT
This research is supported partly by the Mitacs Globalink Award and NSERC in Canada and is conducted as part of the Dalhousie NIMS Lab at: https://projects.cs.dal.ca/projectx/.
REFERENCES
[1] G. Gu, R. Perdisci, J. Zhang, W. Lee et al., “Botminer: Clustering analysis of network traffic for protocol-and structure-independent botnet detection.” inUSENIX Security Symposium, vol. 5, no. 2, 2008, pp. 139– 154.
[2] L. Mai and M. Park, “A comparison of clustering algorithms for botnet detection based on network flow,” in2016 Eighth International Conference on Ubiquitous and Future Networks (ICUFN), 2016, pp. 667–669.
[3] F. Haddadi and A. N. Zincir-Heywood, “Benchmarking the effect of flow exporters and protocol filters on botnet traffic classification,”IEEE Systems Journal, vol. 10, no. 4, pp. 1390–1401, Dec 2016.
[4] A. K. Ghosh, A. Schwartzbard, and M. Schatz, “Learning program behavior profiles for intrusion detection.” in Workshop on Intrusion Detection and Network Monitoring, vol. 51462, 1999, pp. 1–13. [5] S. Zuo, “A dynamic normal profiling for anomaly detection,” in2009
5th International Conference on Wireless Communications, Networking and Mobile Computing, Sept 2009, pp. 1–4.
[6] M. Alshawabkeh, B. Jang, and D. Kaeli, “Accelerating the local outlier factor algorithm on a gpu for intrusion detection systems,” in Proceed-ings of the 3rd Workshop on General-Purpose Computation on Graphics Processing Units, ser. GPGPU-3. New York, NY, USA: ACM, 2010, pp. 104–110.
[7] A. Lazarevic, L. Ertoz, V. Kumar, A. Ozgur, and J. Srivastava, A Comparative Study of Anomaly Detection Schemes in Network Intrusion Detection, 2003, pp. 25–36.
[8] M. Feily, A. Shahrestani, and S. Ramadass, “A survey of botnet and botnet detection,” in2009 Third International Conference on Emerging Security Information, Systems and Technologies, June 2009, pp. 268– 273.
[9] L. Zhang, S. Yu, D. Wu, and P. Watters, “A survey on latest botnet attack and defense,” in 2011IEEE 10th International Conference on Trust, Security and Privacy in Computing and Communications, Nov 2011, pp. 53–60.
[10] C. Yin, A. H. Awlla, J. Wang, and Z. Yin, “A novel framework towards botnet detection,” in2015 3rd International Conference on Computer and Computing Science (COMCOMS), Oct 2015, pp. 9–12.
[11] O. Y. Al-Jarrah, O. Alhussein, P. D. Yoo, S. Muhaidat, K. Taha, and K. Kim, “Data randomization and cluster-based partitioning for botnet intrusion detection,”IEEE Transactions on Cybernetics, vol. 46, no. 8, pp. 1796–1806, Aug 2016.
[12] D. Liu, Y. Zhao, H. Xu, Y. Sun, D. Pei, J. Luo, X. Jing, and M. Feng, “Opprentice: Towards practical and automatic anomaly de-tection through machine learning,” in Proceedings of the 2015 ACM Conference on Internet Measurement Conference, ser. IMC ’15. New York, NY, USA: ACM, 2015, pp. 211–224.
[13] “RFC 2722 (October 1999),” http://tools.ietf.org/html/rfc2722. [14] T. Kohonen, “The self-organizing map,”Neurocomputing, vol. 21, no.
13, pp. 1 – 6, 1998.
[15] H. G. Kayacik, A. N. Zincir-Heywood, and M. I. Heywood, “A hierar-chical som-based intrusion detection system,”Engineering Applications of Artificial Intelligence, vol. 20, no. 4, pp. 439 – 451, 2007. [16] P. Lichodzijewski, A. N. Zincir-Heywood, and M. I. Heywood,
“Host-based intrusion detection using self-organizing maps,” in Neural Net-works, 2002. IJCNN ’02. Proceedings of the 2002 International Joint Conference on, vol. 2, 2002, pp. 1714–1719.
[17] S. T. Sarasamma, Q. A. Zhu, and J. Huff, “Hierarchical kohonenen net for anomaly detection in network security,”IEEE Transactions on Systems, Man, and Cybernetics, Part B (Cybernetics), vol. 35, no. 2, pp. 302–312, April 2005.
[18] M. M. Breunig, H.-P. Kriegel, R. T. Ng, and J. Sander, “Lof: Identifying density-based local outliers,”SIGMOD Rec., vol. 29, no. 2, pp. 93–104, May 2000.
[19] S. Ramaswamy, R. Rastogi, and K. Shim, “Efficient algorithms for mining outliers from large data sets,”SIGMOD Rec., vol. 29, no. 2, pp. 427–438, May 2000.
[20] S. Garca, M. Grill, J. Stiborek, and A. Zunino, “An empirical comparison of botnet detection methods,”Computers & Security, vol. 45, pp. 100 – 123, 2014.
[21] S. Garcia, “The CTU-13 dataset. a labeled dataset with botnet, nor-mal and background traffic,” http://mcfp.weebly.com/the-ctu-13-dataset-a-labeled-dataset-with-botnet-normal-and-background-traffic.html. [22] R. Hofstede, L. Hendriks, A. Sperotto, and A. Pras, “Ssh compromise
de-tection using netflow/ipfix,”SIGCOMM Comput. Commun. Rev., vol. 44, no. 5, pp. 20–26, Oct. 2014.
[23] A. Sperotto, R. Sadre, F. van Vliet, and A. Pras,A Labeled Data Set for Flow-Based Intrusion Detection. Berlin, Heidelberg: Springer Berlin Heidelberg, 2009, pp. 39–50.