Quantification and evaluation of customer
travelling experience using quality management
tools
Emile Skuce
Study Leader: Prof. CJ Fourie
Acknowledgements
Various people deserve acknowledgement for the project undertaken. The most deserving persons are; Prof. C.J. Fourie for his guidance and enthusiasm; Pieter Conradie for his much appreciated help and enthusiasm; Taetso Mohlala for his assistance in the early morning survey conducts. All of the commuters who participated in, or gave comments on, the conducted survey. A final thanks to the PRASA team members of the Stellenbosch University who helped in various aspects of the project and the PRASA management team for their cooperation.
Declaration
I, Emile Skuce, hereby declare that all the work done within the final year project and the information stated within the report are true and was done by me. I also state that, all the information used from other sources is referenced accordingly.
ECSA Exit Level Outcomes
The following table includes references to sections and pages in this report where ECSA exit level outcomes are addressed.
Exit level outcome
Section(s)
Page(s)
1. Problem solving 1
3 – 8.2
1 – 2 18 – 42
5. Engineering methods, skills & tools, incl. IT 2.5.1 2.5.8 2.6 2.8 4 – 5.5.2 7 10.2 10.5 – 10.13 6 11 11 – 16 17 23 – 31 37 - 40 45 48 – 54
6. Professional & Technical communication 2.5.3 2.6.4 4 – 5 8 – 9 14 – 16 23 – 32
9. Independent learning ability 2.5.2 – 2.5.5
2 7 – 9 3 - 17 10. Engineering professionalism Declaration 1.2 2.2 2.5.5 2.5.6 3.5 9 iii 2 3 – 4 10 10 20 43
Engineering professionalism and professional communication are shown throughout the project.
Abstract
"There are approximately 3,9 million public transport commuters. The 2,5 million taxi commuters account for over 63 percent of public transport work trips, bus services account for another 22 percent of public transport commuters and the balance are carried to work by train." [arrivealive.co.za, June 2011]. This study was done in 2005, today there are much more train commuters.
The Passenger Rail Agency of South Africa (PRASA)/Metrorail Management in Maintenance Management is a newly established research team in the Department of Industrial Engineering. During an initial planning session, various projects were identified, many ideally suited for final-year projects. One such project is the quantification and evaluation of the experience of passengers onboard the PRASA coaches with the aim of improving quality. One of the mission statements of PRASA is to give their passengers an experience they will never forget. It is therefore important to PRASA management and staff to be able to quantify this experience. Not only is the comfort and service of importance, but also the reliability, adherence to schedules and overall safety. The current customer satisfaction index is around 66% and with different actions taken by PRASA it has not improved as much. The information from this project will be valuable to align all of the customer and coach aspects. During the project, a study of certain services within PRASA, to ultimately improve the overall efficiency of PRASA and its employees, at the customer levels will be undertaken. The project helped in determining the PRASA coach and service factors that are most important to the commuters and that require improvement.
Firstly, the research and study of various techniques and principles used to evaluate customer experiences was done to ensure a successful collection, translation, and use of the collected data through surveys. It was required to determine all the boundaries of the project in order to work within the given scope.
The study on surveys and questionnaires was done next, to understand all the principles, steps and procedures involved for a successful survey. A study on the use of a Quality Function Deployment (QFD) model and a scoring system was undertaken and used to ensure that the collected data from the surveys can be interpreted to relevant results and recommendations. For the most effective use of the results, the Pareto principle was studied and used to ensure that the best results on the improvement of the customer experience would come from the least amount of improvement features.
Whilst the survey was undertaken, various observations and comments from the commuters were noted. These observations and comments were further studied to retrieve additional information on the commuter experience and were used to give more relevant recommendations. Most of the observations and comments refer to the questions asked and the results obtained within the survey.
Data verification was done, to ensure that the data collected from the survey are reliable and useable. It showed that the data is usable, without large margins of deviation. Next the data analysis was done, to get results and suggest recommendations to improve on the results. The results and recommendations of all the most important features, which were obtained by using the scoring system and the Pareto principle, of the coaches and service are given within the report. These most important aspects are; the timeliness of the coaches, the safety onboard the coaches and on the platforms against criminal offences, the cleanliness of the coaches, and no technical failures or train breakdowns. Most of these important aspects can be overcome if an effective maintenance plan is in place.
Based on the PRASA management and commuters’ feedback and comments, PRASA has a very poor customer satisfaction rate and it is required to improve on these and other serious features, as stated within the recommendations. From the project, it is determined that there is no reason to reject the hypothesis.
Opsomming
"There are approximately 3,9 million public transport commuters. The 2,5 million taxi commuters account for over 63 percent of public transport work trips, bus services account for another 22 percent of public transport commuters and the balance are carried to work by train." [arrivealive.co.za, Junie 2011]. Hierdie studie is gedoen in 2005, vandag is daar veel meer trein pendelaars.
Die Passenger Rail Agentskap van Suid-Afrika (PRASA)/Metrorail Leerstoel in die Instandhoudignsbestuur is 'n nuutgevestigde span in die Departement Bedryfsingenieurswese. Gedurende 'n aanvanklike beplanningsessie was verskeie projekte geïdentifiseer, baie van die projekte ideaal geskik vir finale-jaar projekte of skripsies. Een so 'n projek is die kwantifisering en evaluering van die ervaringe van die passasiers aan boord die PRASA waens, met die oog op verhoging van kwaliteit.
Een van die missiestellings van PRASA is om hul passasiers 'n ervaring te gee wat hulle nooit sal vergeet nie. Dit is dus belangrik vir die PRASA bestuur en personeel om in staat te wees om hierdie ervaringe te kwantifiseer. Nie net is die gerief en diens van belang nie, maar ook die betroubaarheid van die waens, die nakoming van die treinskedules, en die algehele veiligheid van die passasiers. Die huidige tevredenheidsvlak van die kliënte is ongeveer 66% en die verskillende stappe en aksies wat deur PRASA geneem is om dit te verbeter, was nie suksesvol nie. Die inligting vervat in hierdie projek, sal waardevol wees om al die kliënte en waens aspekte in lyn te bring.
Tydens die projek word die dienste van PRASA bestudeer, om uiteindelik die verbetering van die algehele doeltreffendheid van PRASA en sy werknemers op die kliëntevlak te bewerkstelling. Die projek het gehelp met die bepaling van die PRASA waens en diens faktore wat van belang is vir die pendelaars en wat verbetering vereis.
Eerstens is navorsing en studie gedoen van verskeie tegnieke en beginsels, wat gebruik is om die ervarings van die kliënt te evalueer, om te verseker dat 'n suksesvolle versameling, vertaling, en gebruik van data, deur middel van opnames, effektief is. Dit was nodig om al die grense van die projek vas te stel om binne die gegewe opdrag te werk.
ʼn Studie oor die effektiewe gebruik van opnames en vraelyste is gedoen om al die beginsels, stappe en prosedures, wat vir 'n suksesvolle opname belangrik is, te verstaan. Daarna is 'n studie oor die gebruik van 'n Kwaliteit Funksie Ontplooiing (QFD) model en 'n puntestelsel onderneem, wat gebruik was om te verseker dat die versamelde data van die opnames geïnterpreteer kan word om relevante resultate en aanbevelings te maak. Vir die
mees effektiewe benutting van die resultate, was die Pareto beginsel bestudeer. Dit was gebruik om te verseker dat die beste resultate, vir die verbetering van die kliënte se ervarings, vanaf die kleinste hoeveelheid verbeteringe van die dienste en wa kenmerke sou kom.
Terwyl die opname onderneem is, is verskeie waarnemings en kommentaar van die pendelaars opgemerk en genoteer. Hierdie waarnemings en kommentaar is verder bestudeer om bykomende inligting oor die pendelaars se ervaringe te verkry, en wat gebruik was om meer toepaslike aanbevelings te maak. Meeste van die waarnemings en kommentaar verwys na die vrae gevra in die opname en die resultate wat in die opname verkry is.
Dataverifiëring is gedoen om te verseker dat die data wat versamel is uit die opname betroubaar en bruikbaar is. Dit het gewys dat die data wat gebruik is, sonder groot marges van afwyking, betroubaar is. Vervolgens was die data-analise gedoen, wat resultate gelewer het en waarop aanbevelings toegepas is om te verbeter op die resultate. Die resultate en aanbevelings van al die belangrikste kenmerke, wat deur die gebruik van die puntestelsel en die Pareto beginsel verkry is, van die waens en diens word in die verslag gedoen. Die belangrikste aspekte is; die tydigheid van die waens, die veiligheid aan boord die waens en op die platforms teen kriminele oortredings, die netheid van die waens, en geen tegniese falings of trein rit onderbrekings. Meeste van hierdie belangrike aspekte kan oorkom word indien 'n doeltreffende instandhoudingsplan in plek is.
Gebaseer op die PRASA komitee en pendelaars se terugvoer en kommentaar, het PRASA 'n baie swak pendelaars tevredenheid en dit nodig is om te verbeter op hierdie en ander ernstige aksepte, soos uiteengesit in die aanbevelings. Vanuit die projek is dit bepaal dat daar geen rede is om die hipotese stelling te verwerp nie.
Table of Contents
Acknowledgements ...ii
Declaration ... iii
ECSA Exit Level Outcomes... iv
Abstract... v
Opsomming ... vii
List of figures ... xii
List of tables ... xiii
List of equations ... xiii
Acronyms ... xiv
1) Introduction ... 1
1.1) Problem statement ... 1
1.2) Boundaries of the project ... 2
2) Research Methodology ... 3
2.1) Hypothesis ... 3
2.2) Approach and Objectives ... 3
2.3) Non-empirical research method ... 4
2.4) Empirical method ... 5
2.5) Survey and Questionnaires ... 5
2.5.1) Sample size of population ... 6
2.5.2) The service delivery gaps ... 7
2.5.3) Principles ... 8
2.5.4) Characteristics of questions and answers ... 9
2.5.5) Question objectives ... 9
2.5.6) Confidentiality ... 10
2.5.7) Acquiring data ... 10
2.5.8) Filtering data into tables ... 11
2.6) Quality Function Deployment ... 11
2.6.1) The customer ... 12
2.6.2) The competitors ... 12
2.6.4) The QFD model ... 14
2.7) Implementation of QFD into models ... 16
2.8) The Pareto principle ... 17
2.9) Use of the QFD and the Pareto principle to enhance the customer experience ... 17
3. Application of theoretical findings in a case study: PRASA Rail ... 18
3.1) Description of the case study ... 18
3.2) Applying the principles to the questionnaires ... 18
3.3) Adhering to the characteristics of questions and answers ... 20
3.4) Meeting question objectives ... 20
3.5) Approving confidentiality ... 20
3.6) Defining the customers ... 21
3.7) Defining the competitors ... 21
3.8) Using the QFD model ... 21
3.9) Using the Pareto principle ... 22
4. Data Collection and Verification ... 23
4.1) Introduction ... 23
4.2) Collected data ... 23
4.3) Verification of the collected data ... 24
4.3.1) Stations ... 24
4.3.2) Gender ... 24
4.3.3) Answered questions' deviation ... 24
5. Data Analysis ... 25
5.1) Introduction ... 25
5.2) Analysis of the age distribution ... 25
5.3) Analysis of gender differences in importance levels ... 27
5.4) Analysis of the customers' weekly commuting statistics... 28
5.5) Analysis of the answered questions ... 29
5.5.1) The scoring system methodology ... 29
5.5.2) The top ranking of the questions and applying the Pareto principle ... 30
6) Survey Comments and Observations ... 32
6.1) Commuter noted comments in the survey ... 32
6.2) Observations and verbal comments from the survey and commuters ... 33
7) The QFD Model in Accordance with the Results ... 37
7.1) Introduction ... 37
7.2) The QFD process ... 37
7.3) The QFD results ... 38
8) Conclusion and Recommendations ... 41
8.1) Conclusion ... 41
8.2) Recommendations ... 41
8.3) Self-Assessment ... 42
9) Reference ... 43
10) Appendices ... 44
10.1) Objective Tree Analysis model ... 44
10.2) Calculating the population sample size ... 45
10.3) Website calculated number of surveys ... 46
10.4) QFD spreadsheet example ... 47
10.5) The test data ... 48
10.6) The age distribution percentages... 49
10.7) Detailed distributions of the age groups ... 50
10.8) The deviations in importance levels based on 10 year age groups ... 52
10.9) The deviation in importance levels based on gender ... 52
10.10) Commuter travel times per week distribution ... 52
10.11) The deviation in importance based on commuter travel times per week ... 52
10.12) All the questions' scoring tables ... 53
10.13) The full table of the overall scores ... 54
10.14) The commuter comments on the questionnaires ... 55
10.15) The commuters' verbal comments and observations ... 56
10.16) Photos of commuters holding onto the coaches ... 57
10.17) The fully completed QFD model ... 58
10.18) Updated Gantt chart ... 60
List of figures
Figure 1: Parasuraman gap model ... 7
Figure 2: Service types model ... 13
Figure 3: Components of the QFD model ... 16
Figure 4: Example of a Pareto graph ... 17
Figure 5: Questionnaire example ... 19
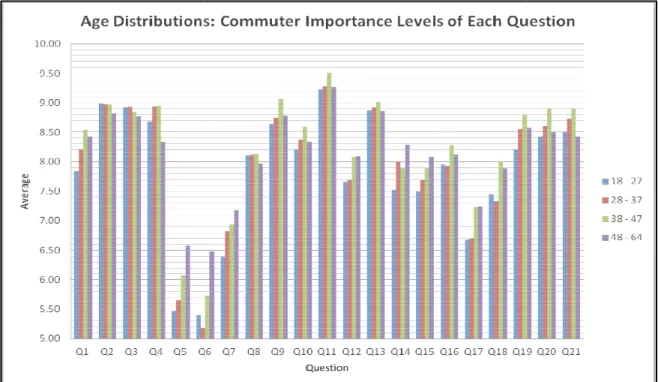
Figure 6: Pie chart of 10 year age groups population distribution ... Error! Bookmark not defined. Figure 7: Commuter importance levels of each question on age distributions ... 27
Figure 8: Commuter importance levels of each question based on gender ... 27
Figure 9: Distribution of commuter travel times per week ... 28
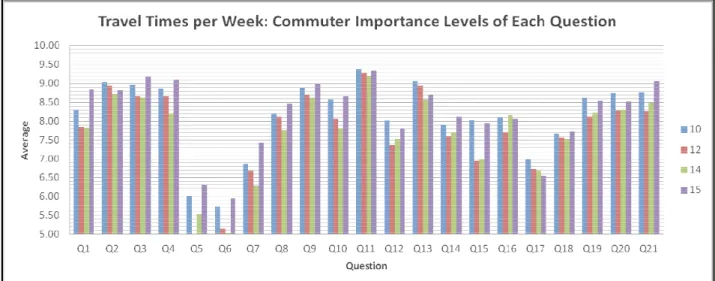
Figure 10: Commuter importance levels of each question based on the times travelled per week ... 29
Figure 11: Commuters moving from one platform to another over the tracks ... 34
Figure 12: Commuters hanging from the coaches ... 35
Figure 13: The competitor assessment ... 40
Figure 14: Online calculator ... 46
Figure 15: The spreadsheet QFD example ... 47
Figure 16: Pie chart of 10 year age distribution groups ... 50
Figure 17: Histogram plot of all the ages ... 51
Figure 18: Commuters standing in between the coaches ... 57
Figure 19: Commuters hanging out of the coach doors ... 57
Figure 20: The top part of the QFD model ... 58
Figure 21: Bottom half of the completed QFD model ... 59
Figure 22: Updated Gantt chart for Project Plan ... 60
List of tables
Table 1: Expansion on service delivery gaps identified ... 8
Table 2: Distribution of the genders between stations ... 23
Table 3: Averages of genders between stations ... 24
Table 4: Deviation between minimum average and maximum average of each gender over all the stations ... 24
Table 5: Deviation between minimum average and maximum average of each station ... 25
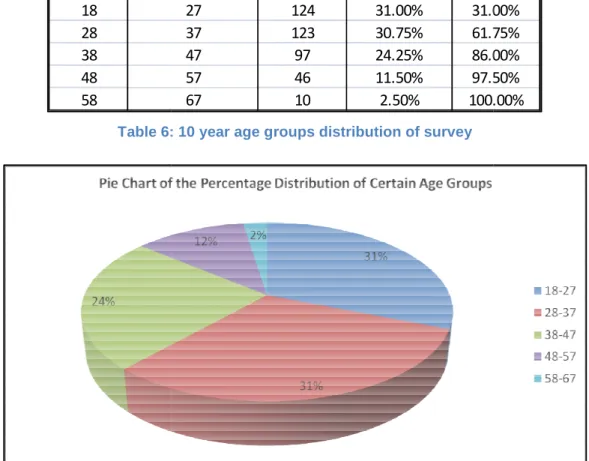
Table 6: 10 year age groups distribution of survey ... 26
Table 7: Scoring table for question 11 ... 29
Table 8: Top ranking questions from the scoring table ... 30
Table 9: The summarised relative weights of the service and coach features ... 39
Table 10: Z-values for certain confidence levels ... 45
Table 11: Test data ... 48
Table 12: The age distribution table ... 49
Table 13: Frequency table of 10 year age distribution groups ... 50
Table 14: Importance averages and deviations for age distributions ... 52
Table 15: Commuters travelling times per week ... 52
Table 16: Importance averages for the travel times per week of the commuters ... 52
Table 17: Importance averages and deviations for the different genders ... 52
Table 18: All of the questions' scoring ... 53
Table 19: Ranking table with the percentage value of each question ... 54
Table 20: Ranking table with cumulative percentages of each question ... 54
List of equations
Equation 1: Formula for calculating a sample for proportions ... 6Acronyms
PRASA: The Passenger Rail Agency of South Africa
QFD: Quality Function Deployment: It is a structured product development process which translates what the market requires into a program to create, manufacture, and deliver it. In a QFD process, multi-skilled teams collaborate to arrive at a common understanding of the customer needs, and determine the appropriate technical requirements of each stage. [businessdictionary.com, September 2011]
Pareto principle: A principle that stipulates that a large number of factors or agents contribute to a result, the majority (about 80 percent) of the result is due to the contributions of a minority (about 20 percent) of factors or agents. [businessdictionary.com, September 2011]
TQM: Total Quality Management: A holistic approach to long-term success that views continuous improvement in all aspects of an organization as a process and not as a short-term goal. [businessdictionary.com, September 2011]
1) Introduction
1.1) Problem statement
"The sitter or economy class travellers contribute 87.5% of the total revenue of the business. Metrorail is responsible for transporting over 2.2 million passengers per day. The Western Cape has over 600 000 train commuters." [prasa.com, June 2011]. This shows the importance of the economy class travellers, which contribute 87.5% of the total revenue. Therefore it is most important to focus on these customer experiences.
PRASA needs a relative measurement of customer needs and their coach specifications. No current evaluations, of which specifications and services onboard the coaches are of more importance for customers needs, are being used. These measurements are required to determine which elements in PRASA coaches’ and services need more or less focus (derived from the customer needs), to improve the customer experience overall. Staff also need to be aware of which aspects are of the highest importance to customers and how it reflects on the current PRASA procedures and way of thinking.
This problem led to the “quantification and evaluation of customer travelling experience onboard PRASA coaches” project. The project entails determining/estimating which aspects are more important for a better customer experience on board PRASA coaches by evaluating different specifications of the coaches and services to customer needs. These measurements could be in terms of coach luxury, customer experience on and off the trains, train performance and the quality of certain parts, train maintenance, and other qualities or features.
This research and inputs can be used by PRASA to understand the evaluations and ultimately implement it into their procedures, with the overall aim of improving the quality of the commuter experience.
1.2) Boundaries of the project
Although the research and project as a whole can be used to determine certain customer requirements and needs of most coaches in South Africa, it does have certain limitations or boundaries.
One of these boundaries is the scope of the people in question. The scope of people for the project includes commuters (customers) that use the commuting trains everyday for mostly work purposes. These are the economy class travellers, who make up 87.5% of the total revenue. Due to the diverse cultural country that South Africa is, other parts of the country could react different to certain question asked in the questionnaires. The survey was done in the Western Cape and could thus mostly be beneficial to the culture of the Capetonians. A limited sample of people would fill in the questionnaires, it is impossible to get every commuter’s inputs.
The Pareto principle, which was used on the analysed data collected, reflects on approximately 80 percent of the total commuter experience. Thus, approximately 20 percent of the commuter overall experience is not reflected on.
A less major focus is the seasonal time the study was undertaken in (winter). In the summer times South African commuters have more options available to get to their destinations, due to the earlier sunrise. This fact could have a slight impact on the scope of people in question. Some only use the commuter trains in the winter, due to the cold and much later sunrise. The main focus is on PRASA commuting coaches in South Africa and other countries could not necessarily use these results as feedback on their own coaches and customer experiences.
It is important to understand certain limitations in the commuters’ technical knowledge. Most commuters do not understand the highly technological and theoretical words which engineers use to describe certain objects and terms.
A major fact that should be remembered throughout the evaluation is that the customers overall experience starts at the walk-in at the departure train station to the walk-out at the destination train station.
2) Research Methodology
2.1) Hypothesis
The quantification of customer experience, using quality management tools, can be used to improve the overall quality of the service.
2.2) Approach and Objectives
The overall goal of the project is to give PRASA a usable recommendation system and relative problem solving ideas and techniques, which they could use as a guideline for the most important features and aspects of their coaches and services in repairing, maintaining, improving, designing, and implementing them. This in turn could improve the customer satisfaction and the overall customer experience.
The objectives are not only for the success of the project, but for the successful implementation of the recommendations and the actual improvement of the customer experience.
It is important to consider the effects of the survey and changes within the coaches and services on the customers. Changes could be either positive or negative. It is important to make the best changes for an overall positive improvement of the customer experience. Certain changes will affect some customers in a positive way and other customers negatively, thus a balance should be determined when considering improvements.
To complete a successful project there should be a sequence in which certain parts of the project are completed in order to get to a final end product or recommendations. This sequence can be laid out in milestones or sub goals that should be achieved; it also gives a certain approach which must be taken in order to complete milestones.
The milestones: Milestone 1:
1. Acquire problem statement 2. Setup a project plan
Milestone 2:
3. Acquire background information of PRASA and on commuter transportation in South Africa
4. Research previous customer evaluation procedures and questionnaires used by other organizations for determining customer expectations and experiences
5. Do appropriate research in the tools and methods used to get to the end goal; Research Methodology:
a. Research surveys and preparation of questionnaires b. Determine sample size
c. Research customer responses
d. Research Quality Function Deployment (QFD) and how it is used e. Research models that will be used and house of qualities
Milestone 3:
6. Acquire certification from PRASA for the distribution of the questionnaires 7. Find out relevant train specifications
8. Find out what are the customer expectations 9. Develop questionnaires for PRASA customers 10. Distribute the questionnaires to customers 11. Sorting of the data collected for use of evaluation
12. Verification and analysis of the collected data and comments
13. The use of the QFD, that evaluates the customer experience to the coach specifications and services, to evaluate and assess retrieved data and information (e.g. pricing vs. riding experience, train brakes working vs. seat comfort)
Milestone 4:
14. Determine the most important features
15. Define possible solutions to enhance the customer experience
16. Develop appropriate models for use of displaying determined information 17. Transform the results into conclusions and recommendations
18. The implementation and assessment of the acquired recommendations in the Soutrivier station to enhance customer experience and customer and PRASA relations. This milestone is for later use of PRASA.
2.3) Non-empirical research method
This includes literature reviews and the study of theories, survey rules, and model-building techniques in order to complete a certain outcome of information, which needs to be used within graphical models. The graphical models will illustrate the importance of certain customer requirements or wants to relative PRASA coach specifications and services. The models are easy to understand and interpret.
An example of a model used is the house of qualities (or QFD), which is the most important model within the project. A QFD model can establish what features of the coaches and services pleases the commuters the most or requires improvement, and also the contrary.
An example of a principle used to reflect on the analysed data is the Pareto principle, also known as the 80-20 rule, which is used to focus the least, but most important, amount of results into the most effective manner. The Pareto principle states that for many phenomena 80 percent of consequences stem from 20 percent of the causes [gassner.co.il, 2011]. The principle works on a 20 percent to 80 percent basis, which means that 20 percent of the most important aspects or results, from the analysed data, would have an 80 percent overall effect on the commuter experience.
2.4) Empirical method
In this case, some calculations are required. The study of these formulae and mathematical procedures to enable the correct usage of certain models and the development of them, are important. Data sorting and determining percentages, using a scoring and ranking system, for customer preferences and integrating these into the QFD, will be of importance.
Determining the population sample size for the survey in order to get accurate models, answers and recommendations is required. This will not only be important for the project goal, but also for the estimation of the budget and time requirements.
2.5) Survey and Questionnaires
The survey is important to be as successful and meaningful as possible. The data derived from the survey would aid in the use of the Quality Function Deployment (see Section 2.6) and the final recommendations made from the study. It is required that the questionnaire be tested on a few external people, in order to make it "fool proof", before the full printout of the questionnaires is undergone. External editing and translation of the questionnaire is also required to make it more understandable for the commuters (see Appendix 10.19 for the fully completed questionnaire).
In order to conduct the survey a certificate must be obtained in which there is stated authorization that questionnaires could be handed out and questions asked within the questionnaires about PRASA's coaches and service.
In this section the survey method and the possibilities in the questionnaire is determined. Two very precise and helpful text materials were used to determine the exact survey measures and procedures, as well as the setup of the questionnaire. These two textbooks are Improving Survey Questions by Fowler F.J. and Survey Research Methods by Fowler F.J..
Firstly, it is important to determine which questions are important to get good answers. Thus before compiling a questionnaire a sample of customers should be asked because what they
think are important features. From these features possible questions can be formulated, which could be used in the questionnaire. Asking approximately 30 commuters would be sufficient. These questions are asked verbally and then noted. After these possible features have been noted, further thinking of possible questions are required in order to compile any possible customer expectations. To help determine the customer requirements, an Objective Tree Analysis model will be used, see Appendix 10.1 for an example of the model.
2.5.1) Sample size of population
To determine the sample size, the equations below were used [edis.ifas.ufl.edu, June 2011]. To see the actual calculated values, see Appendix 10.2. These equations' answers were tested using a calculator in a website, see Appendix 10.3.
Equation 1: Formula for calculating a sample for proportions
Where n0 is the sample size, Z is the standard deviation for the desired confidence level,
which can be obtained from a statistical table, e is the desired level of precision, p is the estimated proportion of an attribute that is present in the population, and q is 1-p.
Equation 2: Finite Population correction for proportions
Where n is the sample size and N is the population size.
"The Western Cape has over 600 000 train commuters." [prasa.com, June 2011].
From the above statement it can be seen that there are more than 600 000 train commuters in the Western Cape. Assume p = 0.5, which is maximum variability. A desired level of precision would be 5%, with a confidence level of 95%. Using these values a sample size was determined at 385. The data and results would be more accurate if it is to be rounded up to 400, see Appendix 10.1 for calculations.
Thus the population sample would be 400 observations or commuters required to fill in the questionnaires.
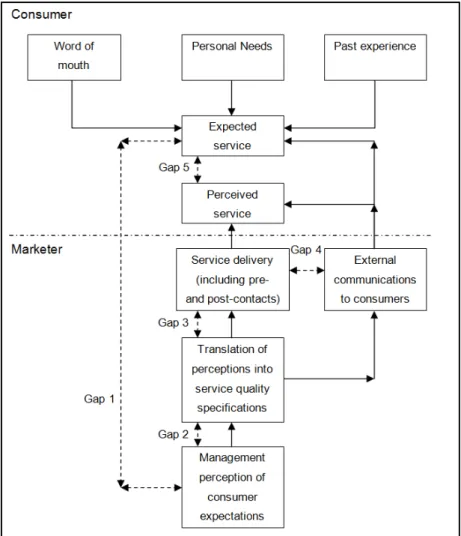
2.5.2) The service delivery gaps
There are a number of potential service delivery gaps, seen figure 1 [Parasuraman, 1985]. These gaps could result in service deficiencies and that preventative action must be taken to circumvent them. The gaps identified are enumerated in table 1 [Parasuraman, 1985].
Customers' perceptions depend on comparing prior expectations of the service to what they receive, hence Perceived Service Quality = Perception - Expectations [Weideman, 2006].
Figure 1: Parasuraman gap model
It is important to understand these gaps and the way they affect the customers' perceptions to enable the service provider to determine the best alternative for improving the customer experience.
Table 1: Expansion on service delivery gaps identified
2.5.3) Principles
In order to conduct a good survey there are various principles to which one should comply. These principles are clearly stated in the textbook Improving Survey Questions by Fowler F.J. (pg.103) and will be used in the setup of the survey and questionnaire. The principles will be discussed next.
Principle 1: The strength of survey research is asking people about their firsthand experiences: what they have done, their current situations, their feelings and perceptions.
Principle 1.a) Beware of asking about information that is only acquired second-hand.
Principle 1.b) Beware of hypothetical questions.
Principle 1.c) Beware of asking about causality.
Principle 1.d) Beware of asking respondents about solutions to complex problems.
Principle 2: Ask one question at a time.
Principle 2.a) Avoid asking two questions at once.
Principle 2.b) Avoid questions that impose unwarranted assumptions.
Principle 2.c) Beware of questions that include hidden contingencies.
Principle 3: A survey question should be worded so that every respondent is answering the same question.
Principle 3.a) To the extent possible, the words in question should be chosen so that all respondents understand their meaning and all respondents have the same sense of what the meaning is.
Principle 3.b) To the extent that words or terms must be used that have meanings that are likely not to be shared, definitions should be provided to all respondents.
Principle 3.c) The time period referred to by a question should be unambiguous.
Expansion on service delivery gaps identified No.
1. The gap between customer expectations and management perception of these expectations 2. The gap between management perception of customer expectations and the ability to translate
these into service quality standards
3. The gap between service quality specifications and the actual service delivery 4. The gap between service delivery and external communications
Questions about feelings and behaviours must refer to a period of time.
Principle 3.d) If what is to be covered is too complex to be included in a single question, ask multiple questions.
Principle 5: Clearly communicate to all respondents the kind of answer that constitutes an adequate answer to a question.
Principle 6: Design survey instruments to make the task of reading questions, following instructions, and recording answers as easy as possible for interviewers and respondents.
2.5.4) Characteristics of questions and answers
The 5 basic characteristic of questions and answers that are fundamental to a good measurement system [Fowler, 1995]:
1. Questions need to be consistently understood.
2. Questions need to be consistently administered or communicated to the respondents. 3. What constitutes an adequate answer should be consistently communicated.
4. Unless measuring knowledge is the goal of the question, all respondents should have access to the information needed to answer the question accurately.
5. Respondents must be willing to provide the answers called for in the question.
For a successful survey, all of these characteristics should be adhered to whilst conducting the survey.
2.5.5) Question objectives
Question objectives are important. The objective defines the kind of information that is needed [Fowler, 1995]. The objective of the questions will be related to a technical aspect of the coaches or service delivered.
One question objective is the age of the customer, which is important for the study; this would show which age groups of commuters prefer what type features more and the approximate amount/percentage of people of these certain age groups. But the question of the age of a commuter on a questionnaire could be asked in many ways. According to Improving Survey Questions, Design and Evaluation by Fowler, F.J. the best question to ask is in the form of the following, "On what date were you born?" This gives a more accurate answer than, "How old are you now?" The previous mentioned question could be misleading and people can give ages rounded up or down. Thus by giving their birth date their actual age can be determined later. It should be noted that the wrong calculation of the age could give inaccurate data and attention would be given to this aspect.
Another question with the objective of determining the gender of a customer is also important for determining customer wants; sometimes males prefer other features than females, or males find a certain feature more important than females, and vice versa. This question is straight forward, "Are you male or female?", or "What is your gender?"
Race and cultural questions should be avoided. South Africa is a country with a very diverse culture and racism is still a big factor after the apartheid era has ended in 1994. This is a very sensitive topic and should be avoided. It would not have any great impact on the overall conclusion of the studies if it is to be excluded.
2.5.6) Confidentiality
Survey researchers routinely assure respondents that their answers and comments would be confidential. In order to protect confidentiality there are numerous guidance principles that can be followed, such as [Fowler, 1995]:
1. Minimizing the use of names or other easy identifiers 2. Dissociating identifiers from survey responses 3. Keeping survey forms in locked files
4. Keeping non-staff people away from completed survey answers 5. Seeing to proper disposal of survey instruments
It should be stated to the customer, that the questionnaire would consist of no personal information and would not be used by other people or organisations, accept the intended service provider.
2.5.7) Acquiring data
The survey should be conducted through the handing out the questionnaires at various stations in the mornings when commuters await their trains to take them to their desired destinations. Asking them politely if they are willing to fill in the forms and handing them back as quickly as possible. It would be required to undergo this handing out of questionnaires a few times in order to get 400 answered questionnaires. The data from the forms would then be noted into a data spreadsheet using the Microsoft Excel 2007 software package.
2.5.8) Filtering data into tables
By using all of the data collected and filled into tables, the distribution of these different question answers, relative to the coaches and service, can be seen and from this the importance of these features can be determined. All the customer preferences can be weighed against each other and used within the house of qualities and Pareto principle (see Section 2.6.4 and Section 2.8).
To sort and determine the weights of the collected data, Microsoft Excel 2007 software would be used to compile a ranking table through the use of a scoring system. Some of the functions and features used within the program are; pivot tables and scoring matrixes.
2.6) Quality Function Deployment
The aim of the quality function deployment method is to set targets to be achieved for the engineering characteristics of a product (the coach in this case) and service, such that they satisfy customer requirements [Cross, 2008]. QFD takes broad product specifications or specific problems and, through a series of matrices, breaks them into specific action assignments. QFD is a systematic procedure for defining customer desires and requirements and interpreting them in terms of product features, process requirements, and quality characteristics [Groover, 2008]. It is also ideal for shifting to Total Quality Management (TQM). Although the QFD's main focus is on product design, it can be used to analyse an existing product or service.
QFD forces organisations to keep its focus on the customer. As a result, customer satisfaction is improved. Customers' always take the advantage when tradeoffs are necessary, not the engineer or the maintenance departments. QFD uses a formal and structured approach, and so it is necessary to have all the correct details/data, which were collected from the survey before undergoing the QFD process.
The QFD methodology helps bring together diverse data from many sources; competitive market analysis, specific customer expectations, engineering expertise, customer surveys, manufacturing and maintenance capabilities, company resources, cost considerations, and strategic goals [Guinta et.al., 1993]. In order to fully develop the QFD, a considerable amount of research has to go into the customers’ preferences or needs and who they are. Also requiring a considerable amount of research are all of the alternative transportation methods, which could be considered as the service providers competitors. The technical requirements or features of the coaches are also important and relative studies of these aspects are required. Thus it is important to determine who the customers (commuters) are, who the competitors are and what the technical features of the coaches and service are.
2.6.1) The customer
Firstly, it is required to determine what market segments would be analysed during the process and to identify who the customers are. The information needs to be gathered from these customers on the requirements they have for the service.
Capturing the customer's needs, desires, and requirements is most critical in the analysis. The customer preferences or wants are determined through the survey as described in Section 2.5. The objective here is to translate the customer statements into design and service characteristics.
There are four levels of customer requirements stated in the textbook The QFD Book by Guinta, L.R., and Praizler, N.C., these levels are:
1. Expecters - The basic qualities you must offer to be competitive and remain in business. These are characteristics customers assume as part of the product or service; they expect them as standard features.
2. Spokens - Specific features customers say they want in a product or service. These are services the company is willing to provide to satisfy the customer.
3. Unspokens - Product or service characteristics customers do not talk about. It is important to discover these wants and thus the use of the market survey.
4. Exciters - Unexpected features of a product or service. These features make the product unique and distinguish it from the competition.
All these levels of customer requirements needs to be inspected and possible relative requirements obtained from them.
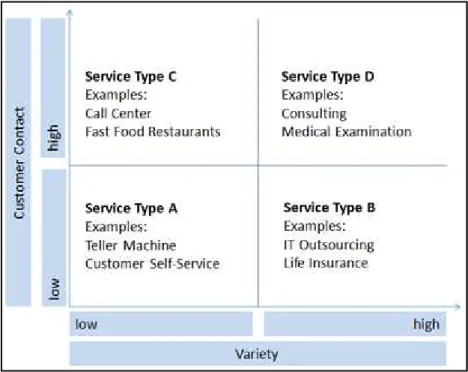
2.6.2) The competitors
The competitors' services are one of the main reasons to have an even better customer experience onboard the service provider's coaches, not just for the ease of use of the transportation. Thus, it is important to determine the major competitors. Figure 2 [eazun.wordpress.com, June 2011] shows approximately what service types the service provider could find itself in.
To completely understand the customer service wants and requirements, the competitors need to be analysed to see what makes them a better mode of transport than trains. Some of the technical features of these competitors’ products (vehicles) can be collected to help in the analysis.
2.6.3) The technical features
The technical features of the coaches should be obtained from the service provider's technical staff, if required. These features help determine the precise coach features and services the commuters find important and should thus get the most attention in the maintenance and operation of these coaches. There are a variety of technical features, e.g. how much the coach weighs, how fast it moves, how many light bulbs it has and its wattages, how many seats are available, how many doors it has, how much floor space it has, the door sizes, etc.
With all these technical features in mind, when using the QFD, it can be determined which features are more important than others. This could entail models which the service provider can use as their guideline of the maintenance and service procedures in order to focus energy and time on maintaining the most important technical features first. This could change or eliminate current maintenance cycle and service procedures, and could also give a higher customer satisfaction rate.
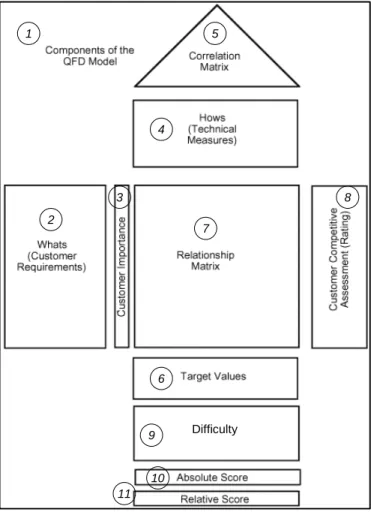
2.6.4) The QFD model
This section will clarify how the house of qualities works, as it is to be used as a major function in the project.
Although there are many different models that could be used in QFD, the house of quality used in the project is one of the best and relatively easy to understand and use. The house of quality does, however, have many different shapes or layouts, but all look relatively the same. The name "house of quality" is derived from the basic traditional shape used, which is a shape of a house, it is another naming for QFD. It is used in the project and can be seen in figure 3. A very accurate house of quality template (in Microsoft Excel software) [qfdonline.com, June 2011] was used to determine the importance of certain features of the coaches and services according to the customer requirements.
The model procedure guidance and description are best noted in the textbook The QFD book by Guinta L.R., and Praizler N.C., (pg. 24-25). This was slightly adjusted to fit the current project needs. The house of quality consists of 11 parts, without the scales. The scales are important for consistent and accurate feedback. The relative scales would be given where needed in each part of the model.
The QFD consists of the following parts:
1. Objective Statement - a description of the goal or problem.
2. Whats or Customer Requirements - sometimes referred to as the "voice of the customer". It is a list of characteristics of a product, process, or service, as defined by customers; To help determine the customer requirements an Objective Tree Analysis model can be used.
3. Importance Ratings - weighed values assigned to the Whats of part 2, indicating relative importance; These ratings are obtained from the tables used to evaluate all the data collected from the questionnaires. These values would later be used within the relationship matrix. These weights are done based on a scale of 0 to 10 or 0 to 100. To be more accurate a scale of 0 to 100 would be used.
4. Hows or Technical Measures - ways of achieving the Whats in part 2; These are mostly more technical features of the coach and service itself, which are required for the coaches and service in order to satisfy the customer desires.
5. Correlation Matrix ("The roof") - shows the relationship between the Hows in part 4; Various coach features will likely be related to each other. The purpose of this is to establish the strength of each of the relationships between pairs of the product features. Symbols are going to be used to show the relationship importance, these symbols can be seen on the top right-hand corner of the QFD spreadsheet (see
Appendix 10.4) used. The symbols used indicate how significant or how strong the relationships between respective pairs or requirements are. Four symbols will be used, each one indicating the strength of the correlation; strong positive correlation, positive correlation, negative correlation, and strong negative correlation. If no symbol is shown, then there is no correlation whatsoever.
6. Target Goals or Target Values - indicators of whether to increase or decrease a How in part 4, or set a target value for it; This will show what technical features are required of more and what are required of less.
7. Relationship Matrix - systematic means for identifying the level of relationship between a product/service characteristic (What in part 2) and a way to achieve it (How in part 4); The relationships of the customer requirements of the coaches and service to the technical features of the coaches and service would be done within this matrix by giving those symbols according to their relationship strength or importance. This shows how well the collection of coach and service features is fulfilling individual customer requirements. Three symbols would be used, each one indicating the strength of the relationship and each symbol has a corresponding value; strong relationship (which has a value of 9), moderate relationship (which has a value of 3), and weak relationship (which has a value of 1). If no symbol is shown, then there is no relationship whatsoever.
8. Customer Competitive Assessment - a review of competitive products or services characteristics in comparison with the product or service in the QFD; The reviews can be acquired by also questioning the train commuters and by experiencing the competitors’ mode of travel firsthand. The product or service used in the QFD is the service provider’s commuter coaches. This assessment also uses a scale from 0 to 5, where 0 is the worst and 5 is the best.
9. Difficulty or Probability Factors - value indicating the ease with which the company could achieve each How from part 4; the difficulty of achieving a certain service level or coach specification. This is measured on a scale from 0 to 10, where 0 is easy to accomplish and 10 is extremely difficult to accomplish. This difficulty levels can be estimated and obtained by questioning the service provider's management.
10. Absolute score - the sum of the calculated values for each How of part 4 or column in the Relationship Matrix in part 7; by summing the symbol values from each column. This is done automatically within the spreadsheet.
11. Relative score - a sequential numbering of each How of part 4 to its Absolute Score in part 10; The highest score would be the value closest to 10 and features becoming less important the further the relative weight is from 10.
2.7) Implementation of QFD into models
There are various models that can be used to show all the differences, relations, weights, importance, and exceptions of all the technical features, customer wants, and results from the survey and QFD. Most are graphical models which will represent all of the results from the QFD. The graphical models could be displayed in 2-D or 3-D. Some of the charts that could be used are Pie Charts and Histograms. A visual presentation of the results would be easier for the service provider and especially the workforce to understand and adapt to the results. The graphical models are going to be developed by mainly using Microsoft Office. Other models and charts can be developed as required by the service provider.
7 8 10 11 1 2 3 4 5 6 Difficulty 9
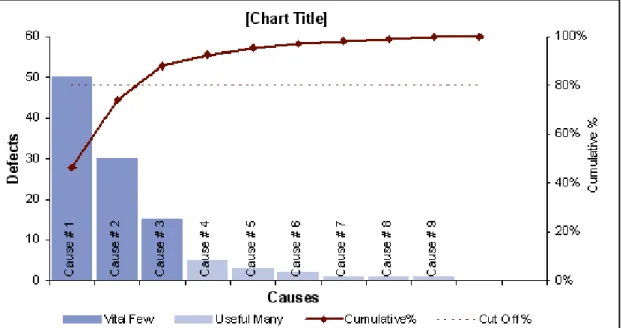
2.8) The Pareto principle
One of the most effective principles used throughout the engineering sectors and customer related sectors is the Pareto principle, which is mostly used for problem solving and improvements. The Pareto principle is also used in this study, to give a smaller scope of aspects more focus, which would improve the results the most. The Pareto principle states that for many phenomena, 80 percent of consequences stem from 20 percent of the causes [gassner.co.il, 2011]. This is visually demonstrated in figure 4 below [Wittwer, 2009].
2.9) Use of the QFD and the Pareto principle to enhance the customer
experience
Determine what components or features of the coaches and service are most important and from that determine possible solution alternatives to enhance the customer experience. Generate the alternative solutions even if it seems ambiguous at the time, it could help to determine other factors within other alternatives. Then it is important to determine the difficulty to implement all of the alternatives. Finally, select the best alternative for implementation. These alternatives can be determined and implemented by the service provider using the results obtained from the project.
A visual presentation of the results in models would be easier for the workforce to understand and adapt to the changes. It will also give them a sense of what is important in the work they are doing and what their customers think of their work and service.
3. Application of theoretical findings in a case study:
PRASA Rail
3.1) Description of the case study
Based on the feedback and comments from the PRASA management and commuters, PRASA has a very poor customer satisfaction rate and it is required and recommended to improve on the quality thereof.
The quantification and evaluation of the customer satisfaction by using quality management tools, with the aim of improving the customer experience, is intended to be applied on the PRASA Rail services.
The guidelines from the research methodology (Section 2) are going to be followed in order to undertake and improve the overall quality of the commuters' travelling experience.
3.2) Applying the principles to the questionnaires
The principles, from Section 2.5.3, and how they are met will be discussed next.
Principle 1.a) Information asked is only about the PRASA coaches, services and the stations at which the commuter boards the train. The sample of customers is everyday commuters of the trains; they would have knowledge of and have experienced the questions asked about the coaches.
Principle 1.b) No future questions would be asked. To insure these questions would not be hypothetical, external editing of the questionnaires would be done.
Principle 1.c) No such questions are asked within the questionnaire. Such a question would be, "Do you use the coaches because you cannot afford a car?"
Principle 1.d) No solutions for problems are asked within the questionnaires, although customer opinions can be verbally asked and noted whilst the survey is being conducted. Principle 2.a) The questions are asked one at a time and no question has to be answered twice. Such a question would be, "Do you want the coaches to be clean and comfortable?" Principle 2.b) and Principle 2.c) For both principles 2.b and 2.c, no such questions are asked. Customers' insight and assumptions of questions differ and each would have their own way of answering the question.
Principle 3.a) It is important to understand certain limitations in the commuters’ technical knowledge, as stated in the boundaries in Section 1.3. Careful considerations of words are
thus necessary within the questionnaire, not to confuse or mislead the customer in answering the questions. This is further avoided by acquiring external editing and translation of the questionnaire.
Principle 3.b) The questions about the safety onboard the PRASA coaches and on the platforms are of particular importance to this principle. Safety can be of two categories and if asked as one question, it can have different meanings. Example, "How safe do you feel onboard the train?” this is an unclear question. Customers would interpret the question differently; some would think of the crime committed inside the coaches and others the train breakdowns, and would answer the question according to these assumptions.
Principle 3.c) Time frames are given within the questions, if necessary. For instance, when asked about the number of times the customer commutes via train per working week.
Principle 3.d) No questions are to complex and each question is straightforward.
Principle 5: This is shown by using a 1 to 10 scale of importance of certain customer preferences and needs, with an example at the top of each questionnaire to guide the respondents. Adequate directions on how to answer a question is stated at the top of each questionnaire, as seen in figure 5 below. The use of the scale is very important for the weighted averages in the house of qualities and further studies.
Principle 6: Questions are numbered clearly and enough space between questions is given for the respondent not to get confused. With the numbering system respondents can keep track of questions answered and the current question position on the questionnaire. This would also enable them to see how far they have answered the questions and how much questions they have left. An example of how the questionnaire questions are asked and answered is shown in figure 5.
3.3) Adhering to the characteristics of questions and answers
How these 5 basic characteristic of questions and answers, that are fundamental to a good measurement system, will be met:
1. Questions and words are in an understandable language and multi-languaged.
2. Whilst commuters fill in the questionnaires, the researcher would be present for any further questions of uncertainty.
3. The scales in the questionnaire will be communicated to the customer on the paper and verbally with an example.
4. All respondents access the coaches daily and would know a considerable amount of the features under question.
5. The respondents will be asked if they are willing to participate in the survey, and the conditions and importance will be communicated to them.
3.4) Meeting question objectives
The age of the commuters are determined by asking, in three languages, "On what date were you born?" These dates are then noted into data tables and the exact ages are determined on the day that the survey was carried out.
To determine the commuter's gender, the following question is asked in three languages, "Are you male or female?"
No questions based on race and cultural are asked within the questionnaires.
3.5) Approving confidentiality
It is stated to the customer, that the questionnaire would consist of no personal information and would not be used by other people or organisations, accept the intended PRASA team members and management. The information within the questionnaire is only for research purposes and shall only be used to evaluate and improve customer experience. Both PRASA and the University of Stellenbosch logos will appear on the questionnaires, so the commuters can see the organisations involved in the study and that it is not a hoax.
3.6) Defining the customers
The customer is the everyday train commuter whom uses the PRASA coaches as his or her mode of transport; they are the so called economy class commuters. The customer location of the project is in South Africa and mainly focussed on the commuters within the Western Cape.
3.7) Defining the competitors
The biggest competitors to the PRASA coaches or train transport are; minibus taxis and bus services. The minibus taxis' are by far the main commuter mode of transport, taking up 63% of the commuters. The other main competitor, busses, takes up 22% of the commuters. From figure 3 in Section 2.6.2, PRASA is mostly a type A service, with some customer contact and variety.
The minibus taxis need to be analysed to see what makes them a better mode of transport than trains. The most obvious conclusion is that they take the customers or commuters directly to their desired location at a relatively cheap cost. Though this is mostly impossible for train commuters, there will be certain aspects that can be obtained from these competitors which can aid the better development of the coach customer experience.
3.8) Using the QFD model
The model setup is done in advance, using the guidance from Section 2.6. After the setup and the survey is completed, the QFD model's usage can begin.
The QFD used consists of the following parts:
1. An Objective Statement - The objective statement or title in this case, would be, "Determining the importance of the PRASA customer requirements relative to PRASA coach features."
2. Whats or Customer Requirements - To help determine the customer requirements an Objective Tree Analysis model was used, see Appendix 10.1 for an example of the model.
3. Importance Ratings - The ratings was calculated and inserted into the QFD model by using the scoring system of the survey.
4. Hows or Technical Measures - The technical features of the coaches are obtainable from the PRASA technical staff.
5. Correlation Matrix ("The roof") - The purpose of this is to establish the strength of each of the relationships between pairs of the coach features.
are stated here.
7. Relationship Matrix - The relationships of the commuter requirements of the coaches and service to the technical features of the coaches and service is done within this matrix.
8. Customer Competitive Assessment - The main competitors are minibus taxis and busses. The product or service used in the QFD is PRASA's commuter coaches. 9. Difficulty or Probability Factors - The difficulty levels can be obtained by questioning
the PRASA management.
10. Absolute score - Done automatically within the Excel spreadsheet.
11. Relative score - The highest score would be the value closest to 10 and features becoming less important the further the relative weight is from 10.
The QFD model results are used to insert into relative models for further quantification. Other models and charts can be developed as required by PRASA.
3.9) Using the Pareto principle
The Pareto principle is going to be used on all the results obtained from the survey and QFD model. In the survey the Pareto principle is applied to the scoring table, the commuter comments, and the observations. The applied principle helps to evaluate the customer experience and determine the aspects on which improvement is required.
4. Data Collection and Verification
4.1) Introduction
In this section the data collected from the survey is analysed for the verification thereof. The verification process is conducted to verify if the collected data is relevant and usable for analysis. The verification includes the distribution of the, and the deviation of the, commuters' age, gender, the location of the station, and the answers given to each question.
4.2) Collected data
The survey was done in 3 relevant stations in the Western Cape region, they were; Bellville station, Brackenfell station, and Stellenbosch station. Most questionnaires were handed out at the Bellville station during the survey, which is the bigger station of the three. The distribution of the survey can be seen in table 2.
A test survey was done first, using 10 questionnaires, to get an average time estimate of completing the surveys. The test data was also used to test the models that were going to be used. The average time of the 10 test surveys were: 3min 44sec, with a maximum of 7min 50sec and a minimum of 2min 30sec, see Appendix 10.5 for the test data. This helped in determining the time allocation for the completion of the questionnaires at the stations, which in turn helped in the full completion of questionnaires by determining the time before train arrivals and avoiding commuters running off with half filled in forms.
The maximum age of respondents was 64 years and the minimum 18 years, which is a very wide age distribution. However, as can be seen in Section 5, the ages are distributed more to the younger age groups.
Table 2: Distribution of the genders between stations
Count at each station Sex
Stations Female Male Grand Total
Bellville 149 124 273
Brackenfell 21 40 61
Stellenbosch 44 22 66
4.3) Verification of the collected data
4.3.1) Stations
The largest part of the survey was conducted at the Bellville station, which is the largest of the three stations. This relative larger proportion gives credibility to the distribution of the questionnaires and the data collected.
4.3.2) Gender
The survey included 53.5 percentage woman and 46.5 percentage men. However, it cannot be said that this ratio is applicable for the whole of South Africa or the Western Cape. It gives a relative basis percentage to work from and can be seen as agreeable at this size scale of the survey.
4.3.3) Answered questions' deviation
Deviation calculation on the answered questions between genders and stations gives a indication if the derived conclusions and recommendations are applicable for both gender and location. Table 3 shows each genders' average score on the scale of each question at the different stations.
Table 3: Averages of genders between stations
From table 3, the deviation between each question’s minimum and maximum average of each gender based on all three stations can be calculated, as shown in table 4 below. The deviations of each station based on gender are mostly below 1, with a maximum deviation of 1.35 and 1.51 between female and male respectively.
Table 4: Deviation between minimum average and maximum average of each gender over all the stations
Averages of each Sex at different Stations
Ques Sex - Stations Q1 Q2 Q3 Q4 Q5 Q6 Q7 Q8 Q9 Q10 Q11 Q12 Q13 Q14 Q15 Q16 Q17 Q18 Q19 Q20 Q21 Female 8.24 9.13 8.96 8.79 5.95 5.70 7.07 8.15 8.89 8.47 9.44 7.98 9.10 8.02 7.86 8.24 7.03 7.90 8.79 8.81 8.77 Bellville 7.95 8.96 8.77 8.54 5.68 5.50 6.76 8.02 8.79 8.32 9.42 7.87 9.07 7.96 7.66 8.11 6.72 7.73 8.55 8.68 8.54 Brackenfell 8.33 9.71 9.57 9.71 6.62 6.14 7.33 8.57 8.67 8.76 9.57 7.90 8.67 7.24 7.90 8.00 7.33 7.86 9.43 8.81 9.38 Stellenbosch 9.18 9.43 9.32 9.20 6.57 6.14 8.02 8.39 9.32 8.86 9.45 8.41 9.43 8.59 8.52 8.77 7.93 8.48 9.27 9.25 9.27 Male 8.17 8.76 8.80 8.76 5.68 5.42 6.41 8.04 8.68 8.26 9.18 7.66 8.71 7.69 7.58 7.83 6.75 7.27 8.19 8.38 8.53 Bellville 8.33 8.71 8.61 8.86 5.69 5.40 6.48 7.98 8.62 8.40 9.23 7.65 8.82 7.67 7.35 7.66 6.57 7.19 8.27 8.30 8.65 Brackenfell 7.80 9.08 9.13 8.68 6.10 5.50 5.80 8.00 8.78 8.15 8.95 7.60 8.38 7.38 8.00 7.88 6.95 6.90 7.68 8.30 8.23 Stellenbosch 7.91 8.45 9.23 8.36 4.86 5.36 7.14 8.45 8.86 7.64 9.27 7.82 8.68 8.36 8.09 8.73 7.36 8.41 8.68 8.95 8.36 Grand Total 8.21 8.96 8.89 8.78 5.83 5.57 6.77 8.10 8.79 8.37 9.32 7.83 8.92 7.87 7.73 8.05 6.90 7.61 8.51 8.61 8.66
Deviation between Minimum Average and Maximum Average of each Sex
Sex \ Question Q1 Q2 Q3 Q4 Q5 Q6 Q7 Q8 Q9 Q10 Q11 Q12 Q13 Q14 Q15 Q16 Q17 Q18 Q19 Q20 Q21 Max Dev Female 1.24 0.75 0.8 1.18 0.94 0.64 1.26 0.55 0.65 0.55 0.15 0.54 0.77 1.35 0.87 0.77 1.21 0.75 0.88 0.57 0.84 1.35From table 3, the deviation between each question’s minimum and maximum average of the stations can be calculated, as shown in table 5 below. The deviations of the questions are mostly below 1, with a maximum deviation of 1.4 at question 7.
Table 5: Deviation between minimum average and maximum average of each station The deviations are very small for each question, thus the effects of different stations and gender does not have a major effect on all the answered questions and can be seen as equally important to all aspects to the degree of importance determined.
5. Data Analysis
5.1) Introduction
This section stipulates the collected data's results, showing the importance of certain technical and service aspects of the coaches. It also, determines the importance of these aspects to certain age groups, genders, and travelling times per week. The collected data was analysed on answered questions' scoring on the scale of 1 to 10. Both important and less important aspects are discussed, with the more important aspects discussed in detail.
5.2) Analysis of the age distribution
The analysis of the age distribution gives an indication to which age group of the population the changes made will affect the most. It also indicates what the relative age distributions are of the everyday commuters.
The analysis showed that 79% of the survey population was aged between 22 years and 48 years of age, and 92% between 19 years and 50 years of age. Through the age analysis it is clear that there are not a large majority of people above 50 years which still commute on the trains. See Appendix 10.6 for the age distribution table, with the marked age segments. The percentages of age groups distributed over every 10 year age difference was calculated using a frequency table, seen in table 6, and plotted onto a pie chart shown in figure 6. This shows the two highest number of people, each a representation of 31% of the total survey
Deviation between Minimum Average and Maximum Average of each Station
Ques Stations Q1 Q2 Q3 Q4 Q5 Q6 Q7 Q8 Q9 Q10 Q11 Q12 Q13 Q14 Q15 Q16 Q17 Q18 Q19 Q20 Q21 Bellville 8.12 8.85 8.70 8.68 5.68 5.46 6.63 8.00 8.71 8.36 9.34 7.77 8.96 7.83 7.52 7.91 6.65 7.49 8.42 8.51 8.59 Brackenfell 7.98 9.30 9.28 9.03 6.28 5.72 6.33 8.20 8.74 8.36 9.16 7.70 8.48 7.33 7.97 7.92 7.08 7.23 8.28 8.48 8.62 Stellenbosch 8.76 9.11 9.29 8.92 6.00 5.88 7.73 8.41 9.17 8.45 9.39 8.21 9.18 8.52 8.38 8.76 7.74 8.45 9.08 9.15 8.97 Grand Total 8.21 8.96 8.89 8.78 5.83 5.57 6.77 8.10 8.79 8.37 9.32 7.83 8.92 7.87 7.73 8.05 6.90 7.61 8.51 8.6