Journal homepage: https://jurnal.unej.ac.id/index.php/JID
The Development of Web-based Graphical User Interface for Learning and Fitting
Generalized Estimating Equation with Spline Smoothers
Tirta, IM.*, Anggraeni, D. and Octaviani, L.C.
Mathematics Department, The University of Jember, Jember, Indonesia *E-mail: [email protected]
ABSTRACT
Statistical modeling (regression analyses) have been growing rapidly into various directions to accommodate various data conditions. For longitudinal or repeated measures data, one of the suitable models is GEE (Generalized Estimating Equation). In practice, to do complex modeling such as GEE, the use of statistical software is necessary and it is available on free open source software R. However, GEE modeling on R can only be access through command line interface (CLI), and most practical researchers very much rely on Graphical User Interface (GUI) based statistics software. To make access to GEE (both order 1 and 2) much easier, we developed, using Shiny toolkit, two types of web-based GUI, standard pull down menu type and e-module type (with narrative theories) that can be utilized for learning and fitting GEE. This paper discusses the features of the interfaces and illustrates the use of them.
Keywords: longitudinal data, Generalized Estimating Equation (GEE), exponential families, statistical modeling, correlated response, nonparametric, natural splines, shiny toolkit
INTRODUCTION
Statistical models have been developed into various directions to accommodate the objectives of researchers and the complexity of data (in term of sample size, the number, types and structure of variables involved). In practice, most applications of the models need statistics softwares. Majority of practical researches can only access models those are already implemented in commonly available GUIbased softwares, while actually, statistics theories grows much more rapidly than those readily implemeted in those type of softwares. This situation worries statisticians (Wallace et al., 2012) that “practitioners continue to use inappropriate or suboptimal methods due to their being restricted to what is made available via GUIs”.
New statistical methods are most frequently implemented or tested using open source R, and R has rich collections of the most recent (currently developed) or advanced statistical methods. However, all of them (including GEE) are still based on script or CLI, hence they cannot be utilized by majority of ‘practitioners’. For ordinary and occasional R users, even installing R with extended specific packages are also not simple.
The need for developing GUI for R, were already recognized arround last decade and several GUIs have been developed such as Rcommander which covers most basic statistics (Fox, 2005), RKWard (Rodigeret al., 2012), and Deducer (Fellows, 2012). R
Commander and Deducer have plug-in system to facilitate other programmers to extend the coverage. However, GEE has yet not been implemented either in the core or as plug-ins of the above GUIs.
The development of Web-based GUI has becoming easier since the release of shiny framework (Chang et al. 2015). Such framework has been implemented for unifying regression analysis (in pulldown menu type) for independent/ univariate responses (Tirta, et al.2017). In this paper we develop web-GUI and in e-tutorial/e-module type. for easier, friendlier access and guided application of GEE (order 1 and order 2) both in pull down menus and e-module types. In addition we extend the GEE by combining with spline smoother on the mean model.
The rest of the paper is organized as follows: section II briefly summarizes theory of GEEs, section III describes the main methods or tools, section IV discusses the results and numerical illustration and section V concludes the results of the study.
REVIEW OF GEE GEE Order 1
Original GEE (later known as GEE 1 or GEE order 1) was formally introduced by Liang and Zeger and Zeger and Liang in 1986. GEE can be considered as extension of GLM (Generalized Linear Model, McCullagh & Nelder, 1989) to account for correlation in the responses. These type of responses are commonly found in repeated meassurement or
64 The Development of Web-based Graphical User Interface… (Tirta, et al)
longitudinal data. The type of distributions of data considered in this model are mainly those from exponential family distribution with corresponding valid link functions (McCullagh & Nelder, 1989). The mean responses are also modeled similarly to GLM with appropriate link function,g, as given in equation (1).
p j j ij i x g 0 ) (
(1)forpnumber of predictors.
The most common correlation structures available for GEE are: (a) exchangeable (uniform) with 1 correlation parameter (cp), (b) AR (auto regressive)-1 with 1 cp, (c). Independence no cp (identic with GLM) and (d) unstructured with (k2-k)/2 cp’s, for responses with k cluster/ repeated measurement. The form of the correlation matrices are as given in equation 2(a)-2(d). (a) 1 1 1 L M O M M L L , (b) 1 1 1 2 1 2 1 L M O M M L L k k k k (c) 1 0 0 0 1 0 0 0 1 L M O M M L L , (d) 1 1 1 2 1 2 21 1 12 L M O M M L L k k k k (2) GEE Order 2
In GEE (order 1), the scale parameter is considered as constant. GEE order 2 extends the GEE with possibility of modeling the scale parameter to be dependant upon some predictors (in our case are limited to linear predictors). That is, in addition to model for mean, there is also model for scale parameter as given in equation (3) . 0
q j ij j x
(3)As being well known, that misspesification of correlation structure in GEE 1, does not influence the point estimates of the regression parameter β, however it does influence their efficiency as indicated by their standard error (Hidayatiet al.). Therefore it is still important to check the best correlation structure as well
as the model for the scale parameter. In addition to the model of scale parameter, GEE2 also allows the correlation to have one of two available link functions, these are identity and Fizsher.
Considering Smoother for the mean model Modeling regression parameter as linear with composition of link function, sometime is not sufficient to account for nonlinearlity in the predictors. In other words, there is a need to have model that can be considerd as extention of GAM for GEE. Recently, there are many sugesstion in the discussion forum to include natural or b-spline smoother in the model. This is possible since natural and b-spline are quite flexible in R to be combined with other model (such as classes of lm() and glm(), and gee ()).
METHODS
The web-based interfaces are built using shiny toolkit applied on R-shiny server from Rstudio group (Changet al., 2015). We develop two types of web-GUI interfaces: standard pull down menu type and e-tutorial/ e-module type for modeling longitudinal data, using GEE. The pulldown menu type consst of 2 main file, ui.r (for communication with user) and server.r (for communication with R server), while for e-module type the ui.r is replaced by index.html (where in this html file we can put several extension such as theory, step by step procedure by utilizing html features). Therefore, in addition to computational features (as in pulldown menu type), the e-module type has description of theory and narration for guiding users in every step of modeling and interpreting the outputs.
The main packages involved are (i) geepack (Yan, 2002; Jsgaard et al., 2006), especially the geese() and geeglm() functions, (ii) ggplot2 (Wickham, 2009) for ploting the smoother, (iii) psych (Revelle, 2016) for ploting diagram correlation and splines (R Core Team, 2016) for nonparametric modelling of the mean.
RESULTS AND DISCUSSION The developed interfaces are already uploaded on our ‘virtual statistics laboratory’. The pull down menus type can be accessed at
http://statslab-rshiny.fmipa.unej.ac.id/
RProg/MSD/ (See Fig 1) and for e-modul type, it can be accessed at http://statslab-shiny.fmipa.unej.ac.id/JORS/GEE/ (Fig 2).
Journal homepage: https://jurnal.unej.ac.id/index.php/JID
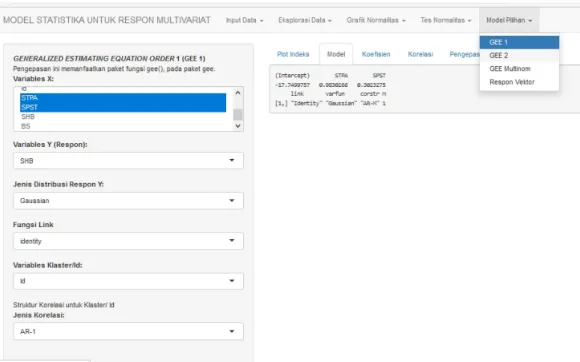
Figure 1. The appearance of the pulldown menu type. User can easily chooseariables, type of distributions, correlation structure
Figure 2. The appearance of theory and guided options for predictor, family and correlation structures in e-module type
66 The Development of Web-based Graphical User Interface… (Tirta, et al)
Data Ilustration
As illustration, we simulated data having both continuous (SHB) and binary responses (BS) which are measurred repeatedly (in the form of five Tests,T1-T5). To calculate the correlation matrix and to display correlation diagram (among the repeated responses), the name for id and for the repeated observations must be properly chosen. The following is the correlation matrix and correlation diagram (Fig 3) between repeated observations. This correlation matrix or diagram can give rough idea on the candidate of the suitable type of correlation structure (in this case AR-1 seems appropriate, slightly decreases as the test distance further away). Note that on the web, for the same name user may find slightly
different data since they are randomly simulated. T1 T2 T3 T4 T5 T1 1.000 0.951 0.834 0.793 0.785 T2 0.951 1.000 0.905 0.858 0.818 T3 0.834 0.905 1.000 0.943 0.891 T4 0.793 0.858 0.943 1.000 0.943 T5 0.785 0.818 0.891 0.943 1.000
We check the possibility of including smoother in the mean model and inspect the scatter plot of some predictors vs response. After comparing the graphs, we see thatvariable STPA with df =3 seems worth to include in the mean model (Fig 4). For distribution, link and correlation structure, we can easily select the menus for these choices (see Fig 2).
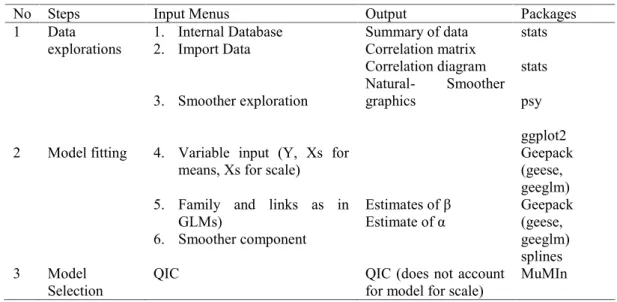
Table 1. Main computational features of the Interfaces
No Steps Input Menus Output Packages
1 Data
explorations 1. Internal Database2. Import Data 3. Smoother exploration Summary of data Correlation matrix Correlation diagram Natural- Smoother graphics stats stats psy ggplot2 2 Model fitting 4. Variable input (Y, Xs for
means, Xs for scale) Geepack(geese,
geeglm) 5. Family and links as in
GLMs)
6. Smoother component
Estimates of β
Estimate of α Geepack(geese, geeglm) splines
3 Model
Selection QIC QIC (does not accountfor model for scale) MuMIn
Journal homepage: https://jurnal.unej.ac.id/index.php/JID
Figure 4. Smoother graphics of predictor (STPA) vs Response using natural cubic sline with df=3 The interpretation of the outputs is as usual
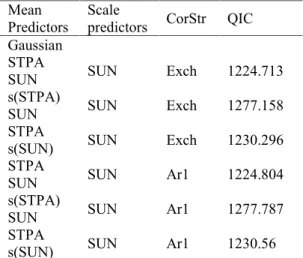
by checking the p-value (for the significance of the parameter) and the value of QIC for checking the goodness of fit of the model. In this illustration, all the regression coefficient (for both mean and scale parameter) are significant (p-val<5%). User can modify (change) the model (family, correlation structure etc) and compare the value of the QIC (Note that model for scale parameter does not affect QIC, so for scale model we only check their p-values). The results for some tested models are summarized in Table 2, follows by the full output of what is considered as the best model. In modelling with GEE, a predictor cannot be at the same time as linear and nonparametric predictor (in our interface using natural spline). In practice, for prediction purposes, the repeated measurement (in this illustration is Test) may be retained in the model although their parameters are not significant especially where prediction for every level of the repeated factor are needed.
Table 2. Comparison of the QIC values for some tested models
Mean
Predictors Scalepredictors CorStr QIC Gaussian
STPA
SUN SUN Exch 1224.713
s(STPA)
SUN SUN Exch 1277.158
STPA
s(SUN) SUN Exch 1230.296
STPA
SUN SUN Ar1 1224.804
s(STPA)
SUN SUN Ar1 1277.787
STPA
s(SUN) SUN Ar1 1230.56
In this illustration, we found that the QIC values (i) under Gaussian (identity) and Gamma (log) are simmilar, (ii) without smoother are slightly smaller, (iii) with exchangeable correlation structure are slightly smaller.
$mean (estimates)
estimate san.se wald p
(Intercept) 12.4124717 11.5776244 1.14941705 0.2836712146 TesT2 -0.7975178 1.1823131 0.45500458 0.4999678898 TesT3 0.5604951 2.5716382 0.04750331 0.8274660888 TesT4 0.9635519 2.7915540 0.11914016 0.7299689376 TesT5 0.8370444 2.7818546 0.09053742 0.7634950413 STPA 0.6055147 0.1578732 14.71066235 0.0001253356 SUN 0.2710924 0.1132546 5.72958620 0.0166814129 $correlation
estimate san.se wald p
alpha 0.7842216 0.04402325 317.3316 0 $scale
estimate san.se wald p
(Intercept) 177.971103 172.87004 1.059887 0.3032410 SUN 3.193302 2.40771 1.759024 0.1847463 QIC.QIC
68 The Development of Web-based Graphical User Interface… (Tirta, et al)
The final model can be expressed as follows SUN STPA y y y y y E E 2711 . 0 6055 . 0 8370 . 0 12.4125 9635 . 0 12.4125 0.5605 12.4125 0.7975 12.4125 12.4125 5 4 3 2 1 ) ( Y and scale=177.97+3.1933*SUN
Overall, the response Y has gaussian distribution with identity link and among the repeated observations have exchangeable type of correlation structure with estimated correlation parameters equal 0.78.
Discussion
Our web GUI interfaces fill the gap of the absence of GUI for GEE (both order 1 and 2) in R. In term of available of choices of components, our web-GUI offers all of the common choices and the output of geese() function (ready for modeling GEE1 and GEE2). In addition (which are not part of geepack package) we also offer (ii) correlation matrix and correlation diagram, (iii) smoother model and graphics, and (iv) QIC as guidance for choosing a better model. Users can utilized those option without worrying about the syntax of all used functions, or even about installing them on their computer. The e-module type not only describe summary of theory (as found in commonly available e-module, such as one of popular online text book on statistics) (StatSoft, Inc., 2013), but also present proper mathematics notation and offer the users to dynamically choose different data (including their own data) and follow step by step checking various models and interpretation of the output.
Limitation and future development
Our web-GUI has some limitation including: (i) responses distributions are limited to exponential family distributions, (ii) model for scale is limited to linear model with identity link, (iii) QIC does not count for model for scale. We have recently initiated extending the interfaces to include GEE for nominal or ordinal multinomial responses through multgee
package (Touloumis, 2015) and possibly vector generalized linear and additive model (VGAM) (Yee, 2016) and these features will be properly added in near future. For e-module type the structure of description of the theory and the step of modelling need to be continuously improved by considering user’s feedback.
CONCLUSION
Our web-based GUI on GEE can be accessed with various type of gadgets and browser without worrying about scripting, collecting and installing R and related packages. Our web-GUI offer all important options of geese() as if it is accessed via script. In addition, the web also calculate and offer sample correlation and correlation diagram, and QIC of each chosen model. User are also possible to accomodate smoother (using natural cubic spline) in modeling mean responses.
ACKNOWLEDGEMENT
The web GUI for correlated response data is part of wider research topics supported by PUPT RISTEK-DIKTI grant 2016. We thank anonymous reviewer for comments and suggestions to improve this manuscript.
REFERENCES
Barton, K. 2016. MuMIn: Multi-Model Inference. R package version 1.15.6.
https://CRAN.R-project.org/package=MuMIn.
Chang, W., Cheng, Allaire,J.J., Xie,Y.,& McPherson, J. 2015. shiny: Web Application Framework for R. R package version 0.11.1. http://CRAN.R-project.org/package=shiny.
Fellows, I. 2012. Deducer: A Data Analysis GUI for R. Journal of Statistical Software,49(8), 1-15. URL
http://www.jstatsoft.org/v49/i08/.
Fox, J. 2005. The R Commander: A Basic-Statistics Graphical User Interface to R.Journalof Statistical Software, 14(9), 1-42. URLhttp://www.jstatsoft.org/v14/i09/.
Hidayati,R.D., Tirta,IM.,& Dewi, Y.S. The Efficiency of First (GEE1) and Second (GEE2) Order “Generalized Estimating Equations” for Longitudinal Data. Jurnal ILMU DASAR, 15(1), 29-35
Jsgaard, S., Halekoh, U.,& Yan, J. 2006. The R Package geepack for Generalized Estimating Equations.Journal of Statistical Software, 15(2),1-11.
Journal homepage: https://jurnal.unej.ac.id/index.php/JID Liang, K.-Y.,& Zeger, S.L. 1986. Longitudinal
Data Analysis UsingGeneralized Linear Models.Biometrika, 73,13-22
McCullagh, P.,& Nelder, J.A. 1989. Generalized Linear Models. NewYork: Chapman and Hall.
R Core Team. 2016. R: A language and environment for statistical computing. Vienna, Austria:R Foundation for Statistical Computing. URL https://www.R-project.org/.
Revelle, W. 2016. psych: Procedures for Personality and Psychological Research. Northwestern University, Evanston, Illinois,
USA,
http://CRAN.R-project.org/package=psych Version = 1.6.4. Rodiger, S., Friedrichsmeier, T., Kapat, P.,&
Michalke, M. 2012. RKWard: A Comprehensive Graphical User Interface and Integrated Development Environment for Statistical Analysis with R.Journal of Statistical Software, 49(9), 1-34. URL
http://www.jstatsoft.org/v49/i09/.
StatSoft, Inc. 2013. Electronic Statistics Textbook. Tulsa, OK: StatSoft. WEB: http://www.statsoft.com/textbook/.
Tirta, IM., Anggraeni, D. Pandutama M. 2017. Online Statistical Modeling (Regression
Analysis) for Independent Responses. Journal of Physics: Conf. Series 855 2017 012054.
Touloumis, A. 2015. R Package multgee: A Generalized Estimating Equations Solver for Multinomial Responses. Journal of Statistical Software, 64(8), 1-14. URL
http://www.jstatsoft.org/v64/i08/.
Wallace, B.C., Dahabreh, I.J., Trikalinos,T.A., Lau, J., Trow, P.,&Schmid, C.H. 2012. Closing the Gap between Methodologists and End-Users: R as a Computational Back-End.Journal of Statistics Softwares, 49(5). Wickham, H. 2009.ggplot2: Elegant Graphics
for Data Analysis. New York: Springer-Verlag.
Yan, J.2002.geepack: Yet Another Package for Generalized Estimating Equations R-News, 2/3, 12-14.
Yee, T.W. 2016. VGAM: Vector Generalized Linear and Additive Models. R package version 1.0-2. URL http://CRAN.R-project.org/package=VGAM
Zeger, S. L., & Liang, K.-Y. 1986. Longitudinal Data Analysis forDiscrete and Continuous Outcomes.Biometrics, 42, 121-130.