Extracting Insights from Differences: Analyzing
Node-aligned Social Graphs
by
Srayan Datta
A dissertation submitted in partial fulfillment of the requirements for the degree of
Doctor of Philosophy
(Computer Science and Engineering) in The University of Michigan
2019
Doctoral Committee:
Associate Professor Eytan Adar, Chair Associate Professor Mike Cafarella Assistant Professor Danai Koutra Associate Professor Clifford Lampe
ACKNOWLEDGEMENTS
There are several people who made this dissertation possible, first among this long list is my adviser, Eytan Adar. Pursuing a doctoral program after just finishing un-dergraduate studies can be a daunting task but Eytan made it easy with his patience, kindness, and guidance. I learned a lot from our collaborations and idle conversations and I am very grateful for that.
I would like to extend my thanks to the rest of my thesis committee, Mike Ca-farella, Danai Koutra and Cliff Lampe for their suggestions and constructive feed-back. I would also like to thank the following faculty members, Daniel Romero, Ceren Budak, Eric Gilbert and David Jurgens for their long insightful conversations and suggestions about some of my projects.
I would like to thank all of friends and colleagues who helped (as a co-author or through critique) or supported me through this process. This is an enormous list but I am especially thankful to Chanda Phelan, Eshwar Chandrasekharan, Sam Carton, Cristina Garbacea, Shiyan Yan, Hari Subramonyam, Bikash Kanungo, and Ram Srivatasa.
I would like to thank my parents for their unwavering support and faith in me. This dissertation would not be possible without their constant support throughout the long process of pursuing a Ph.D.
My dissertation is supported by University of Michigan computer science depart-ment and school of information. My projects were partially supported by grants from the University of Michigan and NSF. Additionally, I would like to thank Jason Baum-gartner for compiling the Reddit dataset, the one I used throughout this dissertation.
TABLE OF CONTENTS
DEDICATION . . . ii
ACKNOWLEDGEMENTS . . . iii
LIST OF FIGURES . . . viii
LIST OF TABLES . . . xi ABSTRACT . . . xii CHAPTER I. Introduction . . . 1 1.1 Dissertation Overview . . . 5 1.2 Motivation . . . 6 1.3 Contributions . . . 7
II. Network Representation of Data and Community Detection Algorithms . . . 9
2.1 Network representation of data . . . 9
2.1.1 Link inference . . . 9
2.1.2 Node aligned networks . . . 11
2.2 Community detection algorithms . . . 12
2.2.1 Fastgreedy . . . 12 2.2.2 InfoMap . . . 12 2.2.3 Label propagation . . . 13 2.2.4 Multilevel . . . 13 2.2.5 Spinglass . . . 13 2.2.6 Walktrap . . . 13 2.3 Summary . . . 14
3.1 Choice of the Reddit dataset . . . 15
3.2 Related work . . . 16
3.2.1 Trolling in Reddit . . . 18
IV. Identifying Misaligned Inter-Group Links and Communities in Reddit . . . 19 4.1 Overview . . . 19 4.2 Related work . . . 22 4.3 Dataset . . . 22 4.4 Method . . . 23 4.4.1 Similarity Metrics . . . 23 4.4.2 Matrix Generation . . . 25
4.4.3 Pairwise relationships between subreddits . . . 25
4.4.4 Subreddit networks . . . 28
4.5 Results . . . 30
4.5.1 Matrices . . . 31
4.5.2 Characterizing subreddit pairs . . . 33
4.5.3 Characterizing individual subreddits . . . 35
4.5.4 Characterizing subreddit networks . . . 38
4.5.5 Summary . . . 42
4.6 Discussion . . . 43
4.6.1 Limitations . . . 44
4.6.2 Future extensions . . . 44
4.7 Conclusion . . . 45
V. Extracting Inter-community Conflicts in Reddit . . . 47
5.1 Overview . . . 47
5.2 Related Work . . . 50
5.2.1 Conflicts in Social Media . . . 50
5.2.2 Signed Social Networks . . . 51
5.3 Dataset . . . 51
5.4 Identifying Inter-community Conflicts . . . 51
5.4.1 Controversial Authors . . . 54
5.5 The Subreddit Conflict Graph . . . 55
5.5.1 Constructing the Conflict Graph . . . 55
5.5.2 Eliminating Edges Present due to Chance . . . 55
5.5.3 Conflict Graph Properties . . . 56
5.6 Co-Conflict Communities . . . 62
5.6.1 Creating the Co-conflict Graph . . . 62
5.6.2 Co-conflict Graph Properties . . . 63
5.6.3 Community Detection Results . . . 64
5.7 Conflict Dynamics . . . 65
5.8.1 Downvotes for determining community conflicts . . 69
5.8.2 Subreddit conflict due to ideological differences . . . 70
5.8.3 Robustness of threshold parameters . . . 71
5.8.4 Identifying communal misbehavior . . . 72
5.8.5 Co-conflict graph . . . 73
5.8.6 Limitations . . . 74
5.8.7 Implications . . . 75
5.9 Conclusion . . . 76
VI. Identifying, analyzing and predicting banned subreddits . . . 77
6.1 Overview . . . 77
6.2 Data Collection . . . 79
6.3 Properties of the Banned . . . 81
6.3.1 Banned subreddit comment properties . . . 82
6.3.2 Banned subreddit language . . . 84
6.3.3 Subreddit ban times . . . 84
6.3.4 Banned subreddit active time . . . 86
6.4 Clustering Subreddits . . . 86 6.4.1 Textual features . . . 86 6.4.2 Interaction features . . . 87 6.4.3 Measuring Similarity . . . 89 6.4.4 Generating Clusters . . . 89 6.4.5 Results . . . 90 6.4.6 The ‘Noise’ . . . 91 6.5 Prediction . . . 92
6.5.1 Classifying Using Text . . . 93
6.5.2 Classifying Using Interaction . . . 93
6.5.3 Combining Classifiers . . . 93
6.5.4 Banning-by-example . . . 94
6.5.5 Predictive Words . . . 96
6.6 Discussion and Limitations . . . 97
6.7 Conclusion . . . 98
VII. An Interactive Visualization Tool for Community Detection 99 7.1 Overview . . . 99
7.2 Related Work . . . 103
7.2.1 Interactive Machine Learning . . . 103
7.2.2 Ensembles and Community Detection . . . 105
7.2.3 Active learning . . . 106
7.3 The Trouble With Community Detection . . . 106
7.3.1 The Analytical Pipeline . . . 109
7.4 The CommunityDiff Design . . . 111
7.4.2 Design Guidelines . . . 116
7.5 System Details . . . 118
7.5.1 System and Interface Architecture . . . 118
7.5.2 Algorithmic Details . . . 121
7.5.3 Visualization and Interface Elements . . . 127
7.5.4 Human-in-the-Loop Machine Learning . . . 132
7.6 Evaluation . . . 134 7.6.1 Ensemble Evaluation . . . 135 7.6.2 Co-Community Evaluation . . . 136 7.6.3 User Study . . . 137 7.7 Case study . . . 140 7.8 Discussion . . . 141 7.9 Conclusion . . . 144
VIII. Conclusion and Future Work . . . 145
8.1 Summary . . . 145
8.2 Extensions . . . 147
LIST OF FIGURES
Figure
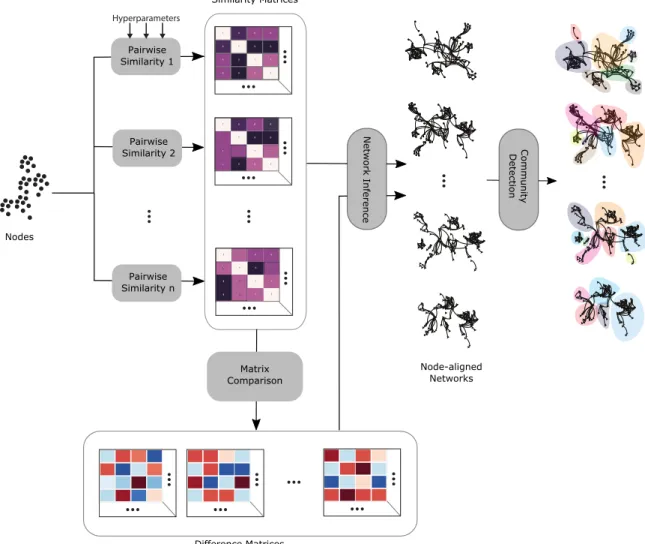
1.1 A general pipeline for analyzing network-based communities from a set of given nodes/entities. . . 1
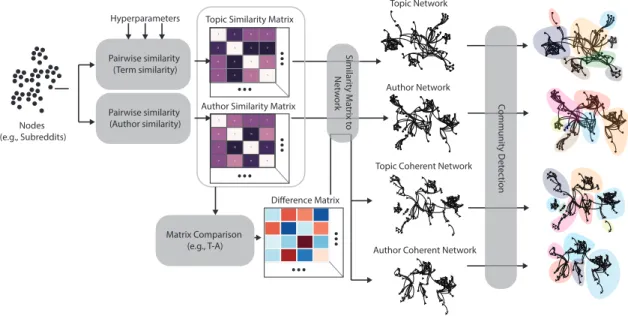
1.2 An expanded pipeline for analyzing network-based communities from a set of given nodes/entities. . . 3
1.3 A general methodology for identifying conflicts and creating a conflict graph from a set of given user communities. . . 4
4.1 Network inference pipeline. . . 20
4.2 Computing the z2-score. . . 24
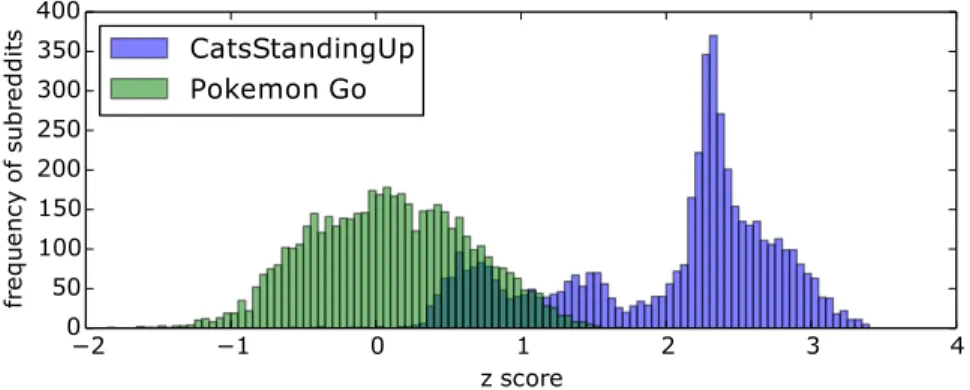
4.3 Comparison between z-score distribution in rank difference list of all other subreddits for two subreddits: CatsStandingUp and pokemongo 28
4.4 Author similarity vs. term similarity for all pairs of subreddits that have non-zero author similarity score. . . 31
4.5 Distribution of z2-scores for all pairs of subreddits. . . . 32
5.1 General methodology for identifying conflicts and creating the conflict graph. . . 53
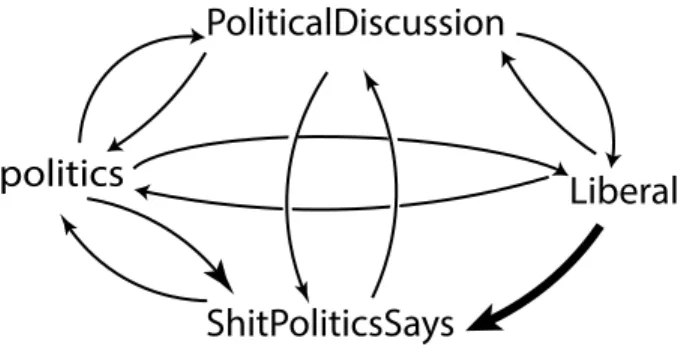
5.2 Ego network for the subredditLiberal. . . 57
5.3 Conflict intensity vs intensity of reciprocation in the subreddit con-flict graph. . . 58
5.4 The Co-conflict Graph. . . 66
5.6 Rank by intensity of being targeted for four political subreddits over 2016. . . 67
5.7 Rank by conflict intensity for four political subreddits over 2016. . . 68
6.1 Average text similarity with banned subreddits banned within one day window of self-ban binned daily from Jun 2015 to Mar 2018. . . 81
6.2 Banned subreddit comment count histogram with 100 bins. The x-axis is log-scaled. . . 82
6.3 Banned and unbanned subreddit deleted comment percentages. . . . 83
6.4 Subreddit ban time binned weekly from Jan 2014 to Mar 2018. . . . 85
6.5 A bar chart showing the frequency of subreddit bans per day from January 2010 to March 2018. . . 85
6.6 A histogram showing active time of banned subreddits in our dataset binned weekly. . . 86
6.7 Largest cluster and noise subreddit comment count histograms with 100 bins. The x-axis is log-scaled. . . 91
6.8 Average precision at 10 vs the number of example subreddits (n) at different α values. . . 95
6.9 Average precision at 10 vs the number of example subreddits (n) using all unbanned subreddits from January 2018. . . 96
7.1 CommunityDiff interface. . . 102
7.2 Different kinds of errors in community detection. . . 109
7.3 Exploration process from an unlabeled graph to the final partition. . 110
7.4 Elaboration of different components of the ensemble heatmap and the dendrogram. . . 112
7.5 A partial view of the co-community lists before (figure on top) and after (figure on bottom) Alice’s decisions. . . 116
7.6 Four different views for the ensemble space heatmap. . . 119
7.8 The Co-Community Lists. . . 122
7.9 A graphical example of ensemble generation through the co-community graphs. . . 125
7.10 Comparison between average NMI values with ground truth. . . 137
7.11 A screenshot showing MNIST handwritten digits network in Com-munityDiff. . . 138
7.12 A screenshot showing 2016 Reddit co-conflict network in Communi-tyDiff. . . 140
LIST OF TABLES
Table
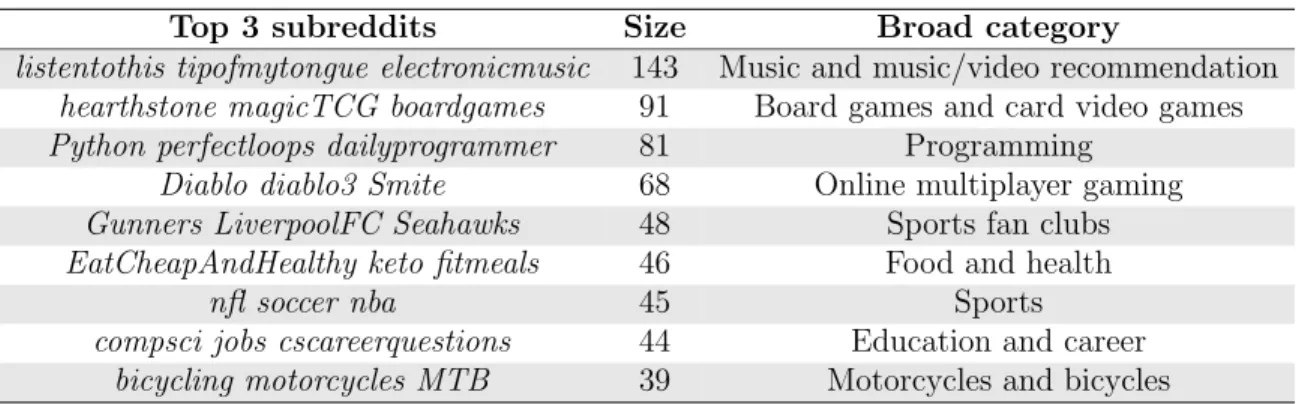
4.1 Top communities in the author similarity network. . . 39
4.2 Top 10 communities in the term similarity network. . . 40
4.3 Some interesting misaligned communities in the topic-coherent network. 41
5.1 Top-10 targeted subreddits ranked by total incoming intensity. . . . 59
5.2 Top 10 subreddits (conflict source) ranked by total conflict intensity. 60
5.3 Top 10 subreddits (conflict source) ranked by average conflict intensity. 60
5.4 Top 10 subreddits with highest percentage of positively perceived controversial authors. . . 61
5.5 Banned subreddits and their ranks and values by average conflict intensity and con author percent. . . 63
5.6 Communities in co-conflict network with at least 10 nodes. . . 65
6.1 Common reasons for banning a subreddit, number of subreddits banned for the reason and the top 5 largest banned subreddits in that cate-gory. . . 80
6.2 Banned subreddit clusters, their sizes, the top 5 largest banned sub-reddits in the cluster and common reasons for banning. . . 89
6.3 Top 10 largest subreddits in noise, their comment count after remov-ing deleted comments and their characteristics . . . 91
ABSTRACT
Social media and network research often focus on the agreement between dif-ferent entities to infer connections, recommend actions and subscriptions and even improve algorithms via ensemble methods. However, studying differences instead of similarities can yield useful insights in all these cases. We can infer and understand inter-community interactions (including ideological and user-based community con-flicts, hierarchical community relations) and improve community detection algorithms via insights gained from differences among entities such as communities, users and algorithms. When the entities are communities or user groups, we often study the difference via node-aligned networks, which are networks with the same set of nodes but different sets of edges. The edges define implicit connections which we can infer via similarities or differences between two nodes.
We perform a set of studies to identify and understand differences among user groups using Reddit, where the subreddit structure provides us with pre-defined user groups. Studying the difference between author overlap and textual similarity among different subreddits, we find misaligned edges and networks which expose subreddits at ideological ‘war’, community fragmentation, asymmetry of interactions involving subreddits based on marginalized social groups and more. Differences in perceived user behavior across different subreddits allow us to identify subreddit conflicts and features which can implicate communal misbehavior. We show that these features can be used to identify some subreddits banned by Reddit. Applying the idea of dif-ferences in community detection algorithms helps us identify problematic community assignments where we can ask for human help in categorizing a node in a specific community. It also gives us an idea of the overall performance of a particular com-munity detection algorithm on a particular network input. In general, these improve ensemble community detection techniques. We demonstrate this via Community-Diff (a community detection and visualization tool), which compares and contrasts
different algorithms and incorporates user knowledge in community detection output. We believe the idea of gaining insights from differences can be applied to several other problems and help us understand and improve social media interactions and research.
CHAPTER I
Introduction
Social media plays a major role in our day-to-day life. Online social networks like Facebook and Twitter have billions of users who connect with friends and family, find new friends and post updates about their daily lives. Online discussion forums and news aggregators like Reddit provide hundreds of millions of users a place to share, view and discuss different opinions with like-minded people. People from all over the world jointly contribute to write and maintain over 5 million articles in Wikipedia. Social media sites are often used for different social or political discussions and movement. Social network analysis helps us understand this phenomenon and improve downstream applications. Social media websites are also plagued by user misbehavior in a variety of forms [5, 35, 57, 58, 83, 108] including but not limited to spamming, trolling, flame wars and griefing. In a large number of cases, the extent of this abuse is not well documented. Network modeling of online social media is a powerful tool in understanding social behavior and gaining new insights, improving applications for recommendation systems, online marketing, and providing better usability and user experience for millions of social media users.
Nodes Similarity Matrix
...
...
Pairwise Similarity Network Communities Network Inference Community DetectionFigure 1.1: A general pipeline for analyzing network-based communities from a set of given nodes/entities. Apart from community detection many other network analysis algorithms like centrality measures can be applied on the inferred network.
nodes or entities (an entity can be anything ranging from a user, a post/comment to a discussion topic or a group of users in different contexts) and finding groups or communities of the said entities. Semantically, these links may encode a variety of relationships such as friendOf (social media friend networks), similarTo (recom-mender system networks), or isA (Wordnet, a semantic network of English words). They can be directional, weighted and temporally varied. Moreover, these links can either be explicit (friendship links between two users) or inferred (many common users between two user groups) [27]. Where explicit, the links between individuals (person-to-person links) are measures of friendship (Facebook), interest (Twitter), or other relationships (family, fan, etc.). When an online system does not have features that explicitly support linking, we rely on inferred connections. For example, we may infer that two people are “linked” if they are part of the same discussion list. In-ference is sometimes necessary in the case of person-to-person links and often in the case of community-to-community links where the social media websites rarely pro-vide explicit linking. Inference can be useful on explicit networks also. A friendship network can be ‘reduced’ based on likes/messages etc.
Apart from social networks, link inference and community detection are used in many other kinds of networks. For example, functional groups in biological net-works are identified using community detection [29, 91]. In machine learning and data mining, many non-network problems are converted into a network analysis problem (including community detection problems) by inferring links between rel-evant nodes/entities. For example word networks in natural language processing (NLP) [139] or user-item recommender models [94] allow us to use community detec-tion to solve problems as diverse as keyword detecdetec-tion or movie recommendadetec-tions. Most of these problems follow a broad general pipeline depicted in Figure 1.1. This pipeline starts with a set of nodes or entities and some similarity measure is applied to the entities to derive a similarity matrix. A similarity matrixAcontains the similarity scores between all pairs of nodes (the cell A[i, j] stores the similarity score between nodes i and j). The similarity matrix is processed into a network and then commu-nity detection and further network analysis algorithms are applied to the network. It is worth noting that there are other methods of inferring a connection between two individuals. In social network analysis, sometimes networks are constructed by communication behavior (e.g., retweeting, chat, liking, lending money, etc.). We can modify the pipeline to include these kinds of networks as well.
Community-to-community links are less common compared to links between a pair of individuals and most of the time, these are inferred links. This type of
in-ferred link and community detection are used for deciphering inter-community mobile communications [90]. Inter-community links can be useful for recommender systems when suggesting similar communities to a user in a forum or another social media website. These link might also depict negative relationships. For example, Kumar et al. [109] studied controversial cross-postings in Reddit to identify specific community conflicts. Nodes
...
...
...
...
...
...
...
...
Pairwise Similarity 1 Pairwise Similarity 2 Pairwise Similarity n Hyperparameters Matrix Comparison Similarity Matrices...
...
...
...
...
...
...
Difference Matrices...
...
Node-aligned Networks Network I nference Community DetectionFigure 1.2: An expanded pipeline for analyzing network-based communities from a set of given nodes/entities.
However, inferred links can vary wildly based on the metric used for inference (for example, author overlap vs topical similarity between two user groups) and this
difference often provides useful insights. Expanding the network analysis pipeline, we can run different pairwise similarity metrics in parallel to infer different kinds of pairwise links and compare them. We can create a similarity matrix for each different
similarity measure and compare the difference between two similarity measures by computing a difference matrix using corresponding two similarity matrices. We can create networks from both similarity and difference matrices. These networks share the same set of nodes (the set of nodes we start with) but a different set of links. We call these node-aligned networks. We can apply community detection on these networks to get an idea about how nodes are grouped together via a certain kind of similarity (for example, two users who talk about similar topics in social media should be grouped together if we are evaluating users via topical similarity of their posts) and how grouping via similarity measures differ from each other. Figure 1.2 shows a pictorial representation of this modified pipeline. Note that, this pipeline can be further expanded using data from different time periods (e.g. we can create a pipeline by using text/author similarity from few consecutive years to identify the temporal evolution of Reddit or change in behavioral patterns of its users).
Community A Community B anti-social social
“Bundle” of author messages Up-voted (rewarded) message
Down-voted (sanctioned) message
Neutral message Community
Controversial Author A B A B Conflict graph Conflic t edge
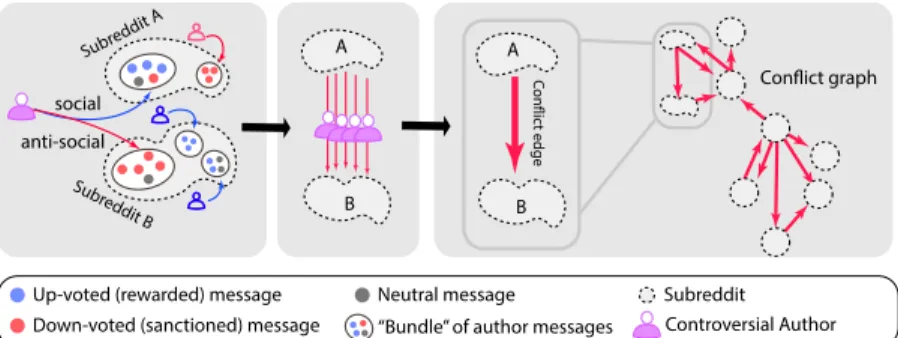
Figure 1.3: A general methodology for identifying conflicts and creating a conflict graph from a set of given user communities.
Inferred links between two nodes are not limited to different similarity metrics either. For two user groups, we can deduce antagonistic relationships (conflicts) if same set of users behave or perceived to behave (based on the groups’ reward/sanction mechanism including up/downvotes ) differently depending on the group as shown in Figure 1.3. We call these particular users controversial authors and the edge as a conflict edge. Conglomerating these edges, we can create a conflict graph which documents conflicts given a set of user groups. Based on controversial authors, we can also infer which user groups are ‘targeted’ together and form a co-conflict graph with the same set of nodes. These node-aligned graphs documents conflict between
different user groups and can be used to identify and understand community con-flicts and communal misbehavior. This technique is less general as it makes use of user groups and not any set of entities, but still has wide applicability for any type of social network or social media site with a overlapping community structure like subreddits, Facebook pages and groups, online news communities and Twitter hash-tag communities (people who tweeted a particular hashhash-tag are part of that hashhash-tag community).
1.1
Dissertation Overview
In this dissertation, we focus on gaining insights from differences in four different projects. Two other common motifs in these projects are creation of node-aligned networks, and inferring community-to-community relationships. In the first project, we apply the expanded network analysis pipeline on subreddit comment text and authors to identify ‘misaligned’ links and communities in Reddit. We use author and textual overlap between pairs of subreddits to create a pair of subreddit similarity networks: author and term similarity networks. We use the difference between au-thor and text similarity to inferauthor-coherent links (high author similarity but low term similarity) and topic-coherent (high term but low author similarity) links and create a pair ofmisaligned networks. Note that the subreddit similarity networks and the misaligned networks are node-aligned networks as the nodes are subreddits in all of them. We provide the algorithm to identify these misaligned links and communi-ties and use them to decipher inter-group dynamics (hierarchical links, community fragmentation, communities with opposing viewpoints, satellite subreddits etc.).
In the second project, we identifydifferences in perceived commenting behavior of the same user within multiple subreddits and use it to identify subreddit conflicts. In this project, we build two node-aligned networks — the subreddit conflict network
which is a directed, weighted network depicting antagonistic subreddit relations and the co-conflict network which shows which subreddits are usually targeted together. We analyze these graphs to identify most instigating and targeted subreddits, find the relationship between subreddit size and conflict intensity, reciprocity of the conflicts and find implication behind certain subreddit bans.
To test the efficacy of these interaction features, we identified more than 1000 banned subreddits with at least 100 comments and used the interaction features along with text-based features to cluster and predict different kinds of banned subreddits. We improve the banned subreddit prediction result against an unbanned sample of the
same size by adding interaction features compared to using only textual features (with a significance level of 0.018). We also implement a banning-by-example paradigm where banned subreddits of a particular category can be identified using other banned subreddits in the same category as examples. We achieve 0.913 mean precision at k (k=10) measure for banning-by-example and this idea can be useful for community moderators in any social media.
Finally, we apply the idea of gaining insights from differences on the problem of choosing suitable community detection algorithms viaCommunityDiff, an
interac-tive visualization system that combines visualization and acinterac-tive learning to support the end-user’s analytical process. We create a mechanism for visualizing ensem-ble spaces (an abstract space where each point refers to a community detection al-gorithm), by leveraging differences in outputs of most commonly used community detection algorithms. CommunityDiff also features weighted combinations of
al-gorithm outputs, that can identify patterns, commonalities, and differences among multiple community detection algorithms. Among other features, CommunityDiff
introduces an active learning mechanism that visually indicates uncertainty about community labels (based on disagreement among different community detection algo-rithms) to focus end-user attention and supporting end-user control which ranges from explicitly indicating the number of expected communities to merging and splitting communities. Based on this end-user input, CommunityDiff dynamically recalcu-lates communities. We demonstrate the viability of our system through a study of speed of end-user convergence on satisfactory community labels. As part of
build-ing CommunityDiff, we describe a design process that can be adapted to other
Interactive Machine Learning (IML) applications.
1.2
Motivation
In their recent research Peel et al. [151] showed that there is not always a one-to-one correspondence between the communities determined by the network structure and node metadata. In fact, different node metadata can generate different group-ings. Metadata-based clustering can be viewed as a form of link inference where we draw a connection between individuals based on metadata similarity. The fact that there are differences in the generated networks is an argument for studying the dif-ference and find out where this difdif-ference is surprising and how it originates. Based of this idea, instead of the classical node-link structure of a network, we can view the relationship between two nodes or entities as a set of edge attributes or edge
metadata, where each edge attribute is based on a different metric. These attributes can be explicit (friendship between two social media users) or inferred (do their posts share enough textual similarity?). This gives rise to a set of node-aligned networks based on different attributes. The pre-existing pipeline for converting data science problems (Figure 1.1) to network analysis problems is easily extended to a highly parallel pipeline (Figure 1.2) which incorporates the idea of node-aligned networks. Note that, the node metadata and hence the edge metadata changes over time. We can create node-aligned networks based on the same similarity metric but at differ-ent timestamps. A natural extension of our view of networks is to replace node and edge metadata with a set of time-series data where each time-series corresponds to a different attribute.
Peel et al. also showed that any specific community detection algorithm may not perform well on all networks, which implies that the ability to choose correct algorithm for given task and the human in the loop learning for community detection is important. This is a major motivation behind designing CommunityDiff, an
interactive visualization tool to compare and select clustering algorithms which takes user inputs into account.
1.3
Contributions
The contributions of this dissertation are threefold. First, we provide a method-ology for understanding differences in inference in online user groups. These types on analysis can be used to identify and understand relationships among online com-munities including community hierarchies, comcom-munities with ideologically opposing viewpoints and community fragmentation. We can also identify individual commu-nity types (e.g., is the commucommu-nity a mainstream commucommu-nity or is it marginalized) using this methodology. By looking intodifferences in user behavior, we can identify community conflicts and show that some of the features we identify have implications for identifying communal misbehavior. We apply these features on top of textual features to identify specific types of community sanctions in Reddit (banned sub-reddits) and show significant improvement over using only textual features using a banning-by-example paradigm.
We applied these methodologies on Reddit where subreddits represent user-defined online communities, but our pipelines are generalizable to any online social media with community structure. All social media do not have explicit group structure like Reddit but we can infer communities via metadata (Facebook lists, Twitter hashtag
community) or graph alignment algorithms [86, 85, 192] as a preprocessing step and apply our pipeline. For conflict and communal misbehavior detection, our pipeline is even more generalizable as our user behavior based features are content agnostic and can be applied to communities with languages other than English.
Our final contribution is presenting CommunityDiff, an end-to-end
visualiza-tion tool to compare and contrast different community detecvisualiza-tion algorithms to choose the best algorithm and incorporate user knowledge into the final output by looking into differences in algorithms. This methodology is applicable to other sets of algo-rithms where the ground truth is scarce and there is a lot of disagreement among different algorithm outputs. Prime examples of these types of algorithms are cluster-ing and anomaly detection.
We demonstrate that studying differences of inference, user behavior, and algo-rithms is useful in multiple regards. We hope that our methodology and analyses would help to deal with problems of online communities and make understanding differences in algorithm outputs easier.
CHAPTER II
Network Representation of Data and Community
Detection Algorithms
2.1
Network representation of data
In many data mining and machine learning scenarios, data can be represented as networks or graphs. A graph G(V, E) consists of a set of vertices V and a set nodes edgesE. The set of verticesV encodes real-world entities which can range from users in a social network, webpages on the internet to words in text network and roads in the road networks. An edge or link e in E represents connection between a pair of verticesvi and vj. An edge can be directed/undirected and weighted/unweighted. For example, Facebook friend-to-friend links are undirected but Twitter follower-following edges (i.e. person A follows person B) are directed. An edge can refer to many different kinds of relationships between nodes. For example, two users in a social media website may have one kind of edge between them because they are friends or have a different kind of edge because they are from the same geographical area.
2.1.1 Link inference
In many cases, links are explicit e.g., friendship links in social networks. Explicit links may not always represent the semantics we want. we might want to remove some edges, keep some or predict entirely new edges based on the problem. How-ever, in many scenarios, we have to infer the complete network structure from the data [27]. Common examples of these kinds of inferred networks are word and sen-tence networks in NLP [139] and machine translation, collaborative filtering networks in recommender systems [94] etc. Link inference or network inference is highly related to link prediction [127], but they are not the same. Link prediction usually refers to
predicting if there should be a link between two vertices when we already have an established network structure. However, link inference or network inference refers to creating the whole network from a set of free-floating nodes. However, in many cases, link prediction uses very similar methods as link inference (for example, using node metadata and similarity measures).
There are many different ways to infer a network [27]. Most of them share a common first step — calculating some kind of similarity between a pair of vertices. The similarity can be based on one attribute or many. An example of a single attribute similarity is the textual similarity between the posts of two social media users. As with many similarity metrics, there are many varied ways of computing text similarity [77] and the suitable metric varies from application to application. In other cases, multiple node attributes are combined together to predict similarity values. For hierarchical metadata, tree-based methods [21] are used for comparing keyword similarity. There are variants of link prediction algorithms which can be used to calculate similarity for link inference. For example, a variant of Adamic-Adar measure [1] (a common neighbor based link prediction algorithm) re-weights common attributes of two nodes based on the inverse log of the attribute’s frequency (similar to TF-IDF metric) to calculate similarity. Hashing-based methods [165] can also be used for quickly inferring networks from multiple time-sequecnces.
After we have the pairwise similarity values, we then have to choose which edges to keep. Two very common approaches are global thresholding (edges below a certain threshold are pruned) and k-nearest neighbor graphs [62] (each node is connected to its k-nearest neighbors based on similarity value). Both approaches have their advantages and disadvantages. K-nearest neighbor graphs are often disconnected into multiple components and by definition directed graphs. However, we can ignore directions or take only reciprocal links (i.e. if there is a link from vertexAto vertexB
and there is a link from B to A) to generate undirected graphs. Global thresholding can ensure a connected graph by using a suitable threshold, but in many cases, the threshold is low enough to create a hairball graph with too many edges which obfuscates community structure of the network. Another approach is finding the minimum spanning tree [106] for the network. This approach results in a tree which is not suitable for most network analysis algorithms including community detection. More sophisticated approaches like the backbone extraction algorithm [167] focus on preserving the distribution of weights seen in the original data. This ensures a connected graph which is also much sparser compared to global thresholding.
a network. However, if training data (i.e. some set of node metadata and a network originating from only those metadata) is available, we can train a machine learning model to infer networks. A related example is measuring social tie strengths in social media [75] using social behavior and communication patterns in Facebook. In this particular example, Gilbert et al. did not infer a network but instead measured the strength of friendship relations using user reported tie strength as training data, but similar methods can be used if training data is available.
2.1.2 Node aligned networks
We refer to graphs which share the same set of vertices or nodes as node-aligned graphs or networks. These networks represent different relationships among the same set of entities. These links can be explicit (friendship links and links denoting if two persons are from the same geographical area, nodes are social media users), inferred (author overlap and topical similarity between two discussion forums) or even based on the same metric at different timestamps (friendship over different periods of time, nodes are social media users). There are many ways compare the similarity between a pair of node-aligned networks. The simplest one is edge overlap [149] which calculated the number of common edges compared to the total number of edges. Papadimitriou et al. [149] used signature similarity for anomaly detection in web graphs. Signature similarity is a SimHash [87] based algorithm (a technique for quick estimation of similarity between two sets using hashing) which takes edge weights into account. Bunke et al. [30] proposed several methods to study changes in communication networks which can be applied to measure the similarity between node-aligned networks. However, the two best approaches among them, graph edit distance (calculates the edit distance between adjacency matrices of the graph) and
maximum common subgraph (find the largest common subgraph based on edges) are both NP-complete. Koutra et al. [105] proposed DeltaCon, which computes similarity matrices based on node affinity (computed using fast belief propagation [104]) and compute their similarity. We use community detection to understand different node clusters originated by different sets of edges in node-aligned networks.
Node-aligned networks are similar to multiplex and multilayer networks [101] as all of them connect the same set of nodes in different ways. However, node-aligned networks are not multilayer as each network has a different set od edges and different types of edges are not layered on top of each other in a single network.
2.2
Community detection algorithms
There are numerous community detection algorithms which are used in practice. Some of the widely used ones are described below. All of these algorithms work on undirected and weighted networks. As node-aligned networks are not multilayer networks, we do not discuss and use multilayer-specific community detection algo-rithms [18, 96, 186].
2.2.1 Fastgreedy
Fastgreedy is a hierarchical agglomerative algorithm by Newman et al. [42, 147] which follows a bottom-up approach. Fastgreedy, as its name suggests, greedily merges communities iteratively by maximizing modularity, a measure of ‘modular strength’ of a network. Modularity, Qis captured as:
Q= 21mP
vw[Avw− kvkw
2m ]δ(cv, cw)
Where v and wand two nodes, ki is the degree of node i, andci is the community label for node i, m is the total number of edges in the graph, A is the adjacency matrix representation of the graph (i.e. Avw > 0 if an edge exists between v and
w), and δ is the Kronecker delta — an indicator for testing if the communities are equal. The intuition for this function is that we are testing the number of edges within a community versus the number of edges expected with random assignment. Stated differently, a strong community contains more edges between its members than expected by chance.
Initially, each vertex is in its own separate community. Neighboring communities are merged iteratively, in the favor of maximum modularity increase, until modularity could not be increased further. This algorithm runs much faster than other usual community detection algorithms; hence it is useful for community detection in large graphs. However, it does not perform particularly well in many cases.
2.2.2 InfoMap
InfoMap [163], on the other hand, follows a very different approach and aims to provide the shortest description length of a random walker trajectory. The descrip-tion length is measured by the expected number of bits per vertex to encode the random walk path. This algorithm uses the minimum description length principle in information theory and follows the idea that a random walk within a community is
likely to stay within the same community as the number of intra-community edges is higher compared to the number of inter-community edges.
2.2.3 Label propagation
Label propagation [159] follows a straight-forward approach of assigning a vertex the most frequent label from its neighborhood. Initially, every vertex is assigned one of thek labels randomly and these labels are updated according to the most frequent label among the node’s neighbors. This method is repeated until no label is changed. The initial assignment of labels can significantly affect the outcome of this algorithm. Moreover, the number of different labels limits the number of communities. This method is very fast and suitable for very large graphs.
2.2.4 Multilevel
This is yet another greedy modularity maximization technique by Blondel et al. [136] which follows a hierarchical approach. First, the method finds ‘small’ com-munities based on greedy local optimization. Next, a new network is created where the communities found are treated as nodes. The same technique is applied over and over to achieve modularity maximization.
2.2.5 Spinglass
Spinglass [160] originates from statistical physics and is based on Potts model. In this approach, each vertex has an initial spin state from c specified spin states and edges dictate if two vertices would remain in the same spin state or not. This model is simulated a number of times and vertices having the same spin state are put into the same community. This method uses a predefined number of spin states c, so the total number of communities is bound by c. The initial choice of spin states may significantly affect the outcome of this algorithm. Compared to some other community detection methods, this algorithm is rather slow.
2.2.6 Walktrap
Walktrap [153] is a random-walk based community detection algorithm which follows the same idea as InfoMap that a random walk originated inside a community is likely to stay inside that community. Walktrap employs a short random walk usually consisting of three to four steps to build small communities. These communities are merged in a bottom-up fashion hierarchically to achieve the final partition.
2.3
Summary
In this chapter, we described network-related terminologies and existing research related to link inference and node-align networks. We talked about different types of link inference algorithms and their pros and cons. We defined node-aligned networks and created node-aligned networks via link inference. We also described different community detection algorithms that we make use of throughout this dissertation. We can use other network analysis techniques like centrality measures on the node-aligned networks as well.
CHAPTER III
Reddit: Data and Existing Work
3.1
Choice of the Reddit dataset
There are several social media, social networking websites and news/discussion forums where we can apply the expanded pipeline for network-based analysis. This includes popular social networks like Facebook and Twitter, and social aggregator and discussion forums like Reddit. We focus our studies on Reddit for several different reasons.
A major concern while choosing a suitable dataset is the availability of the data and what percentage of the data is available to us. Facebook data is generally not publicly available and Twitter only allows the use of a maximum of 10% of its feed data to select research organizations for academic purposes. On the other hand, Reddit has a comprehensive publicly available dataset compiled by Baumgartner [17]. This dataset contains various types of metadata (author, subreddit, upvotes, downvotes, time of posting etc.) for both Reddit posts and comments and spans over several years (January 2006 to June 2018 at the time of writing and new data is added periodically). Although this dataset does not have deleted or otherwise moderated posts and comments and miss some data [72], it is much more ‘complete’ compared to other similar social media datasets. This is one of the primary reasons for focusing our research on the Reddit dataset.
As we focus on community-to-community relationships, Reddit provides another unique opportunity over Facebook and Twitter as it operates as a combination of topic-specific user-groups dubbed subreddits. Each of these subreddits focuses on a specific topic or are based on some kind of social aggregation (e.g., image sharing, video sharing) or discussion. With the exception of default subreddits before 2017, subreddits are usually chosen by a particular user and a user can post, comment and subscribe to any number of public subreddits as long as he/she abides by the rules
specified by the subreddits (rules differ from subreddit to subreddit). Subreddits pro-vide an opportunity to study explicit user-defined communities and their interactions compared to inferred user communities in other social media (e.g., followers of a spe-cific Facebook page and Twitter hashtag communities). Another reason for choosing Reddit is its vast scale. For example, in 2016 alone, we have 9.75 million unique users who commented around 743 million times in different subreddits. Considering all comments from 2010 to 2017 we have 3.8 billion comments from 542.6k subreddits.
For different projects, we use different portions of the Reddit dataset due to its vast size. We describe some relevant statistics of the selected data in their respective chapters.
3.2
Related work
Previous work on Reddit is diverse but in large part has focused on a single subreddit or a small, manually-selected set of subreddits, often as case studies to analyze behavior in a specific context. For example, how the subredditnosleep dealt with a sudden increase in readership [100] and the subredditFindBostonBombers led a botched attempt to crowdsource finding the Boston Marathon Bombers [156]. Leavitt et al. used a very different news event — Hurricane Sandy, a natural disaster — to study how news content was produced and curated in real time [116], and to examine how Reddit’s user interface affected the production and curation process [117]. Studies have also examined the effects of Reddit’s interface design. For example, Gilbert found that social loafing damaged the site’s ability to highlight quality content [74]. Others have examined the role of bots [125], throwaway accounts [115] in Reddit’s design, and moderator disruptions in calls for policy change [34, 134].
Reddit is also a popular medium for analyzing language on a particular topic — e.g. smoking cessation [182] or mental health [13, 14, 54, 55, 99] — or studying specific types of user interaction, such as social feedback in weight loss communities [47], seeking support for sexual abuse [11], strategies for persuasive arguments [178, 185] or dogmatism in user comments [66]. Reddit data has also been used to train a model that identifies abusive comments [36] and understand users’ moral values using word choice [38].
Less research has focused on the structure of Reddit’s network itself [148]. Given the opaqueness of Reddit’s structure, which has little explicit structure beyond sub-reddits, researchers have attempted to classify subreddits using a variety of methods and metrics. Zhang et al. characterized user behavior within subreddits by
us-ing comment text to map subreddit topics onto four quadrants: generic-consistent, generic-dynamic, distinctive-consistent, and distinctive-dynamic [191]. Relevant to our study, Hamilton et al. characterized a small number of manually collected sub-reddits according to the loyalty of their users, finding differences in how much time end-users devote exclusively to a particular subreddit [81]. For example, they found that sports subreddits tended to have loyal users while default subreddits did not. While behaviors within subreddits have clear implications to inter-subreddit behavior, these studies did not extend to analyze linking.
Targeted studies have tried to identify the relationships between subreddits. Hes-sel et al. focused on highly related communities, identified according to their affixes (e.g. atheism and trueatheism, or food and foodhacks) [89]. These pairings often indicated a splintering, either as a result of conflict between users or to afford more specialized discussion. However, these instances only represent a small portion of the Reddit network. Reddit’s default subreddits and openness to cross-posting presents an additional challenge, as subreddit networks based on cross-posting are quite dense and require additional filtering. Olson and Neal [148] used author similarity to cre-ate a network, then used a backbone extraction algorithm [167] to prune the least important connections. Their analysis of a 2013 dataset found 59 communities with a small-world, scale-free network structure. This power-law distribution was partly attributed to Reddit’s UX design, in which new users are subscribed to default sub-reddits [148].
More recently, Martin [133] also made use of author similarity, in this case for applying topic modelling using an adapted latent semantic analysis. The method indirectly identified topic similarity, as well. For example, the author “subtracted”
politics from The Donald (a subreddit for Donald Trump supporters) to infer which topics The Donald’s authors contributed most when not talking about politics.
A related study to our own by Hessel et al. [88] combined multiple metrics, using a comparison of author and term similarity to identify obscured interests of users by identifying links according to high user similarity and low term similarity. Using this method, the authors identified several interesting examples, such as the relation-ship between LadiesofScience and FancyFollicles (about primarily multicolor hair) and craftit (a crafting subreddit). The authors based their analysis only on a lim-ited sample text post submissions (maximum 5000 posts per subreddit), rather than comments or submissions in other media formats (common in many of the popular subreddits). In our work, we extend the idea of finding high-author/low-text coherent subreddits by also identifying other misaligned variants.
3.2.1 Trolling in Reddit
We find that differences in user behavior in different Reddit communities has im-plications in identifying anti-social behavior in group level. we briefly discuss existing research about individual and communal anti-social behavior in Reddit.
Individual trolling in Reddit is predominantly studied through content analysis (e.g., [137]). A key result for Reddit has been comparing the differences between a smaller number of communities in terms of trolling behavior. For example, Schneider performed a contrastive study on intercultural variation of trolling by two subreddits,
ShitRedditSaysandMensRights[166]. Most related to our work is the study by Kumar et al. [109] which found that very few subreddits are responsible for the majority of conflicts. This has implications to the conflict graphs we construct in that we may expect key conflict ‘nodes.’
More recently, there has been some research on interventions (e.g., banning) on a case-by-case basis. For example, topic models of been used to study the evolution of (a now banned) subreddit DarkNetMarkets [154]. Chandrasekharan et al. [35] stud-ied the effect of banning two particular subreddits, fatpeoplehate and CoonTown, to combat hate-speech. The work concluded that the bans were likely effective in com-bating hate-speech. However, this work does not elaborate on subreddit-to-subreddit relations before or after the ban. Subreddit relations are discussed from an ideological frame by identifying subreddits which discuss the same topic from different points of view [53]. However, this approach does not capture conflict explicitly. We study the landscape of subreddit conflicts and banned subreddits as a whole instead of doing it on a case-by-case basis.
CHAPTER IV
Identifying Misaligned Inter-Group Links and
Communities in Reddit
4.1
Overview
Network modeling of online social systems is a common approach for the study of social behavior. Where explicit, the links between individuals measure friendship, shared interests, or other relationships (family, followers, fans, etc.). When the online system does not have features that explicitly support or encourage linking, we rely on inferred connections. For example, we may infer that two people are “linked” if they post on the same discussion forum or that two communities are linked if they are similar based on text. Inference issometimes necessary in the case ofperson-to-person
links andoften in the case ofcommunity-to-community links, where explicit links are rare. For example, subreddits (communities on Reddit) tend not to make explicit connections between each other. Yet, they are connected in many ways. Pairs of subreddits may share topics, share authors, share moderators, link to similar content in web, and so on. While indirect [184], similarities based on these features correlate with—and predict—connections. These connections reflect various social processes and can help model both the current state of the social system and the process by which the relationships emerged.
Choices about which similarity measure(s) and inference algorithm to use (not to mention the hyperparameters of the algorithm, such as normalization and threshold-ing) must be made carefully, as these choices will influence which links are predicted and how they are to be interpreted. The top of Figure 4.1 depicts a conventional anal-ysis pipeline: similarity measures are applied to a disconnected network to generate a pairwise similarity matrix, and then an inference algorithm determines which val-ues should be considered links and produces a network. On these inferred networks,
Nodes (e.g., Subreddits) Pairwise similarity (Term similarity) Pairwise similarity (Author similarity) Hyperparameters
...
...
...
...
Topic Similarity MatrixAuthor Similarity Matrix
...
...
Difference Matrix Matrix Comparison (e.g., T-A) Topic Network Author NetworkTopic Coherent Network
Author Coherent Network
Similar ity M atr ix t o Net w or k Communit y D et ec tion
Figure 4.1: Network inference pipeline. Topic and author networks refer to topic and author similarity networks respectively.
downstream analysis such as community detection can be performed (e.g., clustering subreddits into larger communities).
In many situations, different similarity measures are likely to be highly correlated. High author similarity between communities often means topic similarity will also be high. Conversely, low author similarity means we should expect topic similarity to be low, as well. When we see this agreement, it often signals a “good link.” Here we treat evidence as additive: if both text and authorship agree, the subreddits should be connected. Many inference algorithms rely on variants of this similarity comparison to infer connections. However, as we demonstrate in the context of Reddit, such correlation can be weak and the many edges that violate this expectation result from behavior and design and may lead to very different outputs.
We argue thatdisagreements between inferences are often as informative as agree-ments. We define a measure to compare inferred similarity matrices that identifies “misaligned” links (Figure 4.1, bottom). For example, two subreddits may share many authors but discuss entirely different topics; we call these types of links author-coherent links. When two subreddits have high text similarity but low author overlap, we call thesetopic-coherent links. To account for the influence of unequal and diverse levels in popularity of different subreddits we develop a score (double-z score, or z2
-score). This score can be used to create directed networks that capture “misaligned” links both locally (in the context of a specific subreddit) and globally.
Our measure of misalignment acts to operationalize, more generally, various struc-tures of interest for social media researchers. For example, social media researchers have targeted phenomena such as “communities at war” [2, 121, 122, 126], community fragmentation (i.e. multiple linked sub-communities instead of a single large commu-nity) [71, 89, 190], isolated or niche-interest community links [55], and “strongly linked” communities [89]. Many of these studies have required domain knowledge that is hard to generalize or automate, especially when using common link inference methods. That is, it is difficult to findmultiple community pairs/groups that have a certain structure (e.g., “communities at war”) or to score or rank these found struc-tures for further analysis. Reasons for this include: (1) a single inference algorithm (e.g., text or author) does not provide enough “signal” to capture these relation-ships, (2) algorithms that use multiple inferences (e.g., text and author) make naive assumptions about the agreement–or alignment–between the inferred networks, and (3) many algorithms suffer from the presence of a few highly popular communities which tend to be present in a majority of detected links and hide “unexpected” con-nections. Instead, we demonstrate that misalignment between inferred networks can be more generally measured and normalized, and that this measure can be used to find phenomena of interest.
Concretely, we are able to find repeated patterns in these misaligned links. For example, high topic coherence may unearth subreddits that are “at war” with each other (e.g., those with opposing political viewpoints) or have hierarchical relation-ships (e.g., a niche video game may have a separate community from a more generic gamer subreddit). We also find that subreddits with different ratios of incoming and outgoing links are often out of the mainstream or marginalized. By comparing net-works derived through standard similarity measures (e.g., author and text) to ourz2
-derived measure, we are able to characterize different types of subreddit-to-subreddit relationships.
Our contributions are twofold. First, we demonstrate a methodology for com-paring two inference workflows to identify misaligned links and communities. We introduce a score to compare networks derived from different similarity metrics that can be used to detect properties that are missed when considering only single infer-ence techniques, or those that are additive. Second, we apply these techniques to Reddit to identify subreddit-to-subreddit relationships. We identify key structures (i.e. topic-coherent, author-coherent, and satellite structures). Our analysis classifies how pairs of subreddits interact, how specific subreddits are situated in the broader context of the Reddit ecosystem, and proposes mechanisms by which networks and
higher level communities are formed.
We focus on differences between author overlap and textual similarities to under-stand community-to-community relations in Reddit and studied a set of node-aligned networks (author and topic similarity networks and author and topic-coherent net-works). A paper based on this chapter is published at [53].
4.2
Related work
In addition to work covered in Chapter III, we also identify related materials in the study of politics and social media. The idea of high topic coherence (high text, but low author, similarity) occurs implicitly in the study of political discourse in social networks. Though they discuss similar issues, authors rarely cross-post, leading to fragmentation. Adamic et al. [2] very clearly demonstrated the lack of cross-links between Democratic and Republican bloggers during the 2004 U.S. election. Within more recent social media contexts, Lotan [126] studied Facebook, Twitter and Instagram user networks discussing the topic of the strife at Gaza strip and showed fragmentation within the context of a specific topic. In Twitter, Liu et al. [121] found that users who often mention each other but don’t follow each other are “at war.” In our work, we demonstrate how warring sub-communities in Reddit can be detected.
Studies comparing text and network structure have also focused on political dis-course. For example, Livne et al. [124] studied interactions between political candi-dates on Twitter during the U.S. 2010 midterm election using both network structure and tweeted. The works notes differences in the strength of correlation between network similarity and language similarity depending on political party. However, the work did not discuss the interaction between the measures. Conver et al. [43] discussed the difference between the mention and retweet network while describing political polarization in Twitter.
4.3
Dataset
We selected Reddit (www.reddit.com) due to its popularity and structure. Reddit acts as both aggregator of a diversity of content and as a discussion board. We obtained 10.5 years of Reddit data (posts, authors, comments, etc.) ranging from January of 2006 to June of 20161. We focus our analysis on the month of June 2016,
1The dataset was compiled compiled by Baumgartner [17], available at files.pushshift.io/
the most recent month at the time of our retrieval. While we find 74,951 subreddits with at least one comment for this period, the distribution is long tail and 22.1% of these subreddits saw only one comment posted. We define a subreddit as “active” if it had more than 500 comments made by more than 100 unique authors in June 2016. Roughly, 500 comments corresponds to the 92.6 percentile in subreddit comment counts and 100 unique authors correspond to 90.45 percentile in subreddit unique author counts. We find 5,193 subreddits that met this criteria. Further filtering out subreddits with “over 18” flags (largely pornographic material), we were left with 4,924 subreddits. Overall, 62.3 million comments (122.7 million sentences) made by 10.6 million unique users were included in our analysis.
Even within this subset, subreddits’ activity levels approximate a long-tail distri-bution. The median number of comments per subreddit was 2083, and the median unique authors was 545. The most active subreddit,AskReddit, had about 4.6 million comments made by about 568k unique authors. In contrast, nashville — a subreddit well above the median level of commenting activity — had 8573 comments made by 1492 unique authors. This disparity is partly a consequence of Reddit’s design. New Reddit users are automatically subscribed to a changing set of “default” subreddits. In our June 2016 dataset, these 56 default subreddits (1.1%) all had more than 2 mil-lion subscribers each; no other subreddit had more than 1 milmil-lion subscribers. These 56 subreddits account for 23.6% of comments.
4.4
Method
The standard analysis pipeline for transforming disconnected entities into a net-work is illustrated in Figure 4.1. It involves using a similarity metric to create a pairwise similarity matrix. This matrix, often normalized and thresholded, is treated as an adjacency matrix from which a network is constructed. Further analysis, such as community detection, can then be executed on this network. We assume that multiple such pipelines can exist in parallel and that comparing both intermediate and downstream data structures (e.g., similarity matrices, networks, or communities) can lead to interesting findings.
4.4.1 Similarity Metrics
In our analysis, we selected two common similarity measures: text similarity of comments and author overlap.
Sour
ce Sub
-R
eddit
Destination Sub-Reddit
Author Similiarity (A) Term Similiarity (T)
-
=
Difference Matrix (D) Dij = rank(Aij)-rank(Tij) Dij z= (Dij-μ(Di))/std(Di) D ij = (Dij-μ(Dj ))/std(Dj ) zz z z z Ro w-wise z-scale Col-wise z-scale
z-scaled Difference Matrix (Dz z) Double z-scaled Difference Matrix (Dzz)
Figure 4.2: Computing the z2-score.
4.4.1.1 Textual similarity–Tsim
Text similarity was calculated by using the angle between term vectors describing each subreddit. Specifically, we applied the standard cosine similarity on a “bag-of-words” model that had been weighted through term frequency-inverse document frequency (TF-IDF) [140]. We applied standard NLP cleaning to all sentences in in a subreddit (stopword and punctuation removal, lowercasing, url removal) and phrase extraction. Sentences of two or fewer words remaining were ignored. Common multi-word tokens (phrases) were detected through a standard algorithm [140]. Specifically, one- to four-grams (all one- to four-word phrases) were extracted from 10% of the text, which we consider training data (roughly 12M sentences). Common “grams” (measured by the number of times the phrase appears relative to the individual terms) were retained. For each subreddit, the count of a particular term (tfi) was normalized by the maximum frequency for all terms in that subreddit. The IDF frequencies utilized the number of subreddits that contain that termdfi. For calculating document frequency we used all subreddits from June, not only the core 4,924, which removes bias and partially controls for larger values from larger subreddits. The final feature vector for each subreddit contains the TF-IDF score for each term (a term is a single word or a multi-word phrase detected by our phrase detection algorithm) that appears in the corresponding subreddit.
There are many algorithms other than TF-IDF that can be used for measuring textual similarity between two subreddits. These algorithms include word embed-ding [141] and topic modelling [23, 174]. We opted for a simpler text similarity measure, TF-IDF, as both word embedding and topic modelling approaches are dif-ficult to tune, and are significantly more costly in terms of space and time. This is a concern as our dataset contains 122.7 million sentences. TF-IDF is still a very good measure for measuring text similarity and widely used in information retrieval research.
4.4.1.2 Author similarity–Asim
To calculate author similarity, we similarly calculated the cosine distance to the weighted (TF-IDF) “bag-of-authors.” For each subreddit, author frequency (TF) was calculated as the number of times an author posted in the subreddit, normalized by the maximum number of posts made by a single author in that subreddit. Author IDF was determined by the number of subreddits the corresponding author posted on. As with text, for IDF calculation we considered all subreddits that were active in June. Deleted authors were removed.
4.4.2 Matrix Generation
Using the two similarity functions described above, we calculated the pairwise similarity of the 4,924 subreddits to generate two symmetric similarity matrices —A
andT— for author and text similarity, respectively. A cell,Aij (or Tij) contained the result of the similarity calculation for subreddits i and j.
4.4.3 Pairwise relationships between subreddits
Once they are constructed, we are able to compare A and T (for example, using Spearman’s rank correlation to calculate the correlation between the matrices). The author matrix is sparse, as many subreddits do not share any authors; in contrast, the term matrix contains no 0’s as there is invariably some textual overlap. The next steps account for this difference betweenA and T.
4.4.3.1 Matrix agreement
To compare the likely links, or “edges,” that will be formed from the matrices we set thresholds Athresh and Tthresh as filters on the corresponding matrix. If the cell value is above the threshold, the cell was set to 1 (an edge exists); otherwise it is 0. Because the author matrix was already sparse, we setAthresh to 0 so all non-zero cells were retained as edges. For the term matrix, Tthresh can be varied; we consider this a tunable hyper-parameter of the analysis pipeline. Once we transformed the matrices into binary form, we simply determined the agreement between them as a measure of similarity.
4.4.3.2 Binned comparison
As we have two scores for each subreddit pair, a natural analysis would map each pair onto a standard (though likely binned)x-yplot. One could then easily find pairs matching specific constraints; for example, one could find all subreddits pairs with a 90th percentile score for text and less than the 10th for author similarity. Pairs in this set would roughly correspond to topic-coherent pairs (high term but low author similarity).
This approach has a number of problems, however. First among them is that certain subreddits may dominate the pairings in a particular quadrant. For example, a default subreddit will likely have many coherent links, as they have author-ship overlap with nearly all other subreddits even when they are topically unrelated. Second, we would ideally like a single score to identify misaligned subreddit connec-tions. Neither the rank differences between similarities nor raw difference produce a satisfactory answer.
4.4.3.3 Double z-score (z2)
To create our misalignment metric, the z2-score, we went through a four-step
process of calculating and standardizing the differences between the author and term similarity matrices.
To generate a single score comparing the similarity matrix, we might expect to be able to simply calculate a new matrix D where each cell Dij = norm(Aij −Tij), meaning each cell in the difference matrix would correspond to the difference in the values for that cell in the original similarity matrices. However, because the data distributions for author and term similarity are very different, we chose to calculate the difference matrix using rank differences instead of simply subtracting the raw similarity scores.
Thus, the first step was to create ranked similarity matrices, where the raw simi-larity scores for a given source subreddit and each of the 4,923 remaining destination subreddits are ranked against each other. In the original matrices, rows and columns were equivalent, as the raw similarity scores are symmetric. In these new ranked similarity matrices, this is no longer true: for any particular subreddit pair, it is very unlikely that the similarity relationship will be symmetric. For example, a small sub-reddit is likely to have high author overlap with a large, popular subsub-reddit, simply because of its size; however, this overlap accounts for only a small proportion of the large subreddit’s authorship, so the link returning from the large subreddit to the
small one is likely to be ranked much lower.
The second step was to create a single rank-difference matrix D by subtracting the two rank-similarity matrices (the center matrix in Figure 4.2). In this asym-metric matrix, the rows represent the source subreddits; the columns represent the destination subreddits.
Because of the subreddits’ diversity, the distributions of rank differences in each row are very different. Therefore, in the third step, we standardize the scores in each row by calculating the z-score (represented by the fourth matrix in Figure 4.2). Represented as an equation: Dij = norm(rank(Aij)−rank(Tij)). Recall that the z-score (or standard score) Kz for a set of values K is calculated by subtracting the mean of K, µK, from each value ki in K and dividing by the standard deviation of
K, stdK. Thus, Kiz = (Ki−µK)/stdK. The z-score normalized values will be mean-centered on 0 and will capture the number of standard deviations the value is from the mean. In the matrix context, mean and standard deviation can be calculated per row or per column. Therefore, to calculate the single z-score transformed matrix, Dz, we determined the mean and standard deviation of each row Di of the difference matrix
D. Specifically, for any cell Dzij we computed (Dij −µ(Di))/std(Di). The values in this matrix tell us the difference between author and term ranks for the source and destination subreddit, standardized by the distribution of source similarities.
This has not yet solved the problem of some subreddits simply being similar to all others, however. As described earlier, very large subreddits have this problem because of their size, but it can be caused by other subreddit quirks as well. CatsStandin-gUp, a popular image subreddit, is one example. When comparing its single z-score distribution to that of a second subreddit — say, pokemongo— CatsStandingUp has high positive z-score inDz (see Figure 4.3). This is misleading, partly because
Cats-StandingUp has high author similarity with many subreddits, but also because it has unusually low text similarity with most other subreddits: the only word allowed in the comments is the word “cat.” Commenting rules such as these can artificially inflate or deflate single z-scores.
To address this, we take our fourth and final step: taking the z-score again, this time column-wise. This produces Dzz: the double z-score (z2-score)
differ-ence matrix (the rightmost matrix in Figure 4.2). For any cell Dzz
ij we compute (Dz
ij −µ(Dzj))/std(Djz). Subreddits which have high positive z2-score have high au-thor coherence: higher auau-thor similarity than would be expected, given the term similarity. A high negative z2-score indicates high topic coherence: higher term sim-ilarity than would be expected, given the author simsim-ilarity. Where term and author
Figure


Outline
Related documents
It is the (education that will empower biology graduates for the application of biology knowledge and skills acquired in solving the problem of unemployment for oneself and others
Made in the U.S.A. and constructed entirely of 18-9 mirror polished marine grade stainless steel to withstand even the harshest of environments. The primary and secondary
Time from subcutaneous injection of 10 U of insulin lispro and insulin aspart from fasting levels to 50% of the peak free insulin concentration, peak concentration, and 50%
4) improving legislation to encourage insur- ance company activity. Legislative definitions of different insurance types, and a division between obligatory and
Regarding the evolution of supply chains, hospitals lag significantly behind other industries in deploying advanced management systems to drive supply chain optimization..
The authors examined successful course completion, or the percentage of students passing courses with a grade of C or better and withdrawal rates for native students enrolled
Monthly donors help PVI sustain our programs, year in and year out, so that seniors in the community have access to vital services without interruption. It is also a great way
Description: 'Global Telemedicine Market (Specialty, Cardiology, Dermatology, Neurology, Orthopedics, Emergency Care, Internal Medicine, Gynecology, and Others) and
