1
Forecasting methods in energy planning
models
Abstract
Energy planning models (EPMs) play an indispensable role in policy formulation and energy sector development. The forecasting of energy demand and supply is at the heart of an EPM. Different forecasting methods, from statistical to machine learning have been applied in the past. The selection of a forecasting method is mostly based on data availability and the objectives of the tool and planning exercise. We present a systematic and critical review of forecasting methods used in 483 EPMs. The methods were analyzed for forecasting accuracy; applicability for temporal and spatial predictions; and relevance to planning and policy objectives. Fifty different forecasting methods have been identified. Artificial neural network (ANN) is the most widely used method, which is applied in 40% of the reviewed EPMs. The other popular
methods, in descending order, are: support vector machine (SVM), autoregressive integrated moving average (ARIMA), fuzzy logic (FL), linear regression (LR), genetic algorithm (GA), particle swarm optimization (PSO), grey prediction (GM) and autoregressive moving average (ARMA). In terms of accuracy, computational intelligence (CI) methods demonstrate better performance than that of the statistical ones, in particular for parameters with greater variability in the source data. However, hybrid methods yield better accuracy than that of the stand-alone ones. Statistical methods are useful for only short and medium range, while CI methods are preferable for all temporal forecasting ranges (short, medium and long). Based on objective, most EPMs focused on energy demand and load forecasting. In terms geographical coverage, the highest number of EPMs were developed on China. However, collectively, more models were established for the developed countries than the developing ones. Findings would benefit researchers and professionals in gaining an appreciation of the forecasting methods, and enable them to select appropriate method(s) to meet their needs.
Keyword: Forecasting; Prediction; Energy demand; Load forecasting; Energy planning models Highlights:
ANN is the most popular; outperforms statistical methods in forecasting energy demand
Hybrid methods perform better than stand-alone ones in most cases
Statistical methods are suitable for short term and computational intelligence methods are suitable for all temporal forecasting
2
Energy demand and load forecasting were the main objectives of forecasting models
1
Introduction
Increasing greenhouse gases (GHGs) emission contribute to global warming, resulting in
amplified global temperature and associated vulnerabilities [1]. Mitigating the impacts of climate change requires the reduction or at the very least the stabilization of atmospheric CO2
concentrations, which can be achieved by decreasing global carbon outflow from energy and land-use sectors, the two major GHG sources.Emissions from land-use have been nearly constant, while the emissions from fossil fuel based energy system climbed up by 29% between 2000 and 2008 [2]. If current GHG concentrations remain constant, the world would experience a few centuries of rising mean temperatures and sea levels [3-5]. Studies suggest that the current energy and transportation systems are likely to be responsible for significant CO2 discharges over the next fifty years [6], which can increase the global mean temperature by approximately 1.1 to 1.4˚C between 2010 and 2060 [7]. Future initiatives on energy planning and development should, therefore, focus on decarbonizing the energy generation and demand sectors. Research indicates that CO2 emissions are negatively associated with national expenditure on energy research; therefore, the transition away from carbon intensive energy generation for atmospheric CO2 stabilization will require significant investments in innovative energy research and development [8].
EPMs are essential for assisting stakeholders in making informed decisions for future energy sector development – globally, regionally and nationally. The development of EPMs started in the 1960’s [9], but the interest in them increased after the oil crisis in the 1970’s that highlighted the effects of dependency on conventional fuel sources on global, regional and national
economies, in particular the role of exogenous political events on the oil market [10]. The crisis acted as a catalyst for the critical assessment of fuel resources, rational use and conservation of energy resources, and long-term energy planning for global, regional, national and sectoral utilization [11]. In addition, the Rio Earth Summit in 1992 and the report of the
Intergovernmental Panel on Climate Change (IPCC) in 1995 triggered further environmental studies on GHG emissions [12], while cautiously concluding that CO2 emissions had a noticeable impact on the environment [13]. Intensive discussions and debates followed,
legislations were formulated and GHG emission reduction targets were set; e.g. Kyoto Protocol in 1998. Although separate models for the evaluation, projection and alleviation of
environmental impacts were created, EPMs played a critical role in identifying system boundaries and underlying relationships between the socio-technical parameters of energy, economy and environment.
3
Different authors reviewed EPMs in previous years. Nguyen (2005) classified EPMs into six categories – energy information systems, macroeconomic, energy demand, energy supply, modular package and integrated models [9]. Pfenninger et al. categorized EPMs into four types – energy system optimization; energy system simulation; power system and electricity market and qualitative and mixed-method scenarios [14]. Most of the reviews focused on classifying the energy planning models as a whole, rather than investigating and categorizing the underlying forecasting methods. Suganthi investigated the models for forecasting energy demand [15], albeit only partially. Moreover, parameters for categorizing forecasting methods are not same as for EPMs. The choice of forecasting method can affect the accuracy and validity of results in an EPM.
Previous treatments of EPM forecasting methods either divide the topic into its areas of application or into the broad categories of underlying techniques. Application areas are always evolving – through the integration of new domains and concepts, as well as by expanding the breadth and depth of a modelled domain. The difficulty arises when previously categorized application areas are not flexible enough to accommodate a new area. For example, behavioral energy conservation is an important environmental psychology aspect of climate and energy debate; and widely considered for the modelling of energy use in buildings and transportation, as well as for national energy demand forecasting and policy making.1 On the other hand, dividing forecasting methods based on the underlying techniques has similar issues. For example, Weron classified forecasting methods into two broad categories – statistical approaches and artificial intelligence (AI) based techniques [16]. The developments in computing over the past decades have enabled the use of compute-intensive methods for improved accuracy and reduced computation time, thereby enhancing their applicability. AI techniques are now widely used to tune up parameters in statistical models. Moreover, a number of soft computing or
computational intelligence2 techniques routinely use advanced statistical concepts. Therefore, categorizing the forecasting methods as either statistical or artificial intelligence not only gives an inaccurate account but also hinders the informed comprehension of the strengths and weaknesses of different approaches. The hybridization of methods to suit application areas is characterized
1 Examples of the use of behavioral aspects of public energy conservation in policy making can be found in
Japan’s Third National Communication under the United Nations Framework Convention on Climate Change (UNFCC) (http://unfccc.int/resource/docs/natc/japnc3.pdf) and Energy Outlook of Vietnam through 2025 (http://open_jicareport.jica.go.jp/pdf/11899796_02.pdf)
2 It can be argued that the so called AI methods used in forecasting are in fact, more specifically, computational
intelligence (CI) techniques, also known as soft computing in AI. For further information on how computational intelligence branched out from general AI, initially to distinguish neural networks from hard AI but later to incorporate fuzzy systems and evolutionary computation, the reader is referred to the history of IEEE Computational Intelligence Society (CIS) at
4
by data incompleteness and uncertainty; temporal and spatial variability; and domain features – all of which mandates a new classification scheme.
Existing reviews thus lack a comprehensive coverage in terms of scope, accuracy and applicability. The objective of this review is, therefore, to analyze the methods utilized in different EPMs to investigate their accuracy, objective, temporal and spatial extents with a view to identify the factors behind the choice of forecasting methods. Findings of this study would benefit researchers in gaining an appreciation of the methods, as well as enable them to select appropriate forecasting methods for future research.
2
Methodology
A systematic state-of-the-art review was undertaken on published electronic and non-electronic resources for the study of underlying forecasting methods in EPMs. A preliminary study was conducted to gather an overview of the topics related to forecasting methods in energy planning. The identified main topics were: energy demand and/or supply model and/or forecasting; energy planning models; emission reduction models; time series analysis; and forecasting. These topics were used to identify relevant keywords, listed in Table 1. Keywords were then utilized to search electronic databases: Google Scholar, ScienceDirect, Scopus, Ei Compendex and Web of Science, for relevant publications on forecasting methods of EPMs.
<Insert Table 1 about here>
An advanced search was conducted within the databases by categorizing keywords into four word groups and by combining them using the Boolean operator ‘AND’. The search was conducted in two stages. Firstly, the model, objective and geographical extent keywords were used. Secondly, the model, objectives, methods and analysis measures were applied. The initial search results at each stage were refined by applying the following inclusion criteria:
Objective: Energy forecasting
Language: English
Sources: Publications from journals related to energy and core forecasting and planning of energy; fossil fuel; renewable energy; carbon emission etc.
Abstracts of the selected publications were scrutinized. Articles were chosen for review if the substance was within the scope of the study. A further search was conducted on the recognized authors who had contributed noticeably in related fields. 600 publications were found from the search. The criteria for retention were:
5
Studies with significant contribution in assessing the cost of reducing carbon emissions
Studies on forecasting methods for energy planning
Key review articles from established authors/institutions in the area of energy forecasting and planning models
Finally, 483 publications and reviews on energy forecasting and planning were retained for analysis and interpretation.
3
Classification
Forecasting involves the predictions of the future based on the analysis of trends of present and past data, comprising three major components: input variables (past and present data),
forecasting/estimation methods (analysis of trends) and output variables (future predictions), as shown in Figure 1. Based on the number of techniques used for trend analysis, the investigated methods can be broadly classified into two main types: stand-alone and hybrid. Standalone methods apply a single technique for analyzing trends whereas hybrid methods integrate more than one standalone techniques. In most cases, the purpose of hybridization is to rationalize or make reliable forecast output and to yield higher projection accuracy.
<Insert Figure 1 about here>
Based on the type of techniques, stand-alone methods are divided into three categories: statistical, computational intelligence (CI) and mathematical programming (MP). Hybrid methods are divided into four: statistical-statistical, statistical-CI, CI-CI and statistical-MP methods. Some of the reviewed literature utilized multiple standalone and/or hybrid methods for comparison and critique. To obtain a comprehensive picture in this paper, underlying techniques in hybrid methods are also separately accounted for in the stand-alone method categories in Table 2 and Table 3.
The methods are also analyzed on the basis of geographical extent and forecasting time frame. Geographical extent was divided into 3 categories: global, regional and country. Global refers to the whole world; regional for a part of the world; e.g., Asia, Europe, G-8, and Sub-Saharan Africa; and country for an individual country. Models with geographical extent covering parts of a country are incorporated in the country category for brevity.
The time frame of the forecasted models ranges from hours to 100 years. Grubb [17] suggested a period of 5 years or less for the short-term, between 3 and 15 years for the medium-term, and 10 years or more for the long-term. However, this classification creates confusion for the medium- and long-term projections because of the overlapping time spans. This research, therefore,
6
utilizes the following definitions for time span or modelling horizons: short- (𝑡 < 3), medium-
(3 ≤ 𝑡 ≤ 15) and long-term (𝑡 > 15), where 𝑡 is time span in years.
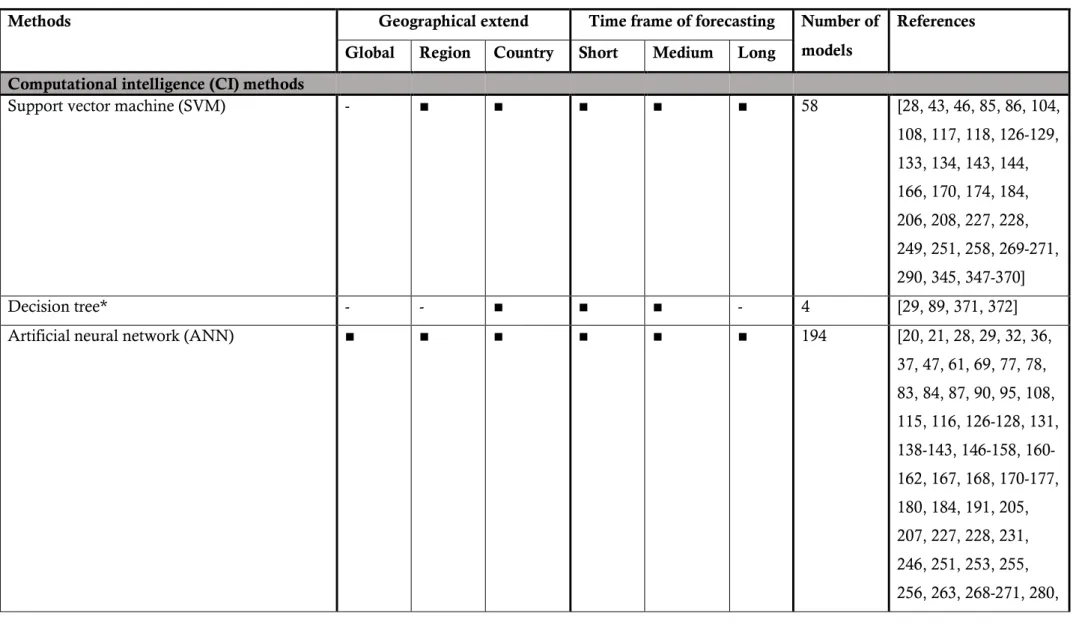
The statistical and CI & MP based classification is presented in Table 2 and Table 3 respectively, illustrating the techniques used, geographical extent and forecasting time frame, as well as the number of studies and references.
It is evident from the analysis of 483 studies that diversity in statistical methods are more prominent than computational intelligence and mathematical programming. 28 different statistical methods have been used, compared to 22 CI and one MP for forecasting. Among the statistical methods in Table 2, autoregressive integrated moving average (ARIMA) (46 models) followed by linear regression (LR) (39 models), autoregressive moving average (ARMA) (22 models) and logistic regression (LoR) (19 models). Cointegration was widely used (48 models) technique to analyze the relations among the variables. ARIMA, LR and other statistical methods were utilized to forecast.
<Insert Table 2 about here>
With regard to CI techniques, ANN was used in 194 models, followed by SVM (58 models), FL (40 models), GA (39 models), PSO (34 models) and GM (29 models) (Table 3). In respect to geographical extent, global and regional models mostly adopt statistical methods. However, country based models utilized wide range of methods (statistical and CI) for forecasting (Table 2 and Table 3).
Forecasting models, which adopted metaheuristic methods to develop hybrid method, utilized genetic algorithm and particle swarm optimization most of the time. Also, global models utilized metaheuristic methods such as GA, PSO and Artificial bee colony optimization (ABCO).
Moreover, country wise forecasting models utilized a wide range of methods both metaheuristic and MP.
In case of temporal span, statistical methods are suitable for short term (Table 2) and CI methods are suitable for all temporal (Short, medium and long) forecasting (Table 3).
<Insert Table 3Table 2 about here>
4
Stand-alone methods
Most of the analyzed models adopted stand-alone methods, which can be divided into three categories- statistical, computational intelligence (CI) and mathematical programming (MP) methods.
7
Statistics methods investigates the accumulation, examination, elucidation, presentation, and association of data [18] and can be divided into several categories from the analyzed models. For example:
4.1.1
Regression analysis
There are different regression methods for forecasting. Among, the regression methods six methods were utilized in the studied models. The methods were: Linear regression (LR), ordinary least squares (OLS), nonlinear regression (NLR), logistic regression (LoR),
nonparametric regression (NR), partial least squares regression (PLSR) and stepwise regression (SR).
Thirty-four reviewed models utilized linear regression (LR) method. LR is applied to model the relationship between two variables by fitting a linear equation to observed data [19]. Among the reviewed models which utilized LR, 89.7% models forecasted energy and electricity demand. Three forecasting models utilized non-linear regression (NLR). Bilgili et al. forecasted the electricity consumptions of Turkey with NLR [20]. Ghiassi et al. proposed a dynamic artificial neural network (DAN2) model for forecasting nonlinear processes and compared to NLR, the method was effective for forecasting nonlinear processes [21]. Tsekouras et al. developed a nonlinear multivariable regression to midterm energy forecasting of power systems of Greece [22]. Logistic or logit regression (LoR)was applied in 19 reviewed models, of which 68.4% models forecasted energy and electricity demand.
Three models utilized nonparametric regression (NR) method. NR establishes model according to information derived from the data from larger sample sizes. Charytoniuk et al. developed a short-time load forecasting model by applying NR [23]. Another study applied NR model to short-term wind power forecasting [24]. Jónsson et al. presented an analysis of how day-ahead electricity spot prices are affected by day-ahead wind power forecasts. The author utilized NR to assess the wind power forecast [25].
Partial least squares regression (PLSR) was applied in two forecasting models. Zhang et al. forecasted China’s transport energy demand for 2010, 2015 and 2020 with PLSR method. The results demonstrated transport energy demand for 2020 will reach to a level of around 433.13 million tons of coal equivalent (Mtce) and 468.26 Mtce, respectively [26]. Meng et al. analyzed and forecasted China’s annual electricity consumption with PLSR. It showed real estate and relative industry electricity consumption was affected by unusual development [27].
Seven models forecasted with stepwise regression (SR) method. Ekonomou utilized SR to estimate energy consumption of Greece for 2005–2015 to compared with the results produced by LR and ANN method [28].Tso et al. utilized SR method to predict electricity consumption in
8
Hong Kong [29]. Rao et al. utilized SR to select the relevant cross-products to be used in a non-homothetic Translog function to forecast and analysis of demand for petroleum products in India [30]. Aranda et al. utilized SR to select the correct model form to predict the annual energy consumption in the Spanish banking sector [31].
4.1.2
Univariate time series methods
Among the studied models, five univariate time series methods were utilized. The methods were: moving average (MA), autoregressive integrated moving average (ARIMA), seasonal
autoregressive integrated moving average (SARIMA), autoregressive moving average model with exogenous inputs (ARMAX) and autoregressive moving average (ARMA).
Four forecasting models utilized moving average (MA). Azadeh et al. forecasted electricity consumption in Iran with moving average (MA) to make the data trend free to train the ANN. Also forecasted electricity consumption to compare the predicted results [32]. Xu et al. combined two statistical methods to model to forecast natural gas consumption in China from 2009 to 2015. One of the method was MA [33]. In another study, Zhu et al. developed an improved hybrid model (MA-C-WH) to forecast electricity demand in China, which utilized MA [34]. Li et al. applied single and double MA for forecasting power output of a grid connected photovoltaic system [35].
The general form of Autoregressive integrated moving average (ARIMA) is ARIMA (p,d,q) where p is the order of the auto-regressive part, d is the order of the differencing, and q is the order of the moving average process. Some ARIMA has seasonal and non-seasonal part and denoted as ARIMA (p,d,q) (P,D,Q)s where P, D, Q is the seasonal part of the model, S the number of periods per season. Among the analyzed models, ARIMA was applied in 46 models (Table 2 and Table 4). Among the ARIMA models, 46% forecasted energy and electricity
demand.
<Insert Table 4 about here>
Seasonal autoregressive integrated moving average (SARIMA) was applied in 13 projection models (Table 2). Zhu et al. developed MA-C-WH model to forecast electricity demand in China and utilized the results from a SARIMA model to compare the accuracy of the proposed model [34]. Cadenas et al. forecasted wind speed with integrated ARIMA and ANN to compare with the results from SARIMA for Oaxaca, Mexico [36]. Jeong et al. applied SARIMA for
determining the annual energy cost budget in educational facilities. In this study, models for elementary, middle, and high schools SARIMA (13, 1, 0) (0, 1, 0), SARIMA (6, 1, 1) (0, 1, 0), and SARIMA (6, 1, 1)(0, 1, 0) respectively were developed [37]. Ediger et al. applied SARIMA methods to forecast primary energy demand of Turkey from 2005 to 2020 [38]. Monthly energy
9
forecasting model for Thailand was developed with SARIMA (l, 0,1)(0,1,0)12 [39]. Ediger et al. applied SARIMA to forecast production of fossil fuel sources in Turkey [40]. Forecasting electricity demand with SARIMA (0,1,1)(1,1,1) by Sumer et al. in [41]. Bouzerdoum et al. applied SARIMA for short-term power forecasting of a small-scale grid-connected photovoltaic plant [42]. Guo et al. applied SARIMA for forecasting wind speed in Hexi Corridor of China [43]. Wang et al. developed electricity demand forecasting with SARIMA method for China [44]. Boata et al. developed hourly solar irradiation forecasting model with SARIMA (1,0,1)(1,0,1)24 [45]. Wang et al. applied SARIMA to forecast electric load in [46].
Autoregressive moving average model with exogenous inputs (ARMAX) was utilized in 10 forecasting models (Table 2). Darbellay et al. applied ARMAX to forecast Czech electricity demand [47]. Li et al. developed forecasting model for power output of a grid connected photovoltaic system with ARMAX [35]. González et al. applied SARMAX for forecasting power prices [48]. Bakhat et al. applied ARMAX for estimation of tourism-induced electricity consumption in Balearics Islands, Spain [49]. For short-term load forecasting Wang et al. utilized ARMAX based on evolutionary algorithm and particle swarm optimization [50]. Lira et al. utilized ARMAX for short-term electricity prices forecasting of Colombia [51]. Hickey et al. developed four ARMAX–GARCH models for forecasting hourly electricity prices [52]. Autoregressive moving average (ARMA) is a statistical method consist of two polynomials- autoregressive (AR) and moving average (MA). Among the reviewed models, 22 utilized ARMA (Table 2), of which 32% and 27% were utilized for energy & electricity demand and load
forecasting respectively.
4.1.3
Multivariate time series methods
Vector autoregression (VAR) was applied in 13 reviewed models (Table 2). Among these 13 models, 77% models forecasted energy and electricity demand. Bayesian vector autoregression (BVAR) was applied in four reviewed models (Table 2). Chandramowli et al. forecasted New Jersey’s electricity demand with BVAR [53]. To forecast energy consumption in China from 2004–2010, Crompton et al. applied BVAR and concluded energy demand would rise at an annual average rate of 3.8% [54]. Energy consumption and projected growth was modelled with BVAR for selected Caribbean countries in [55]. Bayesian hierarchical model was developed for one-hour-ahead wind Speed Prediction in [56]. Multivariate VARIMA (0,1,1) model was applied to model and forecast fossil fuels, CO2 and electricity prices and their volatilities. VARIMA approach gives better results in the case of electricity prices. However, the time span of forecasting tends to be short [57].
Structural Time Series Model (STSM) was utilized by Dilaver et al. to predicted that Turkish industrial electricity demand will be somewhere between 97 and 148 TWh by 2020 industrial
10
electricity demand [58]. In another study, Dilaver et al. predicted Turkish aggregate electricity demand will be somewhere between 259 TWh and 368 TWh in 2020 by utilizing STSM [59].
4.1.4
Autoregressive conditional heteroscedasticity (ARCH) methods
Generalized autoregressive conditional heteroskedasticity (GARCH) was applied in fourteen models. GARCH can be both univariate and multivariate [60].
Seasonal generalized autoregressive conditional heteroscedasticity (SEGARCH) and Winters model with exponential form of generalized autoregressive conditional heteroscedasticity (WARCH) was applied to forecast energy consumption in Taiwan by developing hybrid nonlinear models with ANN [61]. Exponential generalized autoregressive conditional
heteroscedasticity (EGARCH) method was utilized by Bowden et al. for short term forecasting of electricity prices [62].
4.1.5
Others
Six analyzed model utilized autoregressive distributed lag (ARDL) (Table 2). Dilaver et al. forecasted industrial electricity demand [58] and aggregate electricity demand [59] in Turkey with ARDL. In another study, Dilaver et al. predicted Turkish aggregate electricity demand will be somewhere between 259 TWh and 368 TWh in 2020 by utilizing ARDL. Adom et al. utilized ARDL to forecast electricity demand in Ghana to be within 20,453 and 34,867 GWh by the year 2020 for analyzed three scenarios [63]. Kim et al. forecasted energy demand of South Korea for 2000-2005 after reviewing the 1990s [64]. Zachariadis T. forecasted electricity consumption in Cyprus with ARDL [65]. Vita et al. developed ARDL bounds testing approach to estimate the long-run elasticities of the Namibian energy demand [66].
Among the reviewed models, four models applied Log linear analysis (LA) (Table 2). Parikh et al. used the LA to project the demand of petroleum projects and natural gas in India. The study projected the demand of petroleum products to be 147 and 162MT in the business as usual scenario (BAU) of 6% and optimistic scenario (OS) of 8% GDP growth, respectively for 2011– 2012 [67]. In another study, Pilli-Sihvola utilized log-linear econometric model to project and examines the impact of gradually warming climate on the need for heating and cooling in five European countries form 2008-2050 [68]. Limanond et al. project transport energy consumption in Thailand from 2010 to 2030 with LR [69]. Wadud et al. projected natural gas demand in Bangladesh from 2009-2025 with log-linear Cobb–Douglas method [70].
Geometric progression (GP) was utilized in three studied models (Table 2). Mackay et al.
forecasted crude oil and natural gas supplies and demands from 1995 to 2010 for France [71] and Denmark [72] by utilizing geometric progression method. In a separate study, Mackay et al. forecasted fluid fossil fuel supplies and demands for UK with geometric progression method [73].
11
Transcendental logarithmic (Translog) was applied in two forecasting models (Table 2). Rao et al. developed a translog model on a non-homothetic translog function to forecast and analyze the demand for petroleum products in India [30]. Furtado et al. forecasted petroleum consumption in Brazil up to 2000 with translog model along with logistic and learning model. The study demonstrated that translog model performed better than logistic and learning model [74]. Polynomial curve model (PCM) is one of the trend extrapolation methods best modelled with polynomial equations. Xu et al. combined two statistical methods to forecast natural gas consumption in China from 2009 to 2015; one of the methods was PCM [33].
Four reviewed models utilized partial adjustment model (PAM) for forecasting (Table 2). Nasr et al. utilized PAM to develop econometric model to estimate electricity consumption of post war Lebanon [75]. Adom et al. identified the factors that affect aggregate electricity demand in Ghana and forecasted electrical consumption from 2012 to 2020 with PAM and ARDL [63]. To analyze demand for natural gas in Kuwait, PAM was utilized in [76].
Seven models utilized analysis of variance (ANOVA)(Table 2). ANOVA was applied to
compare the selected ANN, regression and actual data of forecasting electricity consumption [32, 77]. ANOVA F-test was applied for ANN, simulated-based ANN, time series and actual test data for forecasting electrical energy consumption in Iran [78].
Cointegration implies restrictions on multivariate time series and is widely believed that it can produce better long horizon forecasting [79]. Unit root test and/or Cointegrationwas utilized in 48 models (Table 2). The major objective behind applying cointegration method was to find the relations among the variables of a model. Nasr et al. utilized cointegration method to develop econometric model to estimate electricity consumption of post war Lebanon [75].
Decompositionwas utilized in 16 analyzed models (Table 2).
4.2
Computational intelligence (CI) methods
There were 22 methods utilized in the analyzed models. The real life problems have nonlinear characteristics while forecasting, especially for energy planning. Computational methods were useful for prediction problems where numerical formulae and prior data on the relationship between inputs and outputs are unknown [80]. The applied CI methods can be divided into four categories.
4.2.1
Machine learning methods
Artificial Neural Network (ANN) was highly utilized method for varied objectives. Inspired by the human brain, ANN can learn and generalize from samples and analyses unpretentious useful connections among the information regardless of the possibility that the fundamental
12
connections are obscure or difficult to portray [81]. A schematic diagram of a feed-forward neural network architecture is shown in Figure 2. ANN has three layers: input, hidden and output. In Figure 2, only one hidden layers are shown and the number can be more than that depending on the complexity of the analyzed problem. Each neuron is connected to every other neuron of the previous layer through adaptable synaptic weight. A training process is carried out to train ANN by modifying the connection weights and weights are adjusted to produce the desired outputs as shown in Figure 3. Description of basic ANN method can be found in [82]. <Insert Figure 2 about here>
<Insert Figure 3 about here>
Among the reviewed models, 194 models applied ANN or different form of NN. The detail analysis of ANN can be found inError! Reference source not found. Table 5, which is demonstrating layer number, neuron number in different layers and neuron composition of different NN models, which differs depending on the objective. According to reviewed literature, NN structure with two hidden layers produced best results for the monthly load forecasting, the peak load forecasting and the daily total load forecasting modules [83]. However, one hidden layer is sufficient for most forecasting problems according to Zhang et al. [81]. In another study, the performance of the hierarchical model on long-term peak-load forecasts outperformed the multilayer perceptron [84]. Analysis of reviewed models revealed that 83% models utilized three layer neuron structure with one hidden layer. Only 6% and 17% models used two and four neuron layers respectively. 49%, 38%, 78% and 11% of the neuron structures had less than 5 neurons respectively in first, second, third and fourth layer. In the case of the first and second layer, 26% and 43% of the neuron structures respectively had neuron numbers between 5 and 10. Moreover, 23% and 18% neuron structures had more than 10 neurons in the first and second layers respectively. Only 8% neuron structures had more than 10 neurons in third layer, which is only 1% in fourth layer (Table 5).
<Insert Table 5 about here>
Support vector machine (SVM) was utilized in 58 forecasting models (Table 3). Yuan et al. developed a short-term wind power prediction model with least squares support vector machine (LSSVM), because the kernel function and the related parameters of the LSSVM influences the greater accuracy of the prediction [85]. Some of the models utilized Support vector regression (SVR), which is SVM applied to the case of regression. Ju et al. utilized SVR and seasonal SVR forecast electricity load in Taiwan [86]. Among the reviewed models, 41.4%, 22.4% and 20.7% forecasted electric load, renewable energy and energy & electricity demand.
13
Abductive networks is a machine learning method. It was found to be applied in two forecasting models (Table 3). Abdel-Aal, R.E. utilized AIM (abductory inductive mechanism) and GMDH (group method of data handling) approach for forecasting monthly energy demand. AIM is a supervised inductive machine-learning tool. It automatically develops abductive network models form database of input and output variables. GMDH is a learning algorithm and formalized paradigm for iterated (multi-phase) polynomial regression [87]. In another study, Abdel-Aal et al. utilized AIM monthly electric energy consumption in eastern Saudi Arabia and demonstrated that AIM performed better than that of regression method [88].
Decision tree develop an empirical tree which represents a segmentation of the data and able to classify and predict categorical variables. The segment are developed by applying a series of simple rules/logics. Advantage of the decision tree is that it produces a model which have segments of system with interpretable rules or logic statements [29]. However, it performs poorly with nonlinear and noisy data [80]. Tso et al. utilized decision tree method to predict electricity consumption in Hong Kong [29]. Yu et al. developed a building energy demand predictive model with decision tree and demonstrated high accuracy with 93% for training data and 92% for test data [89].
4.2.2
Knowledge based methods
Expert systems was applied in seven models (Table 3). Most of the models utilized expert system for short term load forecasting [90-94]. Ghanbari et al. applied cooperative ant colony
optimization-genetic algorithm (COR-ACO-GA) for energy demand forecasting with
knowledge-based expert systems, which yielded better accuracy [95]. In another study, Ghanbari et al. integrated ant colony optimization (ACO), genetic algorithm (GA) and fuzzy logic to develop a load forecasting expert system [96].
4.2.3
Uncertainty methods
Fuzzy logic was applied in 40 models (Table 3). In the analyzed models fuzzy method was proved to be efficient with incomplete or limited dataset. The theory of fuzzy sets is the foundation of the fuzzy logic. The basic description of the method can be found in [97].
Grey prediction (GM) belongs to family of grey system among which the GM (1, 1) model is the most frequently used.GM methods adopts essential part of grey theory (GT) which deals with systems with uncertain and deficient data [98, 99]. The real world systems are modelled with the assumptions based on the inadequate information [100]. GM method has been successfully adopted for forecasting models in different disciplines.Among the reviewed models, twenty-nine models applied GM. The basic description of the method can be found in [101].
14
Evolutionary methods are subset of metaheuristic methods which uses mechanisms inspired by natural biological evolution, such as reproduction, mutation, recombination, and selection. There were several types of metaheuristic methods applied in forecasting models-
Genetic algorithm (GA)was utilized in thirty-nine forecasting models. The basic description of the method can be found in [102]. Forouzanfar et al. forecasted natural gas consumption for residential and commercial sectors in Iran with LoR. However, to make process simpler, two different methods are proposed to estimate the logistic parameters, of which one was GA based [103]. Zhang et al. utilized stimulated annealing algorithms with chaotic GA to develop a hybrid method to assist a SVR model to improve load forecasting performance [104]. Assareh et al. applied GA for forecasting energy demand [105] and oil demand [106] in Iran based on
population, GDP, import, and export. Chaturvedi et al. applied GA for electric load forecasting [107]. The objective of the models, purpose of GA in that model and the publishing year can be found in Table 6. Among the reviewed models, 27% utilized GA for parameter optimization in the hybrid methods.
<Insert Table 6 about here>
Evolutionary algorithm (EA) was utilized in only one forecasting model. Wang et al. utilized a hybrid optimization method based on evolution algorithm and particle swarm optimization to improve accuracy of forecasting ARMAX model [50].
Memetic algorithm (MA) was applied in one forecasting model. For forecasting electricity load, Hu et al. applied firefly algorithm (FA) based memetic algorithm (FA-MA) to appropriately determine the parameters of SVR model [108].
Particle swarm optimization (PSO) was applied in 34 models (Table 3). Zhu et al. developed an improved hybrid model (MA-C-WH), which utilized MA and adaptive particle swarm
optimization (APSO) algorithm to forecast electricity demand in China. APSO was utilized to determine weight coefficients of the MA-C forecasting model and the objective function of this optimization problem was to minimize the MAPE [34]. Kiran et al. applied PSO to develop ACO-PSO hybrid method to forecast energy demand of Turkey [109]. The proposed ACO-PSO method by Kiran et al. was applied for to forecast the wind power output of Binaloud wind farm in Iran in [110]. Assareh et al. applied PSO for forecasting energy demand [105] and oil demand [106] in Iran based on based on population, GDP, import, and export. AlRashidi et al.
constructed long term electric load forecasting model with PSO [111]. Also for modelling and forecasting long-term natural gas consumption in Iran PSO was utilized [112]. Abdelfatah et al. constructed a global CO2 emissions froecasting model with PSO [113]. The objective of the models, purpose of PSO in that model and the publishing year can be found in Table 7. Among
15
the reviewed models, 33% utilized PSO for parameter optimization in the hybrid methods. The basic description of the method can be found in [114, 115].
<Insert Table 7 about here>
Artificial bee colony optimization (ABCO) was applied in four forecasting models among the reviewed models (Table 3). For forecasting world CO2 emissions, BCO was utilized for finding optimal values of weighting factors for forecasting [116]. Chaotic artificial bee colony algorithm was applied for electric load forecasting to determine suitable values of its three parameters for forecasting [117].
Ant colony optimization (ACO) was utilized in ten forecasting models (Table 3). For energy demand forecasting, Ghanbari et al. applied Cooperative Ant Colony Optimization (COR-ACO) to learn linguistic fuzzy rules (degree of cooperation between data base and rule base), which would yield better accuracy [95]. In another study, Ghanbari et al. applied ACO-GA to generate optimal knowledge base (KB) for expert system to forecast load [96]. Niu et al. applied ACO with SVM model to forecast short-term power load, where ACO to pre-process the data which influence uncertain factors in forecasting [118]. NOx emission forecasting model for Iran utilized ACO to estimate optimal values of weighting factors regarding actual data in [119]. To estimate energy demand of Turkey, ACO was applied in [120]. In another study, to forecast energy demand of Turkey, ACO was applied to develop ACO-PSO hybrid method [109]. For estimating the net electricity energy generation and demand of Turkey, ACO was applied based on the GDP, population, import and export [121]. ACO based hybrid method was applied for to forecast the wind power output of Binaloud wind farm in Iran in [110]. Yu et al. applied ACO to forecast energy demand of China [122] and primary energy demand of China [123].
Chaotic ant swarm optimization (CAS) is deterministic chaotic optimization method inspired by behaviors of real ants [124], which was utilized by two models (Table 3). Hong et al. for electric load forecasting. In the proposed model CAS was applied to improve the forecasting
performance of SVR by searching its suitable parameters combination [125]. For electric load forecasting with SVR model, Hong W.-C. applied CAS to determine suitable parameter combination for the model [126].
Differential evolution (DE) was applied in three of the analyzed models (Table 3). Wang et al. developed a load forecasting model with DE and SVR [127]. In another study, adaptive differential evolution (ADE) was applied with BPNN for developing method for electricity demand forecasting in [128]. For short term load forecasting Xiaobo et al. developed a GRA-DE-SVR model, where DE to optimize parameters of SVR model [129].
16
Gravitational search algorithm (GSA) was applied assist to develop three demand estimation models to forecast oil consumption based on socio-economic indicators in [130]. GSA was utilized to forecast electricity load in Taiwan to assist the seasonal SVR model in [86]. GSA was applied to optimize the parameters of the LSSVM model developed by Yuan et al. to short-term wind power prediction model [85]. Gavrilas et al. proposed a model of electric load forecasting with GSA combined with regression method and Kohonen neural networks [131].
Harmony search (HS) was utilized to develop HArmony Search Transport Energy Demand Estimation (HASTEDE) model, in a study conducted by Ceylan et al. to project the transport sector energy consumption in Turkey. The results demonstrated overestimation of transport sector energy consumption by about 26% and linear and exponential forms underestimate by about 21%, compared to Ministry of Energy and Natural Resources projections. The study pointed out the under and overestimation might be the outcome of the choice of modelling parameters and procedures [132].
Immune algorithm (IA) was applied for electric load forecasting model, where IA determined the parameter selection of SVR model [133].
Simulated annealing algorithms (SA) is an evolutionary method was applied in six models (Table 3). Zhang et al. utilized SA with chaotic GA to develop a hybrid method to assist a SVR model to improve load forecasting performance [104]. Pai et al. utilized SA algorithms were employed to choose the parameters of a SVM model to forecast electricity load in Taiwan [134]. Hong, W.-C. developed SVMSA model for load forecasting, where SA was applied to
determining appropriate parameter combination for SVR model [126].
Moreover, Firefly algorithm (FA) and Cuckoo search algorithm (CSA) are two metaheuristic methods utilized in four and two forecasting models respectively to develop hybrid methodology in recent times (Table 3).
4.3
Mathematical programming (MP)
Mathematical programming or mathematical optimization prescribes best solution/s from a set of available alternatives under some conditions. Among the analyzed models one mathematical programming methods were found- Nonlinear programming (NLP). Forouzanfar et al.
forecasted natural gas consumption for residential and commercial sectors in Iran with LoR. However, to make process simpler, two different methods are proposed to estimate the logistic parameters, of which one was GA based [103].
5
Hybrid methods
In some models, for specific reasons (i.e. parameter tuning, elevating accuracy) different stand-alone methods were combined to construct hybrid methods. Hybrid methods were utilized to
17
develop the assumptions and parameters in some forecasting models [135]. The hybrid methods found in analyzed models, can be divided in following four categories:
5.1
Statistical-statistical methods
Xu et al. combined MA and PCM to develop a Polynomial Curve and Moving Average Combination Projection (PCMACP) model to forecast natural gas consumption in China from 2009 to 2015. The model demonstrated, the average annual growth rate will increase and the natural gas consumption will reach 171600 million cubic meters in 2015 in China. [33]. To estimate the long-run elasticities of the Namibian energy demand, Vita et al. applied ARDL bounds testing approach to cointegration [66].
Tan et al. developed a day-ahead electricity price forecasting model by combining Wavelet (WT)–GARCH–ARIMA [136]. Bowden et al. applied ARIMA-EGARCH-M for short term forecasting of electricity prices [62]. Hickey et al. developed four ARMAX–GARCH models for forecasting hourly electricity prices. The four models were- GARCH (1,1), EGARCH (1,1), APARCH (1,1) and CGARCH (1,1) power ARCH (PARCH), where EGARCH is exponential GARCH; APARCH is asymmetric power ARCH; and CGARCH is Component GARCH [52]. Liu et al. developed GARCH models (SGARCH, QGARCH, ARMA-GJRGARCH, ARMA-EGARCH and ARMA-NGARCH) and their form of ARMA–GARCH-in-mean to forecast short-term electricity prices [137].
5.2
Statistical-CI methods
Pao developed hybrid nonlinear models with SEGARCH and WARCH with ANN to forecast energy consumption in Taiwan [61]. For wind speed forecasting Cadenas et al. developed a ARIMA-ANN model [138]. González-Romera et al. developed a hybrid method where the periodic behavior was forecasted with a Fourier series while the trend was predicted with a neural network [139]. For forecasting symbolic interval time series, Maia et al. developed a ARMA-ANN model, where it performed better than that of ARMA [140]. Kandananond, K. developed prediction models of the electricity demand in Thailand with ANN, MLR and
ARIMA methods to develop ANN-MLR and ANN-ARIMA hybrid methods [141]. ANN model using statistical feature parameters (ANN-SFP) and historical data series (ANN-HDS) was applied for sort-term solar irradiance forecasting (STSIF) [142]. Shi et al. applied ARIMA with ANN and SVM to develop two hybrid models of ARIMA-ANN and ARIMA-SVM for
forecasting of wind speed and wind power generation [143]. Bouzerdoum et al. developed SARIMA-SVM model for short-term power forecasting of a small-scale grid-connected photovoltaic plant [42]. Guo et al. developed a hybrid Seasonal Auto-Regression Integrated Moving Average and Least Square Support Vector Machine (SARIMA-LSSVM) model for forecasting wind speed in Hexi Corridor of China [43]. Wang et al. applied PSO optimal Fourier
18
approach on residual modification of SARIMA to develop F-S-SARIMA model to forecast electricity demand for China [44]. Wang et al. developed a combined model is to forecast electric load. For the model SARIMA, seasonal exponential smoothing (S-ESM) and Weighted SVM (W-SVM) was constructed by linear combination and APSO was utilized for determining weight coefficients of combined forecasting model [46]. Wang et al. applied seasonal decomposition with LSSVR for hydropower consumption forecasting in China [144].
Song et al. applied fuzzy regression analysis in the short-term load forecasting problem [19]. Xu et al. applied GM (1,1) with ARMA to develop GM-ARMA model to forecast energy
consumption for Guangdong Province of China [145]. Amin-Naseri et al. developed a model for daily electrical peak load forecasting (PLF) with feed forward neural network (FFNN) method, where the Davies–Bouldin validity index was introduced to determine the best clusters [146]. Forouzanfar et al. forecasted natural gas consumption for residential and commercial sectors in Iran by utilization of LoR. However, GA based approach was proposed to estimate the logistic parameters, to make process simpler [103]. Zhu et al. developed an improved hybrid model (MA-C-WH), which utilized MA and adaptive particle swarm optimization algorithm to forecast electricity demand in China [34]. A electric load forecasting model was developed with
regression method combined with GSA or Kohonen neural networks [131]. GSA was applied to estimate optimal weighting factors for three demand estimation models to forecast oil
consumption based on socio-economic indicators up to 2030 [130].
5.3
CI-CI methods
To forecast solar radiation, Chen et al. developed a fuzzy neural network (FNN) model with ANN and fuzzy logic [147]. Fuzzy neural network was applied for day-ahead price forecasting of electricity markets in [148]. Bazmi et al. utilized adaptive neuro-fuzzy network (ANFIS) for electricity demand forecasting for state of Johor, Malaysia [149]. In another study, Zahedi et al. applied neuro-fuzzy network for electricity demand forecasting for Ontario province, Canada [150]. Esen et al. utilized neuro-fuzzy network for forecasting performances of ground-coupled heat pump system [151]. Forecasting model of mean hourly global solar radiation was developed with ANFIS [152]. Akdemir et al. utilized ANFIS for long-term load forecasting [153]. Chen et al. applied a collaborative principal component analysis and fuzzy feed- forward neural network (PCA-FFNN) approach for long term load forecasting [154]. In another study Chen, T. applied a collaborative fuzzy-neural approach for long term load forecasting [155]. Chang et al. applied weighted evolving fuzzy neural network for monthly electricity demand forecasting in Taiwan [156]. FNN was also applied for short term load forecasting in [157-159]. Padmakumari et al. applied FNN for long term land use based distribution load forecasting [160].
19
In case of metaheuristic methods, genetic algorithm (GA), Particle swarm optimization (PSO) and Ant colony optimization (ACO) were mostly utilized methods. El-Telbany et al. applied PSO and BP algorithm to train NN model to forecast electricity demand in Jordan [161]. Ghanbari et al. applied cooperative ant colony optimization-genetic algorithm (COR-ACO-GA) for energy demand forecasting with knowledge-based expert systems, which yielded better accuracy than ANFIS and ANN [95]. Ghanbari et al. integrated ACO, GA and fuzzy logic to develop hybrid method to construct a load forecasting expert system for Iran in [96]. Niu et al. developed ACO-SVM model for forecasting short-term power load [118]. NOx emission
forecasting model for Iran, where GA, PSO and ACO was applied to estimate optimal values of weighting factors regarding actual data in [119]. In another study, to forecast energy demand of Turkey, ACO-PSO based hybrid method was applied [109]. Hybrid ACO-PSO method was applied for to forecast the wind power output of Binaloud wind farm in Iran in [110]. To forecast Annual electricity demand, Yu et al. utilized GA to optimizes the structure and PSO-GA to the parameters of the basis and weights of the Radial Basis Function (RBF) neural network [162]. Yu et al. applied PSO–GA approach to forecast energy demand of China [122] and primary energy demand of China [123]. In another study, Yu et al. utilized improved PSO-GA to forecast energy demand for China [163]. Lee et al. constructed a GP-based GM(1, 1) model [164] and hybrid dynamic GPGM model [165] to predict energy consumption.
Hu et al. applied firefly algorithm (FA) based memetic algorithm (FA-MA) to appropriately determine the parameters of SVR model for load forecasting [108]. Hong, W.-C. developed IA-SVR model for electric load forecasting [133]. Fan et al. integrated two machine learning techniques: Bayesian clustering by dynamics (BCD) and SVR to forecast the electricity load [166].
Hsu et al. developed an improved GM (1, 1) model, that combines residual modification with ANN sign estimations [167]. For predicting hourly load demand Bashir et al. applied ANNs and utilized PSO algorithm to adjust the network’s weights in the training phase of the ANNs [168]. Xie et al. constructed improved natural gas consumption GM (1, 1) model by applying GM for optimizing parameters [169].
Zhang et al. utilized SA with chaotic GA to develop a chaotic genetic algorithm-simulated annealing algorithm (CGASA), with an SVR model to improve load forecasting. The proposed CGASA was utilized for internal randomness of chaotic iterations to overcome premature local optimum, which yielded better accuracy [104]. SA algorithms were employed to choose the parameters of a SVM model to develop SVMSA method to forecast electricity load in Taiwan in [134]. Ko et al. combined SVR, radial basis function neural network (RBFNN), and dual
20
forecasting [170]. To forecast electric load, CAS was applied to improve the forecasting performance of SVR by searching its suitable parameters combination in [125]. Azadeh et al. developed electrical energy consumption forecasting models with GM-ANN method, where GA tuned parameters and the best coefficients with minimum error were identified for ANN [171]. Cinar et al. applied GA to determine the hidden layer neuron numbers for GA-FFBPNN model to forecast the hydro energy potential of Turkey [172]. Xiaobo et al. developed a GRA-DE-SVR model for short term load forecasting with DE and SVR [129].
For forecasting world CO2 emissions, BCO was utilized for finding optimal values of weighting factors for forecasting with ANN [116]. In another study, chaotic artificial bee colony algorithm was applied to determine suitable values of its three parameters for electric load forecasting [117]. Continue genetic algorithm was applied to determine the number of neurons in the hidden layer and connecting weights for ANN model to forecast short term electricity load [173]. For accurate forecasting of electric load, Hong W.-C. applied CAS, CGA, CPSO and SA with SVR model, to determine suitable parameter combination for the model [126].
GSA was utilized to assist the seasonal SVR model to develop SVRGSA and SSVRGSA for forecasting electricity load in Taiwan in [86]. Yuan et al. developed a LSSVM-GSA model to short-term wind power prediction model where GSA was applied to optimize the parameters of the LSSVM [85]. Niu et al. applied particle swarm optimization (PSO) as a training algorithm to obtain the weights of the forecasting methods (i.e. method of proportional (MP), LR, GM and BPNN) [115]. Wang et al. developed a load forecasting model with DE and SVR, where DE algorithm was used to choose the appropriate parameters for the SVR model [127]. Wang et al. applied ADE-BPNN forecasting method for developing prediction for electricity demand
compared with different methods (i.e. ARIMA, BPNN, GA–BPNN, DE–BPNN, SSVRCGASA and TF-e-SVR-SA) [128]. Cao et al. applied quantum-behaved particle swarm optimization (QPSO) to optimize the parameters for the SVR model and developed a SVR-QPSO model to forecast the energy demand of China [174].
5.4
Statistical-MP methods
Forouzanfar et al. forecasted natural gas consumption for residential and commercial sectors in Iran by utilization of LoR. However, NLP and GA based approach were proposed to estimate the logistic parameters, to make the process simpler [103].
6
Discussion
6.1
Accuracy
An accurate forecasting of energy (demand and supply) and relevant parameters is critical to making informed decisions on energy infrastructure for power generation and distribution.
21
Forecasting accuracy is determined using different performance evaluation measures. Root mean square error (RMSE), mean absolute error (MAE), and mean absolute percentage forecast error (MAPE) were mostly utilized [61, 115, 134, 147, 175-177]. Among other methods, mean absolute deviation (MAD), normalized root-mean-square error measure (NRMSE), standard error of prediction (SEP) and absolute relative error (ARE) were also applied [44, 134, 145, 175]. The accuracy evaluation methods were different in various models. The different choice of accuracy methods made is hard to categorize the methods from best to worst, because the methods were not evaluated with same data or for similar objective. Under this circumstances, this study focused on the accuracy results of the reviewed models and their comparisons to find out which model performs better in specific objective (Table 8).
This study found that combination of statistical methods performs better than that of stand-alone statistical methods and in most of the cases, CI methods outperformed statistical methods. Moreover, hybrid methods performed superiorly in accuracy to CI methods (Table 8). In case of forecasting nonlinear and discontinuous data, machine learning methods performed better than that of statistical methods [81, 167, 178]. When the relationship between the variables is not known or complex machine learning methods can forecast the data, which is difficult to handle statistically [179]. In some studies, authors combined machine learning methods with statistical methods to increase the accuracy [88, 139, 143, 151, 180]. However, machine learning methods tend to be complex in learning and application, while statistical methods are easy to adopt [181]. Some authors noted the learning complexity of methods influence the choice of forecasting techniques [103]. Data availability also effects the choice of forecasting method. ANN is a data driven method and requires large amount of data for higher forecasting accuracy [182]. In case of incomplete data sets, fuzzy logic is better. However, the accuracy level is not always satisfactory [182]. Grey prediction is another useful method while working with uncertainty problems with small sample; incomplete and discrete data [183, 184]. Significant numbers of authors advocated the utilization of hybridization methods to enhance the accuracy of the forecasting models. On the other hand, it would add more complexity in the model structure.
<Insert Table 8 about here>
6.2
Time analysis
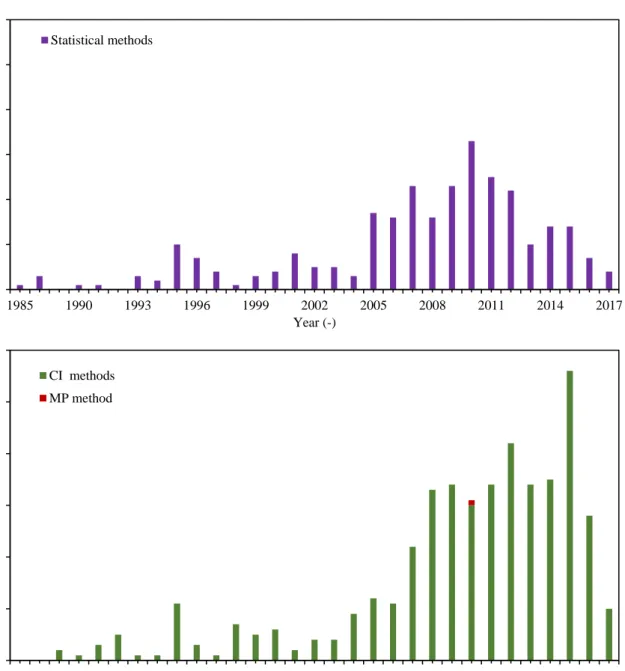
Based on the analysis of the previous EPMs, the research on forecasting models started on 1985, after the oil shock/crisis of 1970’s (Figure 4). At the starting period the number of models were low. After the United Nations Framework Convention on Climate Change (UNFCCC)
committed State Parties to reduce GHG gas emission created by man-made CO2 emission systems, the development of forecasting EPMs started to rise from 1995 because energy sector has been one of the highest global emissions source.
22
<Insert Figure 4 about here>The number of models started to increase from 2005, when the Kyoto Protocol was entered into force in 2005. The number of models published escalated from 12 to 25 within 2004-2005. In the last 12 years, 76% EPMs were developed (Figure 4). The highest number of models (46) were developed in 2010. However, the number of EPMs reduced to 34 in 2011 & 2012. In 2013 and 2014, the published model number reduced to 20 and 24 respectively. The EPM number elevated to 27 in 2015. Up to June 2017, six models were published with the objective of forecasting in energy planning sector.
Among the forecasting methods, statistical methods were the first to rise in use from 2005. Before 1990, statistical methods were mostly utilized (Figure 5). After 1990’s use of machine learning methods started to rise. From 2007, the use of machine learning methods augmented significantly as well as with statistical methods. After 2009 the integration of metaheuristic methods in forecasting started to grow. In 2015, 56 models utilized CI methods which is four times more than that of the statistical ones (14 models). The CI method use is demonstrating an exponential growth in past 12 years, where statistical methods are showing a gradual descend since 2010 (Figure 5). Major cause of the growth maybe the better accuracy of the CI methods (Table 8) and elevated speed in computational capabilities [185].
<Insert Figure 5 about here>
6.3
Geographical analysis
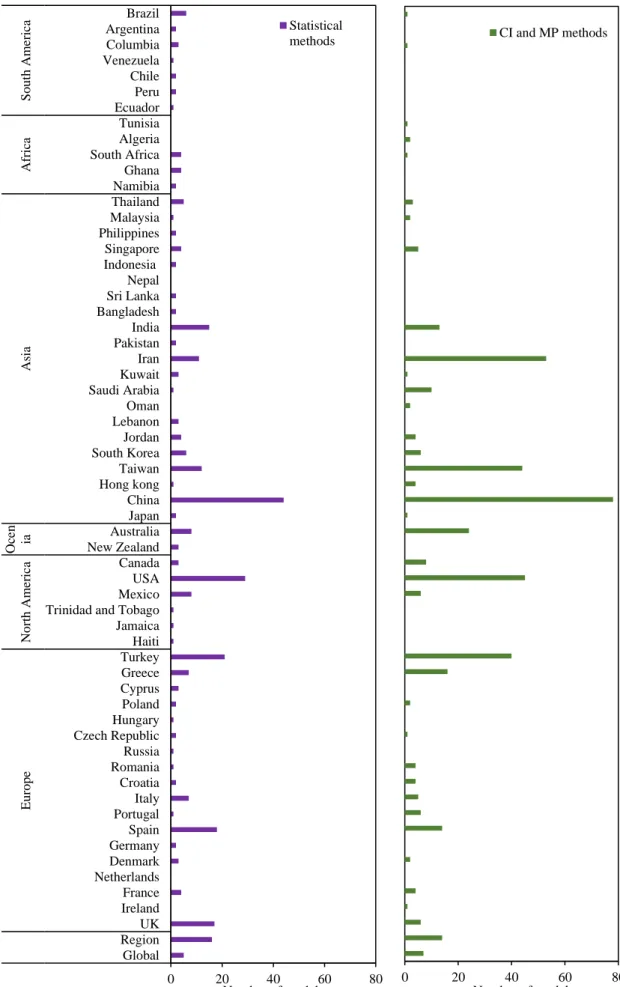
Continent wise, all the continents with human habitation developed EPMs. According to United Nations, there 269 countries in the world [186]. Among these countries, forecasting models were developed for only 59 countries. Among all the countries, highest number of forecasting models were developed in China. Total 122 models were developed with 27 different methods of the 50 analyzed methods of this study.
In Europe, there are 53 countries [186], but only 18 countries developed energy planning
forecasting models. The countries were- UK, Ireland, France, Netherlands, Denmark, Germany, Spain, Portugal, Italy, Croatia, Romania, Russia, Czech Republic, Hungary, Poland, Cyprus, Greece and Turkey. But most of the models were developed in the UK, Turkey, Spain and Greece (Figure 6).
There are 41 counties in North America [186]. But only 6 countries (Haiti, Jamaica, Trinidad and Tobago, Mexico, USA and Canada) developed models for energy forecasting. Most of the models among these countries were developed in USA (Figure 6).
23
The continent of Oceania contains 25 countries [186], of which only Australia and New Zealand developed models. In this region other 23 countries of Melanesia, Micronesia and Polynesia are considered developing regions [186]. This concludes the fact that in this continent only
developed countries established energy forecasting models.
In Asia Japan, China, Hong Kong, Taiwan, South Korea, Jordan, Lebanon, Oman, Saudi Arabia, Kuwait, Iran, Pakistan, India, Bangladesh, Sri Lanka, Nepal, Indonesia, Singapore, Philippines, Malaysia and Thailand developed forecasting models for energy planning. So, 21 countries among 50 countries [186] of the continents developed forecasting models. In Asia, the only developed economy is established in Japan. Along with Japan, other developing countries also established some models. In Asia, China, Taiwan, Iran and India developed higher number of forecasting models.
Africa has 58 countries, of which only 5 courtiers developed forecasting models. Namibia, Ghana, Algeria, Tunisia and South Africa established 2, 4, 2, 1 and 5 models respectively. Among 14 countries of South America, Ecuador, Peru, Chile, Venezuela, Columbia, Argentina and Brazil adopted forecasting model for energy planning. Brazil developed most number of models.
Among the studied 483 models, twelve models were developed for global forecasting (Table 2). LR, ANN, GA, ABCO and PSO were utilized for forecasting for global geographical extend (Figure 6).
However, 30 models were established for regional geographical extend. The regions considered were- OECD countries, G-7 countries, Europe, CIS Countries, GCC countries, BRIC country, Middle East, North America, South America, Asia and developing countries. Among the 30 models, 8 models were developed for Europe. From the analysis of the geographical extend, it is evident that developed economics have more EPMs than that of developing and least developed ones (Figure 6). Statistical methods are utilized for developed, developing and least developed contexts. However, CI methods are widely used in developed contexts (Figure 6).
<Insert Figure 6 about here>
6.4
Objective based analysis
The studied EPMs had different objectives. From the analysis of 483 models, 11 objectives were identified (Table 9). These were energy and electricity demand, energy supply, renewable energy, GHG emissions, energy economic, socio-economic, energy and electricity price , load
forecasting, planning and/or policy analysis, performance analysis and model development. Among the 28 statistical forecasting methods, ARIMA was used for 9 objectives, while LR
24
complied with 7 objectives, followed by ARMA (6 objectives) (Table 9). Among the 28 statistical methods, 24 methods were utilized for energy and electricity demand forecasting in 53.9% of the reviewed 483 models (Table 9).
Among the CI and MP methods, ANN was utilized for 9 objectives, followed by GM and PSO both for 7 objectives. FL, SMV and ACO were utilized for seven objectives each. Moreover, GA were utilized for achieving six of the objectives (Table 10). Among the 22 CI and MP methods, 17 and 14 methods were utilized for energy and electricity demand, and electric load forecasting respectively. In the reviewed 483 models, 73%, 38%, 18% and 13% of the model objectives were energy and electricity demand, electric load, renewable energy, and energy & electricity price forecasting respectively. For energy and electricity demand forecasting, statistical methods were used in 18% more models than that of CI and MP. However, CI methods were utilized in 28% and 4% more in electric load and renewable energy forecasting models respectively than that of statistical ones (Figure 7).
<Insert Figure 7 about here>
Among the 50 analyzed methods, maximum number of methods (25 statistical, 12 CI and one MP) were utilized to develop energy and electricity demand forecasting models. Second highest number of methods (8 statistical and 18 CI) were utilized to forecast electric load. Third highest number of methods (7 statistical and 9 CI) were used to renewable energy forecasting (Table 9 and Table 10).
<Insert Table 9 about here> <Insert Table 10 about here>
7
Conclusion
Energy planning models assist stakeholders assess the impact of current and future energy
policies. The accuracy of EPMs depend on applying appropriate forecasting methods for demand and supply sector projections. Among all the forecasting methods, choice of appropriate one depends on different factors. The complexity and nature, as well as, the objective of the research problem is one of the key determinant of method choice. Other important factors of forecasting method selection can be accuracy and estimation adaptability with incomplete data-set. The review of 483 EPMs, revealed the use of fifty different methods between 1985 and June, 2017. Among the 50 identified methods, statistical, computational intelligence (CI) and mathematical programming (MP) methods were 28, 21 and one respectively. Among CI methods, ANN was utilized in 194 EPMs, followed by SVM (58 models), FL (40 models), GA (39 models), PSO (34 models) and GM (29 models). In the case of statistical methods, ARIMA,
25
LR and ARMA were utilized in 46, 39 and 22 EPMs respectively for forecasting. Evidently, CI methods were widely utilized than that of statistical ones for electric load and renewable energy forecasting. However, statistical methods were used in 18% more models than that of CI and MP for energy and electricity demand forecasting. The accuracy of CI methods for forecasting were better than that of statistical ones. Significant number of forecasting models utilized multiple stand-alone methods to develop hybrid approach, because they yielded higher accuracy than that of stand-alone ones. In case of incomplete data-set, some CI methods such as fuzzy logic and grey prediction outperformed other stand-alone ones.
The analysis of the studied model objectives showed that most of the forecasting methods were applied to forecast energy demand and electricity load. The development of the forecasting models started from 1985, it spiked after 2005 and it is still continuing. Most number of models were developed in 2010. In case of the geographical extend, although most of the models were established for developed countries, some of the developing countries also established forecasting models. The highest number of models were developed for China.
26
References
1. Solomon, S., et al., Irreversible climate change due to carbon dioxide emissions. Proceedings of the national academy of sciences, 2009. 106(6):1704-09.
2. Le Quéré, C., et al., Trends in the sources and sinks of carbon dioxide. Nature Geoscience, 2009.
2(12):831-36.
3. Ramanathan, V. and Y. Feng, On avoiding dangerous anthropogenic interference with the climate
system: Formidable challenges ahead. Proceedings of the National Academy of Sciences, 2008. 105(38):14245-50.
4. Wigley, T.M., The climate change commitment. Science, 2005. 307(5716):1766-69.
5. Friedlingstein, P. and S. Solomon, Contributions of past and present human generations to committed
warming caused by carbon dioxide. Proceedings of the National Academy of Sciences of USA, 2005. 102(31):10832-36.
6. Ha-Duong, M., M.J. Grubb, and J.-C. Hourcade, Influence of socioeconomic inertia and uncertainty on
optimal CO2-emission abatement. Nature, 1997. 390(6657):270-73.
7. Davis, S.J., K. Caldeira, and H.D. Matthews, Future CO2 emissions and climate change from existing
energy infrastructure. Science, 2010. 329(5997):1330-33.
8. Mourshed, M. and M.A. Quddus, Renewable energy RD&D expenditure and CO2 emissions in 15
European countries. International Journal of Energy Sector Management, 2009. 3(2):187-202.
9. Nguyen, Q.K., Long term optimization of energy supply and demand in Vietnam with special reference
to the potential of renewable energy. 2005, University of Oldenburg.
10. Barsky, R. and L. Kilian, Oil and the Macroeconomy since the 1970s. 2004, National Bureau of Economic Research.
11. Mathur, J., Development of a modified dynamic energy and greenhouse gas reduction planning
approach through the case of Indian power sector, in Mechanical and Process Engineering. 2001,
University of Duisburg-Essen.
12. Mondal, M.A.H., Implications of renewable energy technologies in the Bangladesh power sector:
Long-term planning strategies, in Institute of Agricultural Engineering/Center for Development Research (ZEF). 2010, University of Bonn.
13. Bolin, B., et al., IPCC Second Assessment Synthesis of Scientific-Technical Information relevant to
interpreting Article 2 of the UN Framework Convention on Climate Change. 2008.
14. Pfenninger, S., A. Hawkes, and J. Keirstead, Energy systems modeling for twenty-first century energy
challenges. Renewable and Sustainable Energy Reviews, 2014. 33:74-86.
15. Suganthi, L. and A.A. Samuel, Energy models for demand forecasting—A review. Renewable and Sustainable Energy Reviews, 2012. 16(2):1223-40.
16. Weron, R., Modeling and forecasting electricity loads and prices: a statistical approach. Vol. 403. 2007: John Wiley & Sons.
17. Grubb, M., et al., The costs of limiting fossil-fuel CO2 emissions: a survey and analysis. Annual Review of Energy and the Environment, 1993. 18(1):397-478.
18. Dodge, Y., The Oxford dictionary of statistical terms. 2006: Oxford University Press.
19. Song, K.-B., et al., Short-term load forecasting for the holidays using fuzzy linear regression method. Power Systems, IEEE Transactions on, 2005. 20(1):96-101.
20. Bilgili, M., et al., Electric energy demands of Turkey in residential and industrial sectors. Renewable and Sustainable Energy Reviews, 2012. 16(1):404-14.
21. Ghiassi, M. and S. Nangoy, A dynamic artificial neural network model for forecasting nonlinear
processes. Computers & Industrial Engineering, 2009. 57(1):287-97.
22. Tsekouras, G.J., et al., A non-linear multivariable regression model for midterm energy forecasting of
power systems. Electric Power Systems Research, 2007. 77(12):1560-68.
23. Charytoniuk, W., M.-S. Chen, and P. Van Olinda, Nonparametric regression based short-term load
forecasting. Power Systems, IEEE Transactions on, 1998. 13(3):725-30.
24. Wang, C., et al., Short-term Wind Power Forecast Based on Non-parametric Regression Model [J]. Automation of Electric Power Systems, 2010. 16:78-82.
25. Jónsson, T., P. Pinson, and H. Madsen, On the market impact of wind energy forecasts. Energy Economics, 2010. 32(2):313-20.
26. Zhang, M., et al., Forecasting the transport energy demand based on PLSR method in China. Energy, 2009. 34(9):1396-400.
27
27. Meng, M. and D. Niu, Annual electricity consumption analysis and forecasting of China based on few
observations methods. Energy Conversion and Management, 2011. 52(2):953-57.
28. Ekonomou, L., Greek long-term energy consumption prediction using artificial neural networks. Energy, 2010. 35(2):512-17.
29. Tso, G.K.F. and K.K.W. Yau, Predicting electricity energy consumption: A comparison of regression
analysis, decision tree and neural networks. Energy, 2007. 32(9):1761-68.
30. Rao, R.D. and J.K. Parikh, Forecast and analysis of demand for petroleum products in India. Energy Policy, 1996. 24(6):583-92.
31. Aranda, A., et al., Multiple regression models to predict the annual energy consumption in the Spanish
banking sector. Energy and Buildings, 2012. 49(0):380-87.
32. Azadeh, A., S.F. Ghaderi, and S. Sohrabkhani, Forecasting electrical consumption by integration of
Neural Network, time series and ANOVA. Applied Mathematics and Computation, 2007.
186(2):1753-61.